2016 began with a global stock market rout, but this weakness in the major US stock indices was preceded by a deteriorating picture for individual stocks in the broader market several months earlier. One key statistic to highlight this trend: back in late 2015, researchers at Strategas Partners found that the 10 largest stocks in the S&P 500 had accounted for more than 100% of the index's gains that year.
Narrow market: 10 largest stocks in the S&P 500 account for > 100% of 2015's gains. $SPX $AAPL $GE $MSFT pic.twitter.com/iwZDiqd6rh— Finance Trends (@FinanceTrends) November 20, 2015
Now, as we look at the market in 2016, we see an environment that is not only punishing for the leading averages, but for the leading big cap stocks as well. While the FANG stocks (Facebook, Amazon, Netflix, and Google) powered the market higher for most of last year, their 2016 start has not been as stellar. Year-to-date SPY is down 7%, while FB is also down 7%, AMZN is down 11%, NFLX is down 15%, and GOOG is down 6%.
Meanwhile, the average stock is down in 2016. Stocks that are down year-to-date far outnumber those showing a gain YTD. Set your stock screeners to Finviz and run a quick performance scan. You'll find (today) that, of the stocks and ETFs trading at least 100,000 shares per day, 3,736 are down YTD while only 435 are positive. That's a margin of over 8:1 in favor of declining stocks. Not an easy arena in which to boost your investing returns.
So which stocks are outperforming in this tough environment? Well, the REITs and utilities highlighted in our previous defensive stocks post continue to hold up relatively well vs. the S&P 500. I'm also finding a few bright spots in consumer names like Campbell Soup (CPB) and Reynolds American (RAI), and in gold mining shares such as Barrick Gold (ABX), Harmony Gold (HMY), DRD Gold (DRD) and Richmont Mines (RIC).
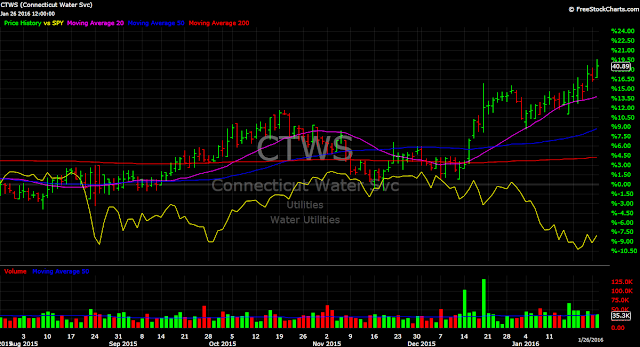
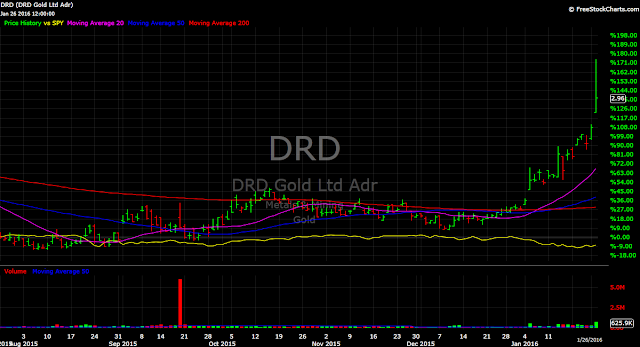
Let's take a quick look at these stocks on their daily charts. You'll see each stock's price and its percentage returns (over the past 6 months) plotted against the performance of the S&P 500 ETF (SPY), shown in yellow.
Reynolds RAI is up 19% over 6 months vs. SPY down 8%.

Campbell CPB is +14% over 6 months vs. SPY -8%. It is one of the only US stocks currently near its 10-year high.

Connecticut Water CTWS, also at a 10-year high, is +19% over 6 months vs. SPY -8%.

AT&T T has held up particularly well since the start of the year. It is +3% vs. SPY -8%.

Barrick Gold ABX has really taken off since January and is +38% over 6 months vs. SPY -8%

DRD Gold DRD, another gold mining stock I recently highlighted, is +136% over 6 months vs. SPY -8%

Finally, Richmont Mines RIC is a gold name that has shown unusual relative strength for some time. The stock is +43% over 6 months vs. SPY -8%.
Are there other names showing notable strength vs. the Dow and the S&P? Of course, but these are prime examples of some of the larger, more liquid stocks you may find in your research as you run your own stock scans.
