Biotech company Vertex Pharmaceuticals (NASDAQ: VRTX) reported Q3 2026 results exceeding the market’s revenue expectations, with revenue up 11.8% year on year to $3.44 billion. On the other hand, the company’s full-year revenue guidance of $13.2 billion at the midpoint came in 0.6% below analysts’ consensus estimates. Its non-GAAP profit of $4.76 per share was 0.5% below analysts’ consensus estimates.
For more on Vertex Pharmaceuticals, read our free full research report.
Vertex Pharmaceuticals (VRTX) Q3 2026 highlights:
- Revenue $3.44 billion vs S&P analysts’ consensus estimates of $3.42 billion (11.8% year-on-year growth, 0.7% beat)
- Adjusted EPS $4.76 vs S&P analysts’ consensus estimates of $4.78 (0.5% miss)
- Adjusted operating income $1.41 billion vs analysts’ consensus estimates of $1.44 billion (41% margin, 2.2% miss)
- Revenue guidance The company slightly raised its full-year revenue guidance to $13.2 billion at the midpoint from $13.15 billion
- Operating margin 20.7%, down from 38.6% in the same quarter a year earlier
- Market capitalization $141.7 billion
“Vertex delivered excellent third quarter results marked by strong revenue growth across the increasingly diversified portfolio, continued advancement of the R&D pipeline, and the successful close of the Crinetics Pharmaceuticals acquisition,” said Reshma Kewalramani, M.D., Chief Executive Officer and President of Vertex. “With the potential povetacicept approval in IgAN coming later this month, we are well positioned to establish nephrology as our fifth commercial franchise and expand the reach of our transformative medicines to even more patients.”
Revenue growth
A company’s long-term revenue performance is one signal of its overall quality. Any business can deliver a good quarter or two, but the best consistently grow over the long term. Over the last five years, Vertex Pharmaceuticals grew its revenue at a solid 12.7% compounded annual growth rate. Its growth beat the average healthcare company and shows its offerings resonate with customers.
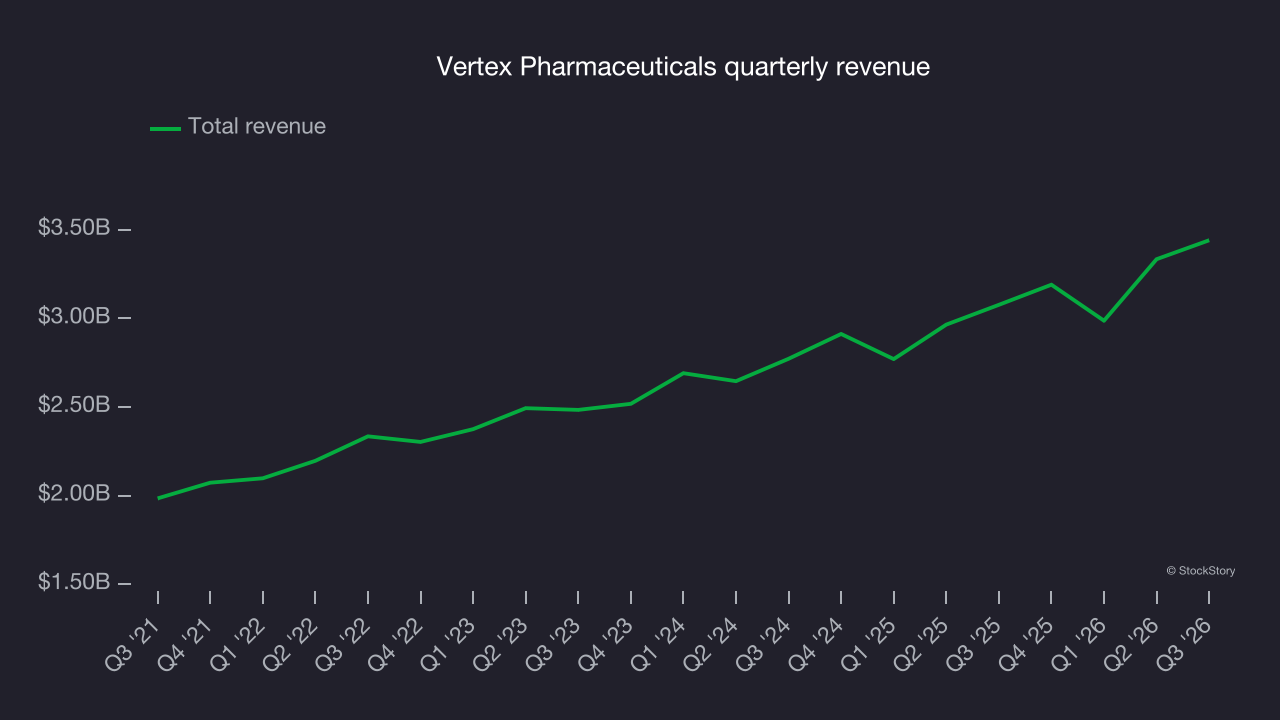
Long-term growth is the most important, but within healthcare, a half-decade historical view may miss new innovations or demand cycles. Vertex Pharmaceuticals’s annualized revenue growth of 10.4% over the last two years is below its five-year trend, but the results were still respectable. 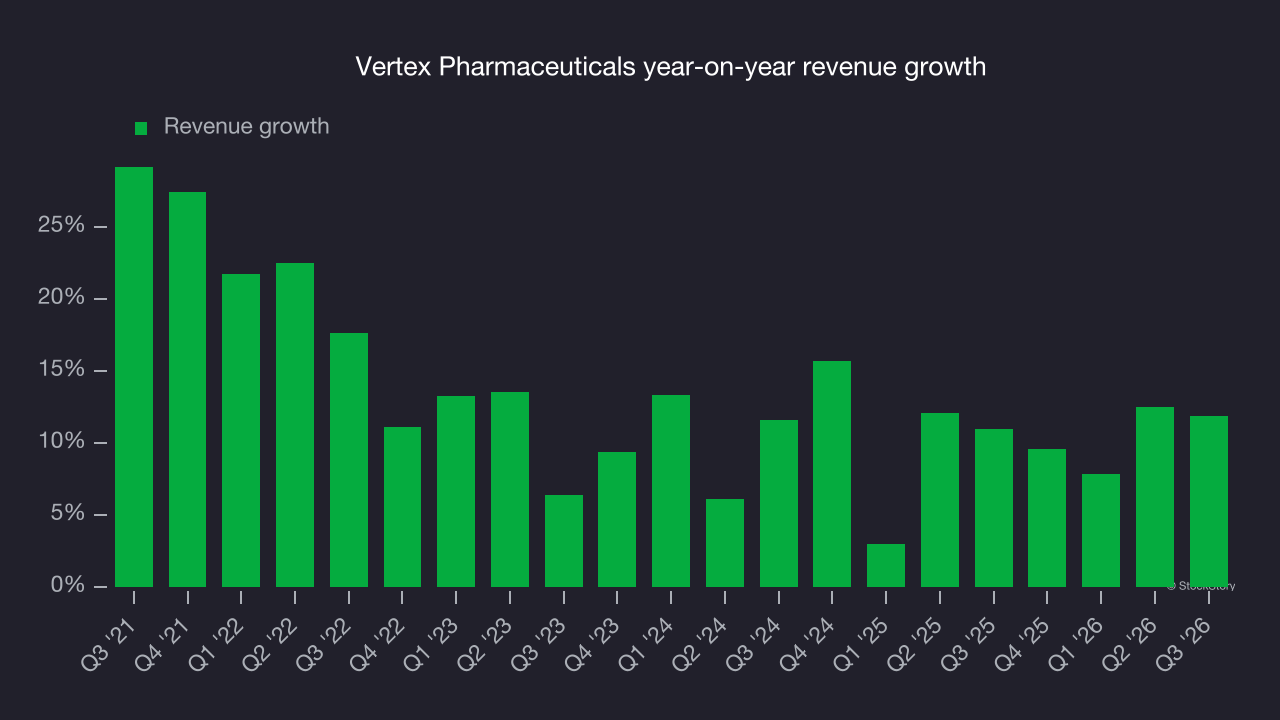
This quarter, Vertex Pharmaceuticals reported year-on-year revenue growth of 11.8%, and its $3.44 billion of revenue exceeded Wall Street’s consensus estimates by 0.7%.
Looking ahead, sell-side analysts expect revenue to grow 9.2% over the next 12 months, according to S&P, similar to its two-year rate. Its growth trajectory remains attractive given its scale and suggests the market is pricing in success for its products and services.
Adjusted operating margin
Adjusted operating margin is a key measure of profitability. Think of it as net income (the bottom line) excluding the impact of non-recurring expenses, taxes and interest on debt – items less connected to business fundamentals.
Vertex Pharmaceuticals has performed well over the last five years. It demonstrated high profitability for a healthcare business, with an average adjusted operating margin of 38%.
Looking at the trend in its profitability, Vertex Pharmaceuticals’s adjusted operating margin decreased by 12.2 percentage points over the last five years, but it rose by 36.5 percentage points on a two-year basis. Vertex Pharmaceuticals remains appealing, but its longer-term margin trend still needs to improve.
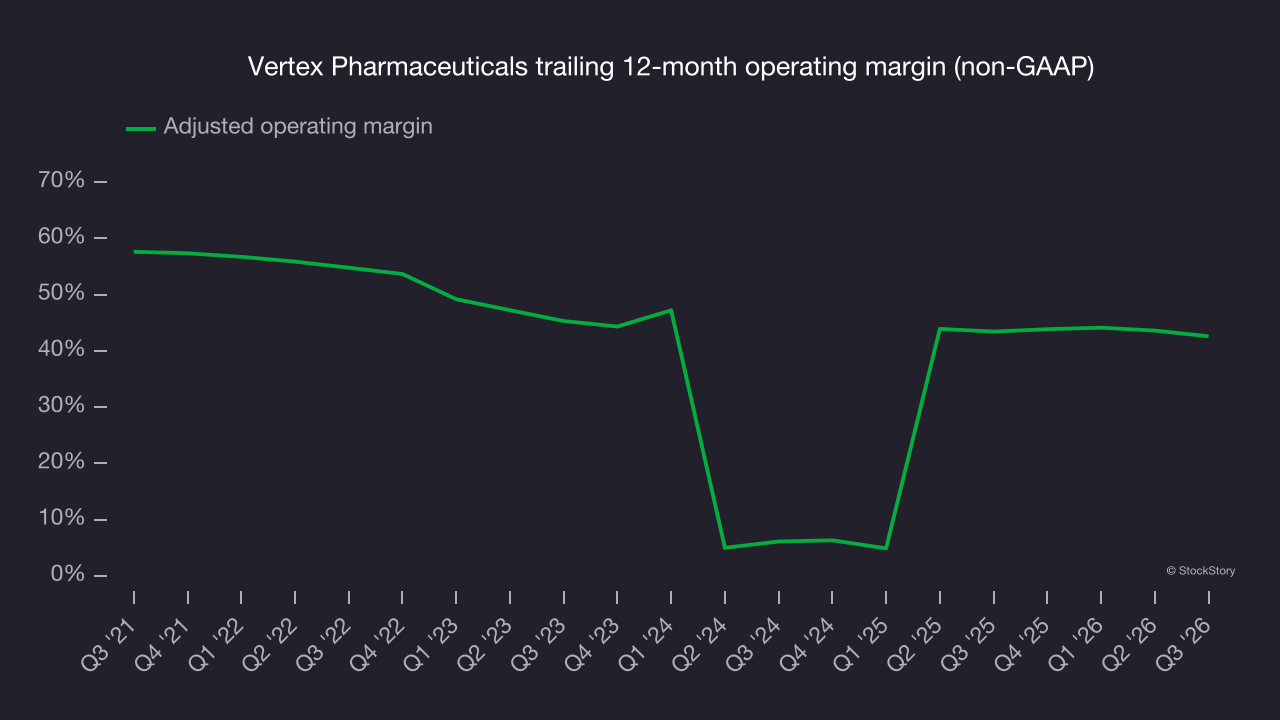
This quarter, Vertex Pharmaceuticals generated an adjusted operating margin of 41%, down 4 percentage points year on year. This contraction shows it was less efficient because its expenses grew faster than its revenue.
Earnings per share
Long-term earnings per share, or EPS, growth matters for the same reason as long-term revenue growth. Compared to revenue, however, EPS highlights whether a company’s growth is profitable.
Vertex Pharmaceuticals’s EPS grew at a 9.3% compounded annual growth rate over the last five years. However, this performance trailed its 12.7% annualized revenue growth, indicating the company became less profitable on a per-share basis as it expanded due to non-fundamental factors such as interest expenses and taxes.
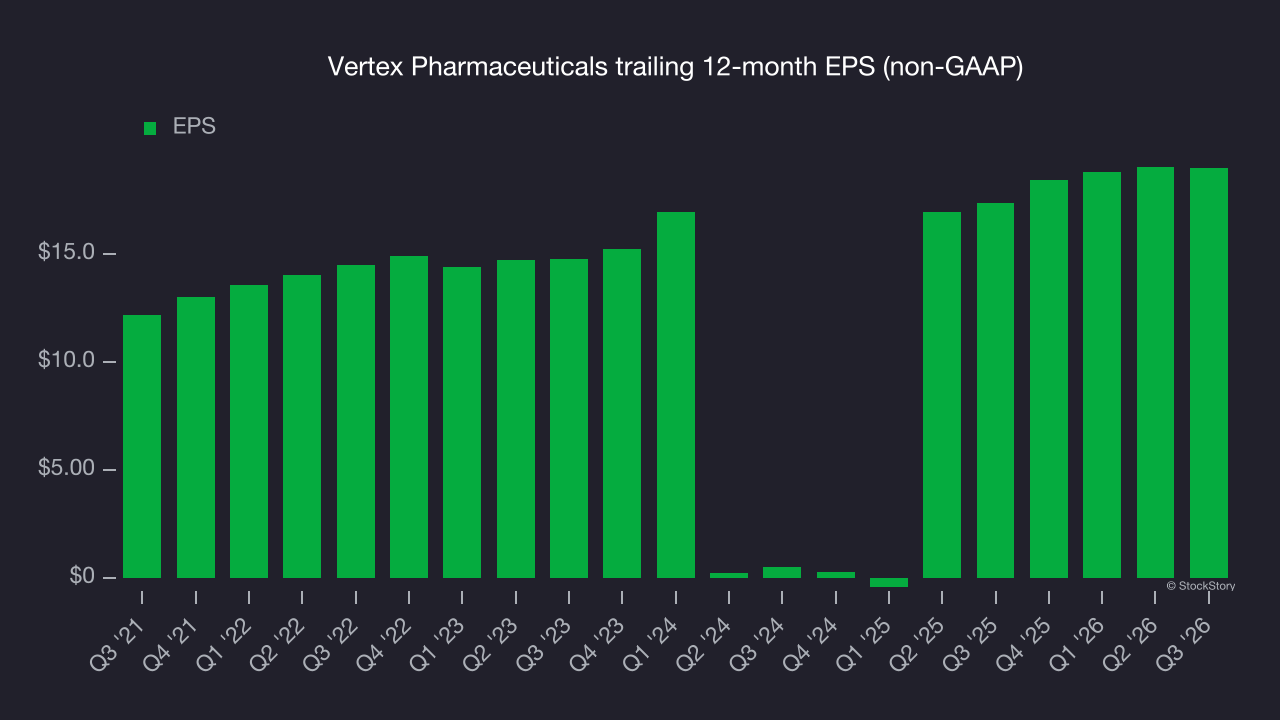
A closer look at Vertex Pharmaceuticals’s earnings helps explain the drivers of its performance. As noted earlier, Vertex Pharmaceuticals’s adjusted operating margin declined by 12.2 percentage points over the last five years. This was the most relevant factor (aside from the revenue impact) behind its lower earnings; interest expenses and taxes can also affect EPS but don’t tell us as much about a company’s fundamentals.
In Q3, Vertex Pharmaceuticals reported adjusted EPS of $4.76, down from $4.80 in the same quarter last year. This result was close to analysts’ consensus estimates. Over the next 12 months, Wall Street expects Vertex Pharmaceuticals’s full-year EPS to grow 4.5% from $18.99 to $19.84, according to S&P.
Key takeaways from Vertex Pharmaceuticals’s Q3 results
A narrow revenue beat gave Vertex Pharmaceuticals a positive this quarter, but EPS fell a bit short of Wall Street’s consensus estimates and full-year revenue guidance also slightly missed expectations. Taken together, the quarter could have been better. Shares remained flat at $550.50 immediately after the results.
When deciding whether to buy the stock, consider its valuation, business quality and latest quarterly results. Read the full research report here (it’s free).