Professional tools and equipment manufacturer Snap-on (NYSE: SNA) fell short of the market’s revenue expectations in Q3 2026, with sales flat year on year at $1.28 billion. Its GAAP profit of $4.64 per share was 5.8% below analysts’ consensus estimates.
Is now the time to buy Snap-on? Find out by accessing our full research report, it’s free.
Snap-on (SNA) Q3 2026 highlights:
- Revenue: $1.28 billion vs analyst estimates of $1.33 billion (flat year on year, 3.8% miss)
- EPS (GAAP): $4.64 vs analyst expectations of $4.93 (5.8% miss)
- Operating Margin: 24.7%, down from 26.9% in the same quarter last year
- Free Cash Flow Margin: 17.4%, down from 19.9% in the same quarter last year
- Organic Revenue rose 2.8% year on year
- Market Capitalization: $19.08 billion
“Our third quarter was mixed with varied outcomes among our business groups. The results were principally marked by the unprecedentedly accelerated rise in diesel prices, which in our mobile van channel prompted franchisees to reduce inventories despite very stable demand from their technician customers, substantially impacting the Tools Group in the period and overcoming what was an encouraging, record-setting performance in the Commercial & Industrial Group, led by gains in the critical industries and the precision torque arena,” said Nick Pinchuk, Snap-on chairman and chief executive officer. “But even with the challenges raised by the extreme turbulence, Snap-on Value Creation continued to support a resilience that kept gross margins strong. The headwinds notwithstanding, we remained confident on the path forward, investing in innovations identified through customer connection and developed by our engineering teams to solve essential tasks…many of which recently received awards from Motor Magazine and Professional Tool & Equipment News…reinforcing the power of the Snap-on brand…even as we engaged the difficulties. As we look ahead, we believe the Tools Group is well-positioned with its robust array of quick-payback products to drive progress as the wave passes; our proprietary databases are increasingly effective at streamlining work in independent vehicle repair shops, and we possess considerable momentum across the critical industries based on the growing popularity of our customized solutions. And, we believe these strengths will combine to reestablish and extend our positive trajectory. Finally, I want to thank our franchisees and associates for their many contributions, for their unwavering commitment to meet the macro environment, and for their steadfast faith in our ability to take full advantage of the abundant opportunities in our future.”
Company overview
Founded in 1920, Snap-on (NYSE: SNA) is a global provider of tools, equipment, and diagnostics for various industries such as vehicle repair, aerospace, and the military.
Revenue growth
A company’s long-term sales performance is one signal of its overall quality. Any business can put up a good quarter or two, but the best consistently grow over the long haul. Unfortunately, Snap-on’s 2.9% annualized revenue growth over the last five years was sluggish. This fell short of our benchmarks and is a poor baseline for our analysis.
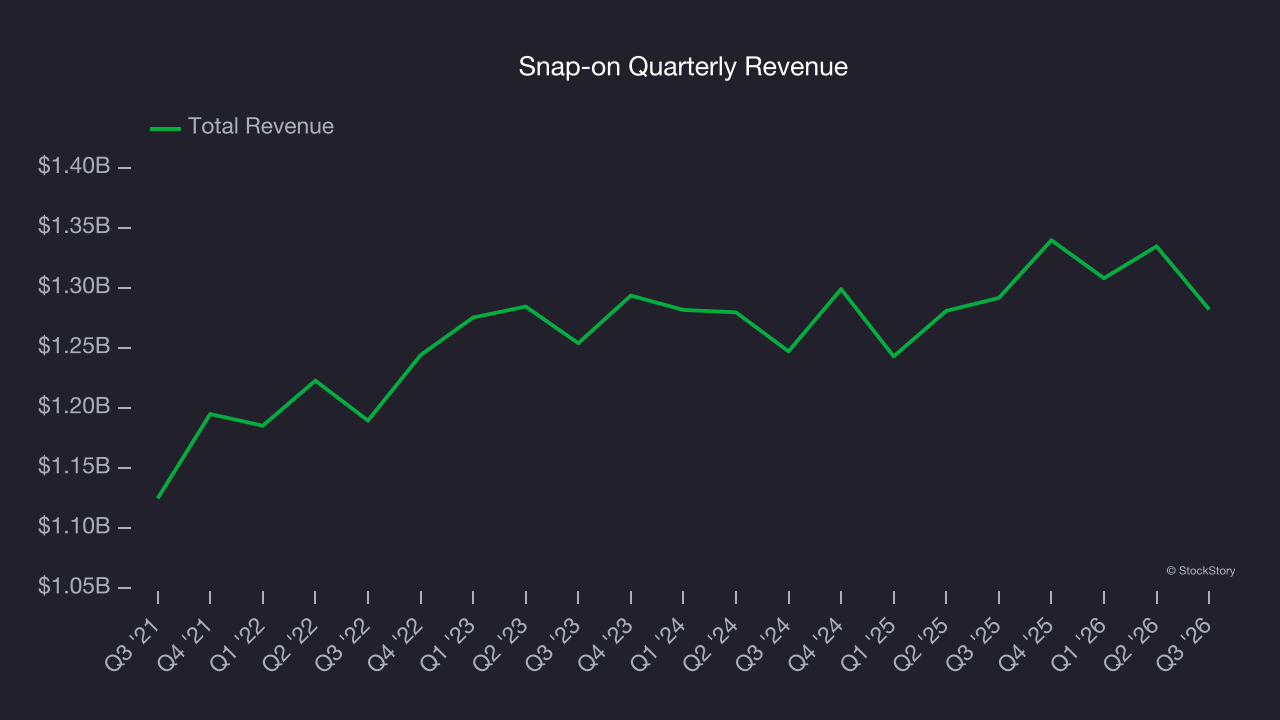
We at StockStory place the most emphasis on long-term growth, but within industrials, a half-decade historical view may miss cycles, industry trends, or a company capitalizing on catalysts such as a new contract win or a successful product line. Snap-on’s recent performance shows its demand has slowed as its annualized revenue growth of 1.6% over the last two years was below its five-year trend. We’re wary when companies in the sector see decelerations in revenue growth, as it could signal changing consumer tastes aided by low switching costs. 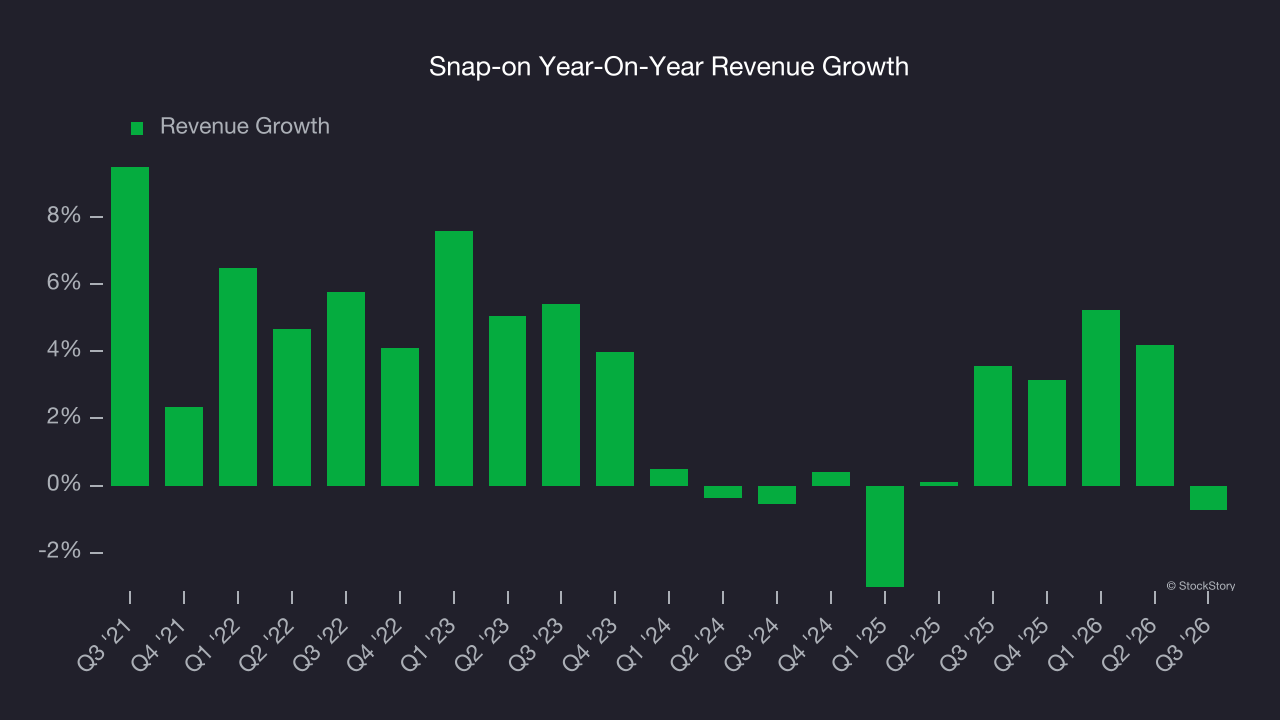
We can better understand the company’s sales dynamics by analyzing its organic revenue, which strips out one-time events like acquisitions and currency fluctuations that don’t accurately reflect its fundamentals. Over the last two years, Snap-on’s organic revenue was flat. Because this number aligns with its two-year revenue growth, we can see the company’s core operations (not acquisitions and divestitures) drove most of its results. 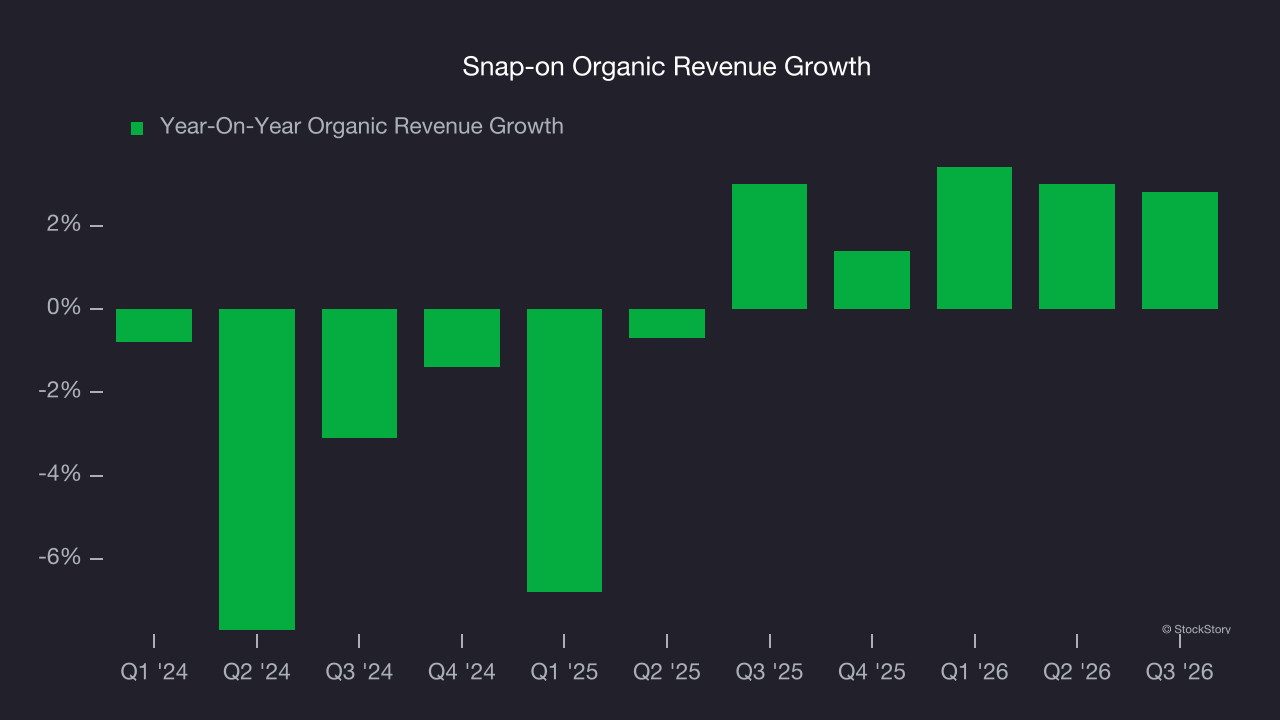
This quarter, Snap-on’s $1.28 billion of revenue was flat year on year, falling short of Wall Street’s estimates.
Looking ahead, sell-side analysts expect revenue to grow 5% over the next 12 months. While this projection implies its newer products and services will catalyze better top-line performance, it is still below the sector average.
WHILE YOU’RE HERE: The Next Palantir? One satellite company captures images of every point on Earth. Every single day. The Pentagon wants it. Hedge funds are using it to beat earnings. You’ve probably never heard of it.
This is what the early days of Palantir looked like before it became a giant. Same playbook. Different technology. If you missed Palantir, you need to see this. Claim The Stock Ticker for Free HERE.
Operating margin
Snap-on’s operating margin has more or less stayed the same over the last 12 months , averaging 25.5% over the last five years. This profitability was elite for an industrials business thanks to its efficient cost structure and economies of scale. This result isn’t surprising as its high gross margin gives it a favorable starting point.
Analyzing the trend in its profitability, Snap-on’s operating margin might have fluctuated slightly but has generally stayed the same over the last five years. This raises questions about the company’s expense base because its revenue growth should have given it leverage on its fixed costs, resulting in better economies of scale and profitability.
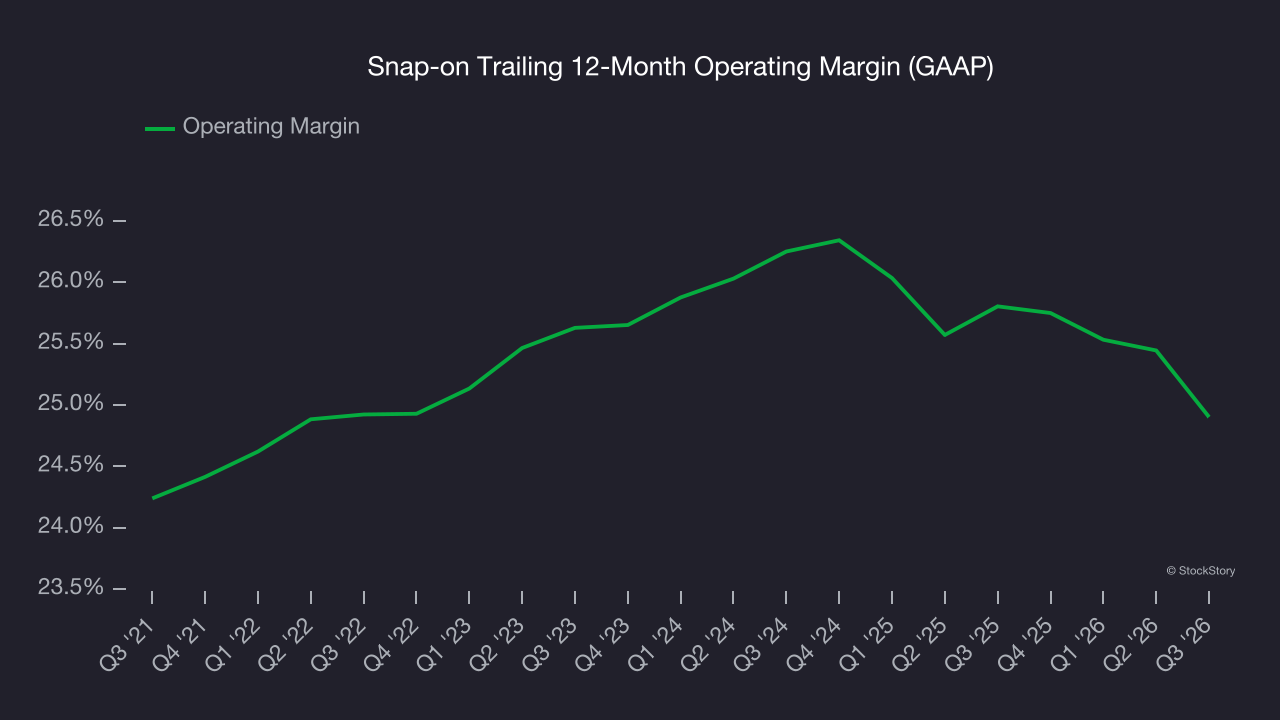
In Q3, Snap-on generated an operating margin profit margin of 24.7%, down 2.2 percentage points year on year. Conversely, its gross margin actually rose, so we can assume its recent inefficiencies were driven by increased operating expenses like marketing, R&D, and administrative overhead.
Earnings per share
We track the long-term change in earnings per share (EPS) for the same reason as long-term revenue growth. Compared to revenue, however, EPS highlights whether a company’s growth is profitable.
Snap-on’s EPS grew at 5.6% compounded annual growth rate over the last five years. This performance was better than its revenue growth but doesn’t tell us much about its business quality because its operating margin improvement was less than peers.
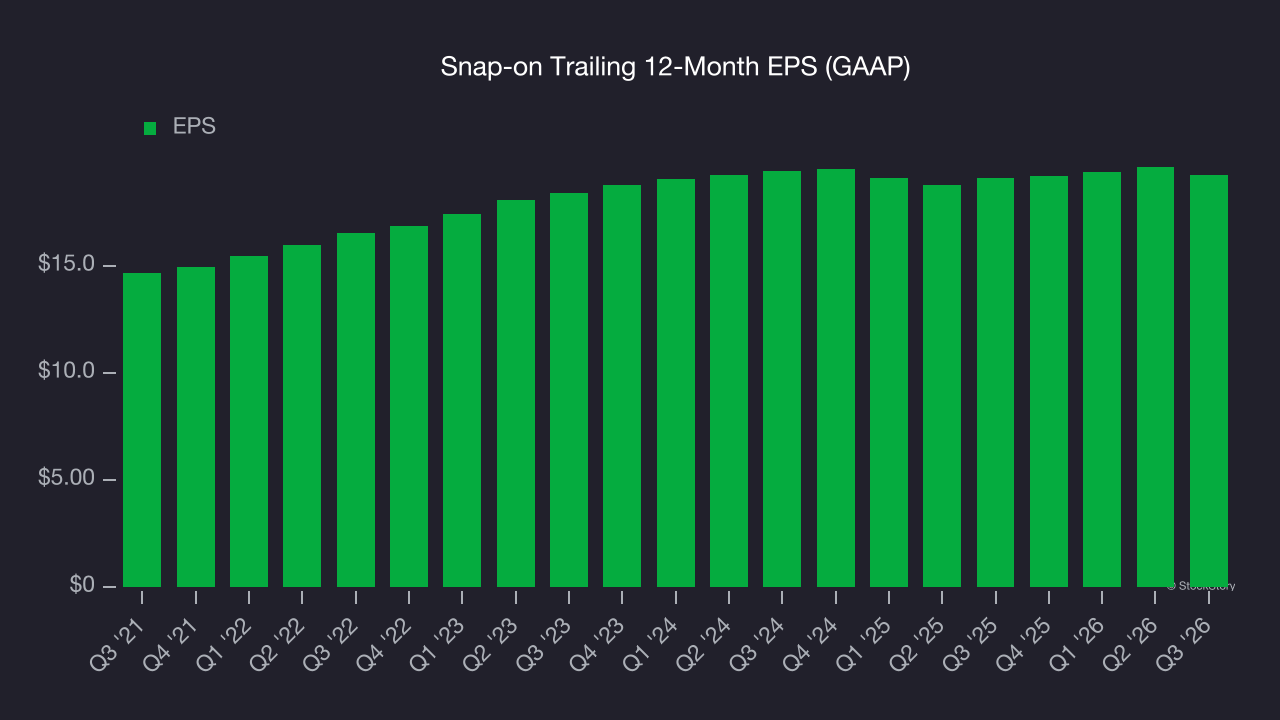
We can take a deeper look into Snap-on’s earnings to better understand the drivers of its performance. A five-year view shows that Snap-on has repurchased its stock, shrinking its share count by 4.5%. This tells us its EPS outperformed its revenue not because of increased operational efficiency but financial engineering, as buybacks boost per share earnings. 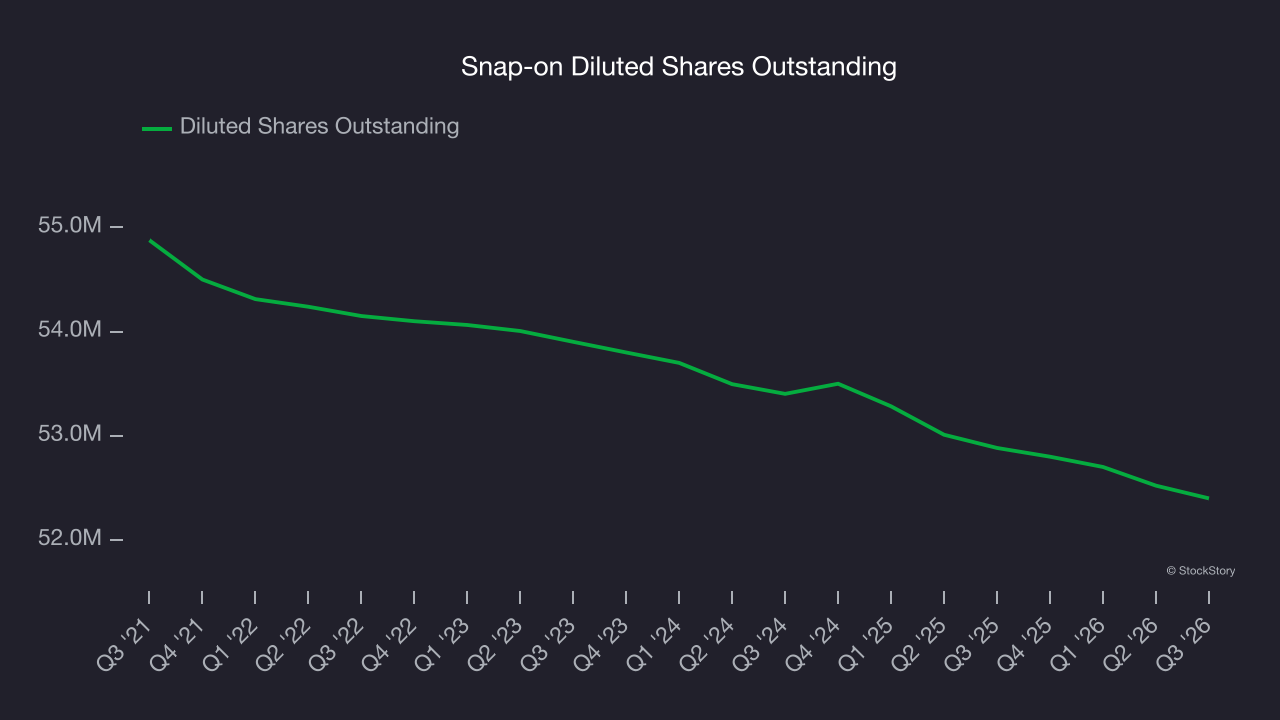
Like with revenue, we analyze EPS over a shorter period to see if we are missing a change in the business.
For Snap-on, EPS didn’t budge over the last two years, a regression from its five-year trend. We hope it can revert to earnings growth in the coming years.
In Q3, Snap-on reported EPS of $4.64, down from $5.02 in the same quarter last year. This print missed analysts’ estimates. Over the next 12 months, Wall Street expects Snap-on’s full-year EPS to grow 8.8% from $19.23 to $20.91.
Key takeaways from Snap-on’s Q3 results
We struggled to find many positives in these results. Its revenue missed and its EPS fell short of Wall Street’s estimates. Overall, this was a weaker quarter. The stock traded down 6.8% to $344.01 immediately following the results.
The latest quarter from Snap-on’s wasn’t that good. One earnings report doesn’t define a company’s quality, though, so let’s explore whether the stock is a buy at the current price. The latest quarter does matter, but not nearly as much as longer-term fundamentals and valuation, when deciding if the stock is a buy. We cover that in our actionable full research report which you can read here (it’s free).