Oilfield services company RPC (NYSE: RES) met Wall Street’s revenue expectations in Q3 2026, with revenue up 4.6% year on year to $467.7 million. Its non-GAAP profit of $0.10 per share was in line with analysts’ consensus estimates.
For more on RPC, read our free full research report.
RPC (RES) Q3 2026 highlights:
- Revenue $467.7 million vs S&P analysts’ consensus estimates of $466.6 million (4.6% year-on-year growth, in line)
- Adjusted EPS $0.10 vs S&P analysts’ consensus estimates of $0.10 (in line)
- Adjusted EBITDA $71.53 million vs analysts’ consensus estimates of $71.75 million (15.3% margin, in line)
- Operating margin -11.5%, down from 4.7% in the same quarter last year
- Free cash flow margin 1.1%, similar to the same quarter last year
- Market capitalization $1.47 billion
"During the quarter, Revenues improved, reflecting continued strength across several of our service lines. Within our Technical Services segment Cudd Pressure Controls' Coiled Tubing, Nitrogen, and Snubbing revenues each grew double digits, partially offset by lower Pintail Wireline revenues. Our Support Services segment revenues grew 3% sequentially led by Patterson Rental Tools, which increased 7%. Our results benefited from improved profitability across much of our portfolio, demonstrating the value of RPC's diversified service offerings."
Revenue growth
Cyclical sectors like energy often flatter weaker operators during favorable price environments, but a longer-term lens separates those from businesses that can consistently perform across market cycles. RPC’s 19.4% annualized revenue growth over the last five years was strong. Its growth beat the average energy upstream and integrated energy company and shows its offerings resonate with customers.
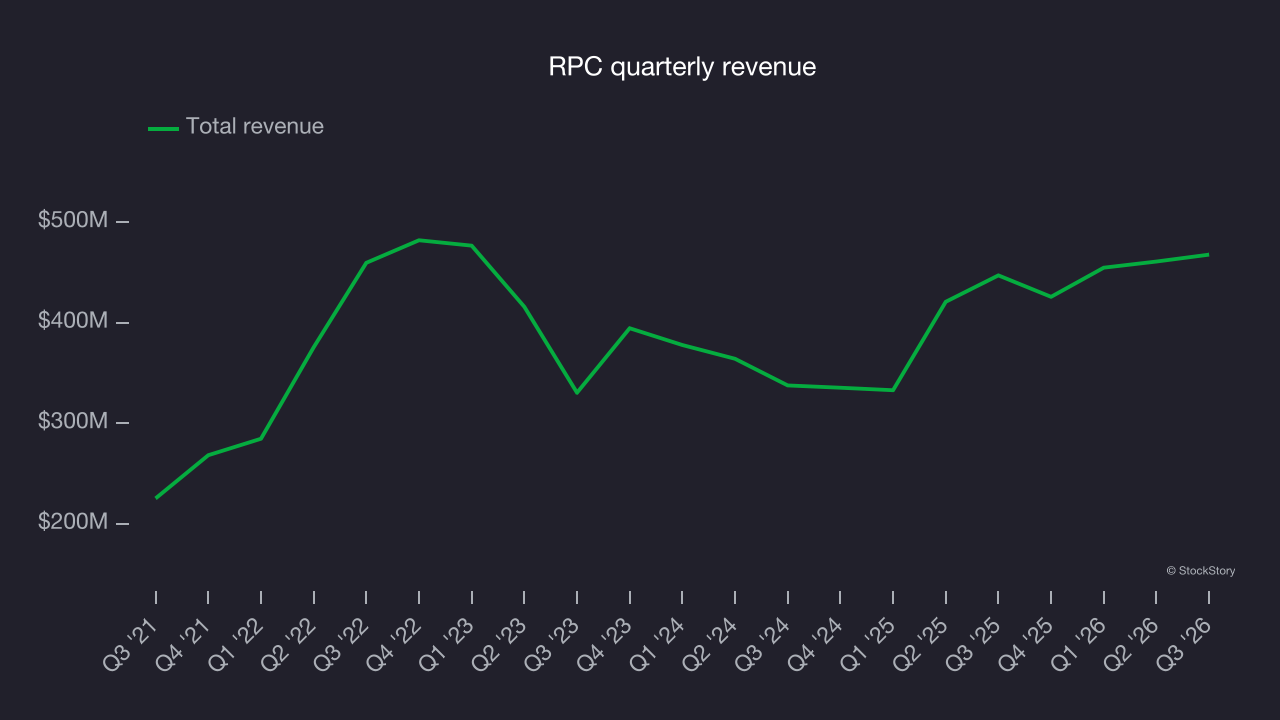
Within energy, a single time frame, even a long one, only sheds light on how well a company rode the last commodity cycle. To better assess whether a company compounds through cycles, it helps to take an even longer, ten-year view. RPC’s annualized revenue growth of 8.8% over the last ten years is below its five-year trend, but the results still suggest decent demand.
This quarter, RPC grew its revenue by 4.6% year on year, and its $467.7 million of revenue was in line with Wall Street’s consensus estimates.
Adjusted EBITDA margin
Adjusted EBITDA margin measures the operating profitability of an energy producer by excluding the accounting effects of depletion and capitalized drilling costs. It reveals how much cash the asset base generates before capital structure and reinvestment requirements shape reported earnings.
RPC was profitable over the last five years but held back by its large cost base. Its average EBITDA margin of 18.3% was weak for an upstream and integrated energy business.
RPC’s EBITDA margin decreased by 6.3 percentage points over the last year. This raises questions about the company’s expense base because its revenue growth should have given it leverage on its fixed costs, resulting in better economies of scale and profitability. RPC’s poor performance indicates that costs were rising and it couldn’t pass them on to its customers.
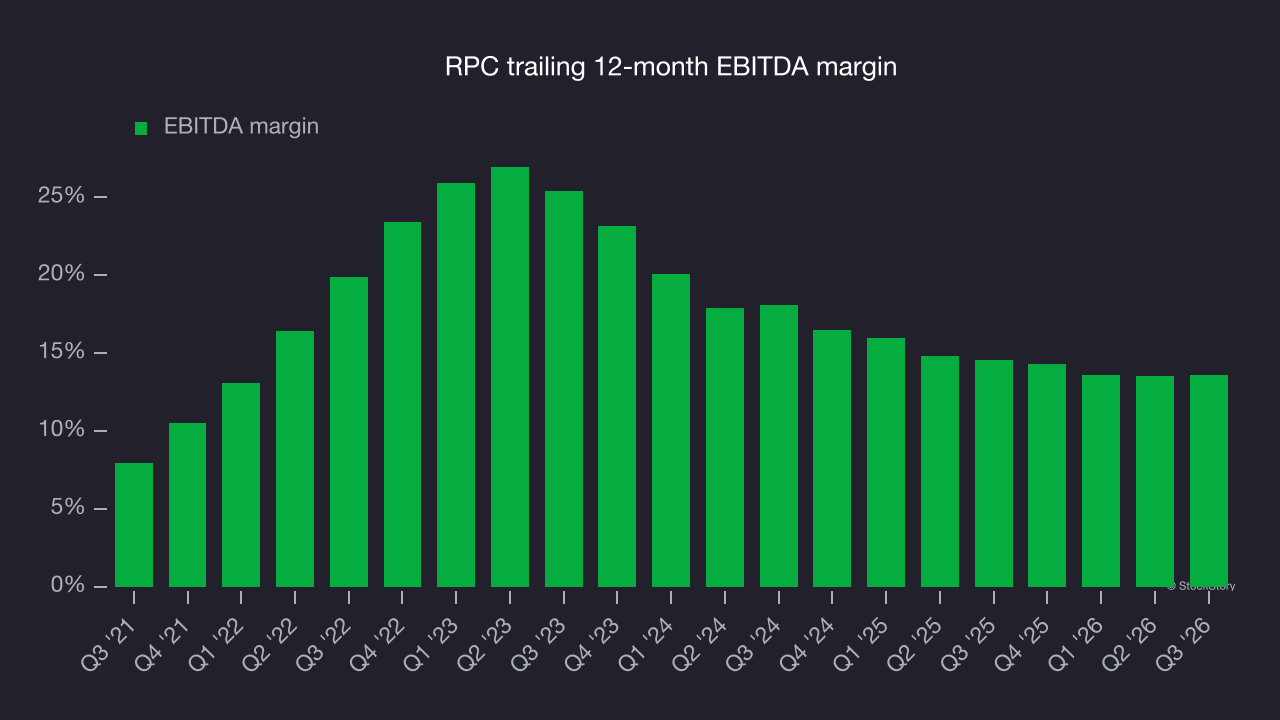
This quarter, RPC generated an EBITDA margin of 15.3%, in line with the same quarter last year. This indicates the company’s overall cost structure has been relatively stable. Adjusted EBITDA was in line with Wall Street’s consensus estimates.
Free cash flow
As mentioned above, adjusted EBITDA ignores capital structure and drilling expenditure decisions. These are two important aspects of an energy producer, so investors need to account for both to get a comprehensive picture of business quality. In other words, adjusted EBITDA margins could be solid but free cash flow could be poor because asset decline rates are high and drilling is expensive. Free cash flow tells you not only about the economics of past production but also how much it costs to stay in business through further drilling or extraction.
RPC has shown mediocre cash profitability relative to peers over the last five years, giving the company fewer opportunities to return capital to shareholders. Its free cash flow margin averaged 5.9%, below what we’d expect for an upstream and integrated energy business.
While the level of free cash flow margins is important, their consistency matters just as much.
RPC’s ratio of quarterly free cash flow volatility to WTI crude price volatility over the past five years was 10.6 (lower is better), indicating reasonable insulation from commodity swings.
Why assess stability against commodity prices at the free cash flow line? Why not compare revenue or EBITDA with WTI in RPC’s case? Because what ultimately matters is not how much revenue or profit a company earns when prices are high but how much cash it can generate when prices are low. Free cash flow is the superior metric because it includes everything from hedging effectiveness to growth and maintenance capex to management behavior during good times and bad.
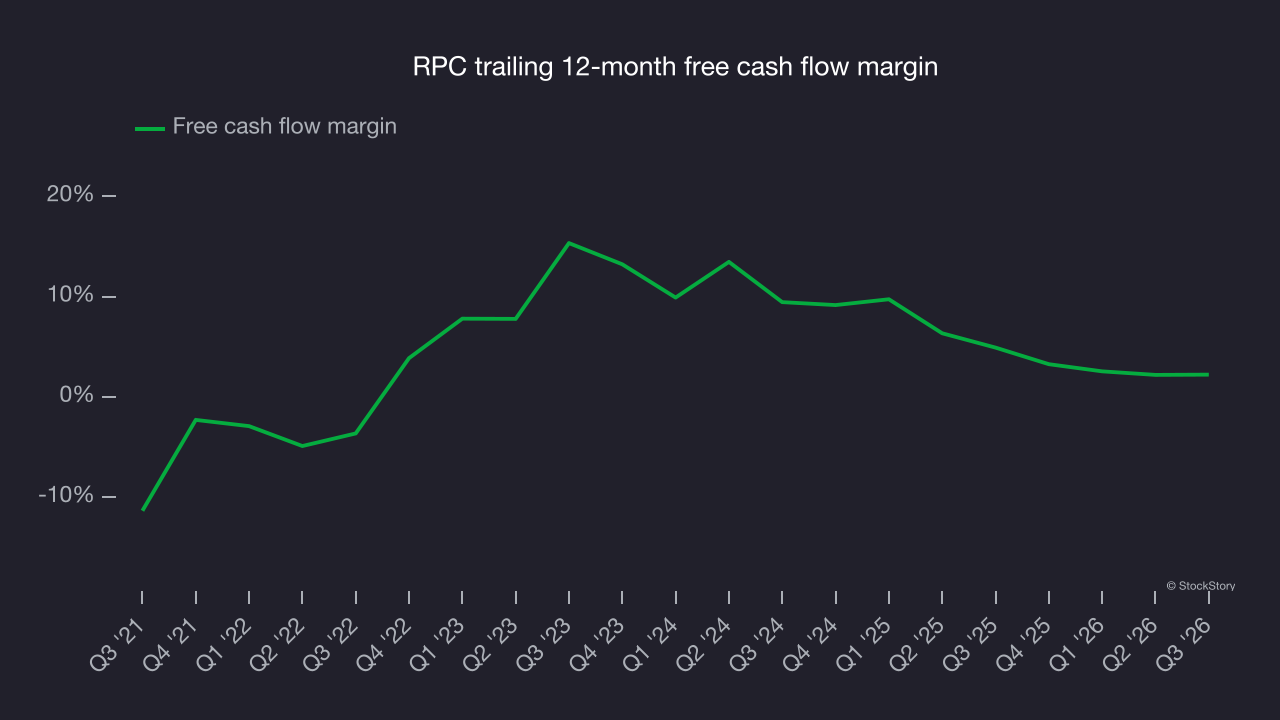
RPC generated free cash flow of $5.00 million in Q3, equivalent to a 1.1% margin. This cash profitability was in line with the comparable period last year but below its five-year average. In isolation, this isn’t a major concern because investment needs can be seasonal, but whether the trend continues into future quarters bears watching.
Key takeaways from RPC’s Q3 results
RPC delivered a decent quarter, with EPS in line with analysts’ consensus estimates. But the market seemed to be hoping for more, as shares plunged 13.2% to $5.85 immediately after the results.
RPC’s latest quarter is only one part of the longer-term business quality picture. Quality, when combined with valuation, can help determine if the stock is a buy. Read the full research report here (it’s free).