Cruise and exploration company Lindblad Expeditions (NASDAQ: LIND) reported Q3 2026 results beating Wall Street’s revenue expectations, with revenue up 12.1% year on year to $269.2 million. The company expects the full year’s revenue to be around $877.5 million, close to analysts’ consensus estimates. Its GAAP profit of $0.36 per share was 6.1% below analysts’ consensus estimates.
For more on Lindblad Expeditions, read our free full research report.
Lindblad Expeditions (LIND) Q3 2026 highlights:
- Revenue $269.2 million vs S&P analysts’ consensus estimates of $264.9 million (12.1% year-on-year growth, 1.6% beat)
- EPS (GAAP) $0.36 vs analysts’ consensus estimates of $0.38 (6.1% miss)
- Adjusted EBITDA $64.12 million vs analysts’ consensus estimates of $58.65 million (23.8% margin, 9.3% beat)
- Revenue guidance The company lifted its revenue guidance for the full year to $877.5 million at the midpoint from $845 million, a 3.8% increase
- EBITDA guidance $145 million at the midpoint for the full year, in line with analysts’ consensus estimates
- Operating margin 15.9%, in line with the same quarter last year
- Free cash flow -$1.13 million, down from $11.91 million in the same quarter last year
- Market capitalization $2.41 billion
Natalya Leahy, chief executive officer, said "It has been an exciting quarter for us! With the acquisition of White Desert and the launch of Echo Charlie, we are opening a new chapter of growth, innovation and long-term shareholder value creation. We also delivered outstanding financial results with record Adjusted EBITDA and occupancy above 90% for the third consecutive quarter. These achievements reflect the strength of our business model and disciplined execution. Our confidence in the future and appreciation for our people who make it possible have never been stronger."
Revenue growth
Examining a company’s long-term performance can provide clues about its quality. Even a bad business can perform well for one or two quarters, but a top-tier one grows for years. Over the last five years, Lindblad Expeditions grew its revenue at a strong 60% compounded annual growth rate. Its growth beat the average consumer discretionary company and shows its offerings resonate with customers.
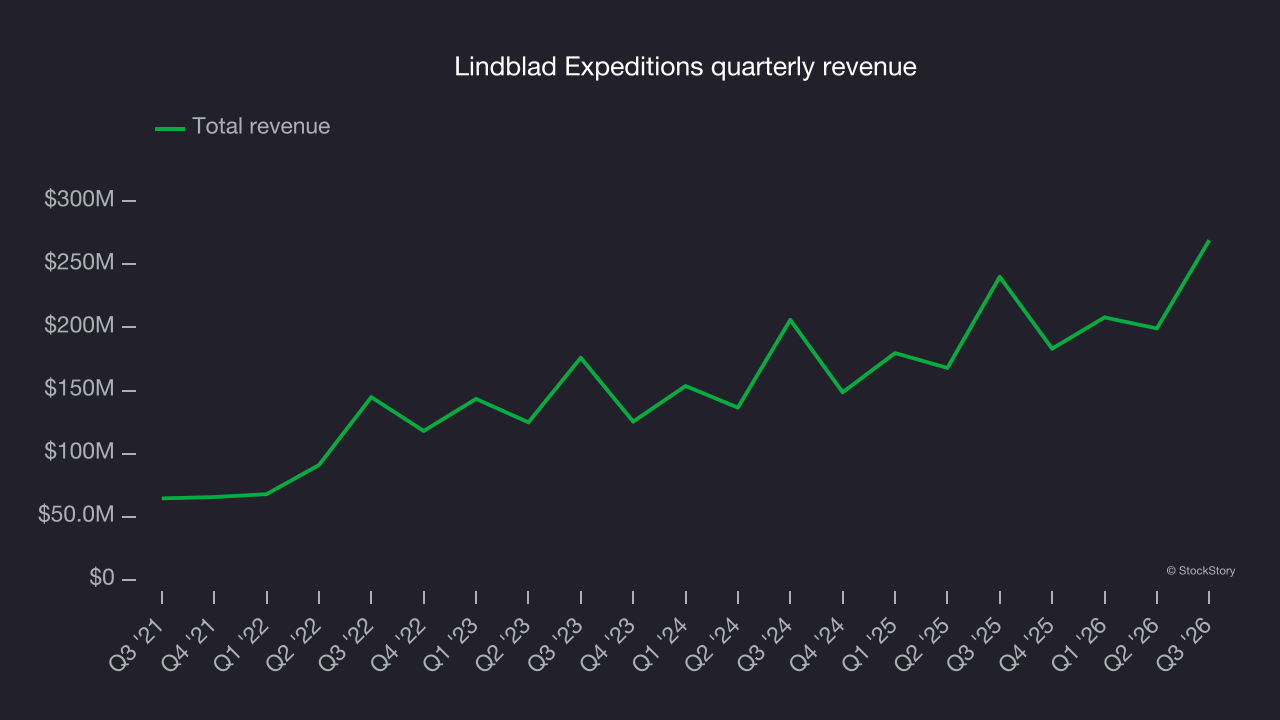
Long-term growth matters most, but within consumer discretionary, a longer historical view may miss a company riding a successful new property or trend. Lindblad Expeditions’s recent performance shows its demand has slowed significantly as its annualized revenue growth of 17.6% over the last two years was well below its five-year trend. 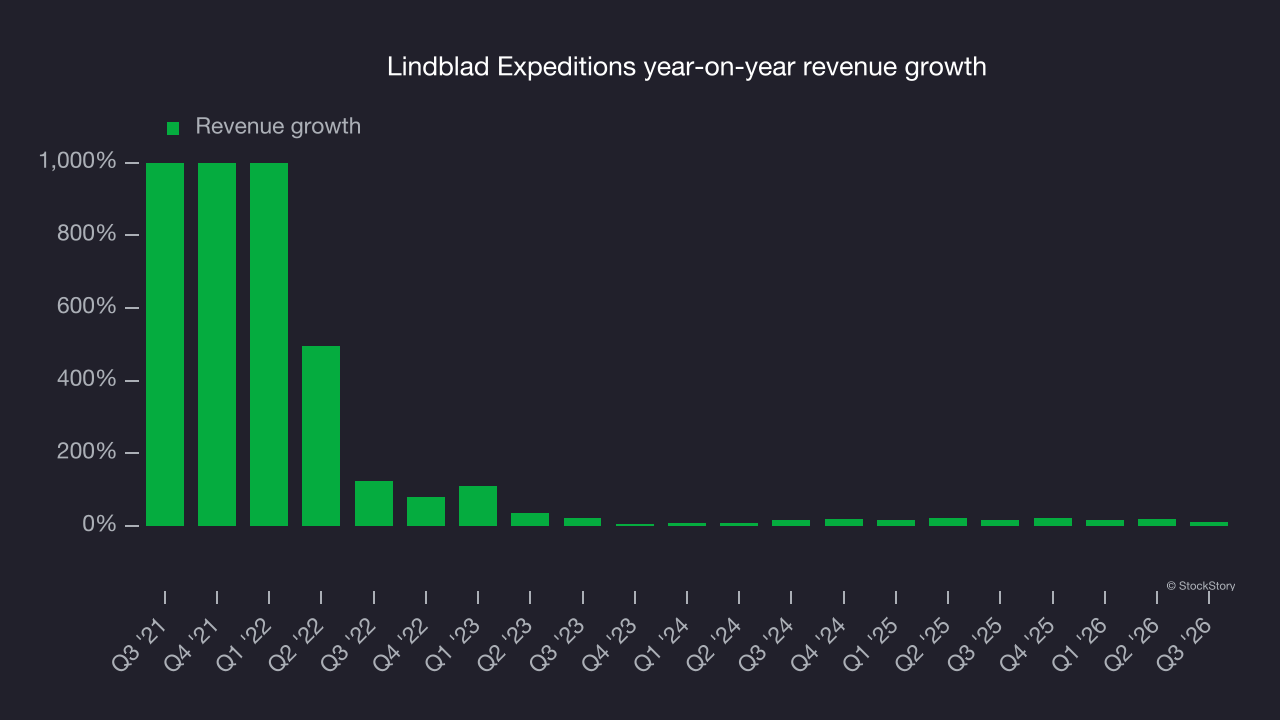
This quarter, Lindblad Expeditions reported year-on-year revenue growth of 12.1%, and its $269.2 million of revenue exceeded Wall Street’s consensus estimates by 1.6%.
Looking ahead, sell-side analysts expect revenue to grow 9.7% over the next 12 months, according to S&P, a deceleration versus the last two years. This projection is underwhelming and indicates its products and services will face some demand challenges.
Operating margin
Lindblad Expeditions’s operating margin has been trending up over the last 12 months and averaged 7.4% over the last two years. The company’s higher efficiency is a positive, but its suboptimal cost structure means profitability remains inadequate for a consumer discretionary business.
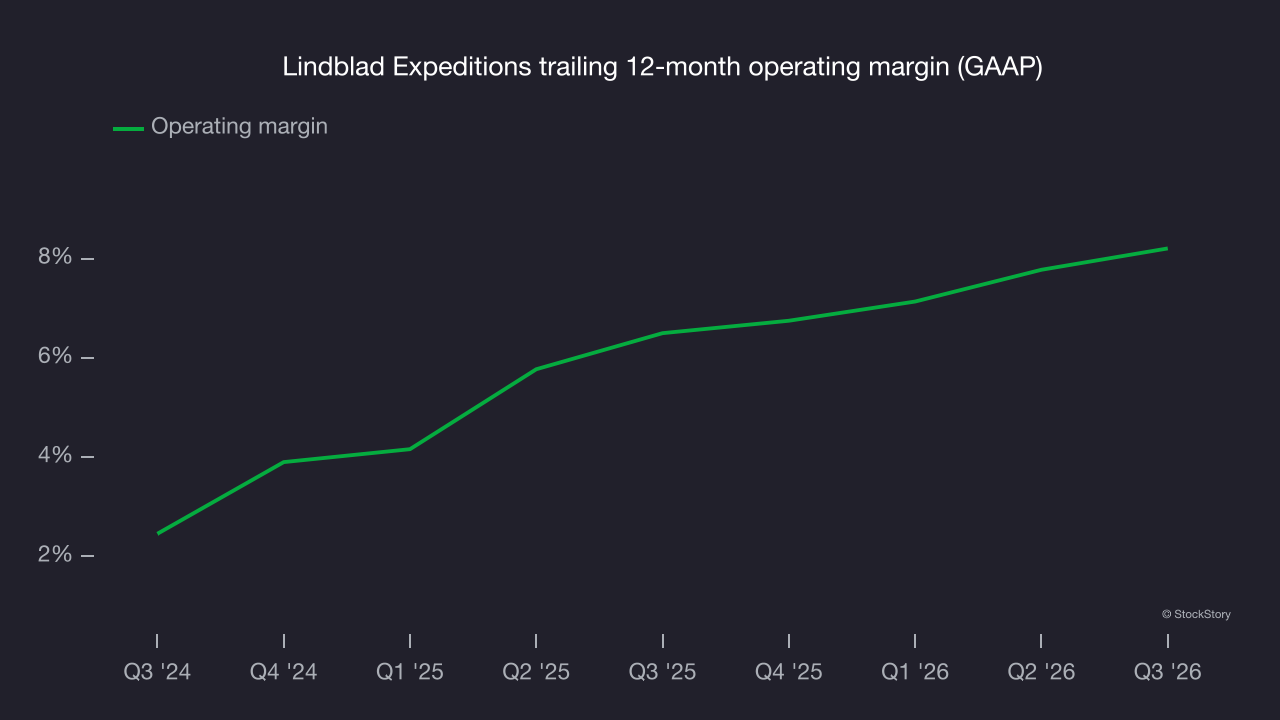
This quarter, Lindblad Expeditions generated an operating margin of 15.9%, in line with the same quarter last year. This indicates the company’s overall cost structure has been relatively stable.
Earnings per share
We track the long-term change in earnings per share (EPS) for the same reason as long-term revenue growth. Compared to revenue, however, EPS highlights whether a company’s growth is profitable.
Although Lindblad Expeditions’s full-year earnings are still negative, it reduced its losses and improved its EPS by 61.8% annually over the last five years. The next few quarters will be critical for assessing its long-term profitability.
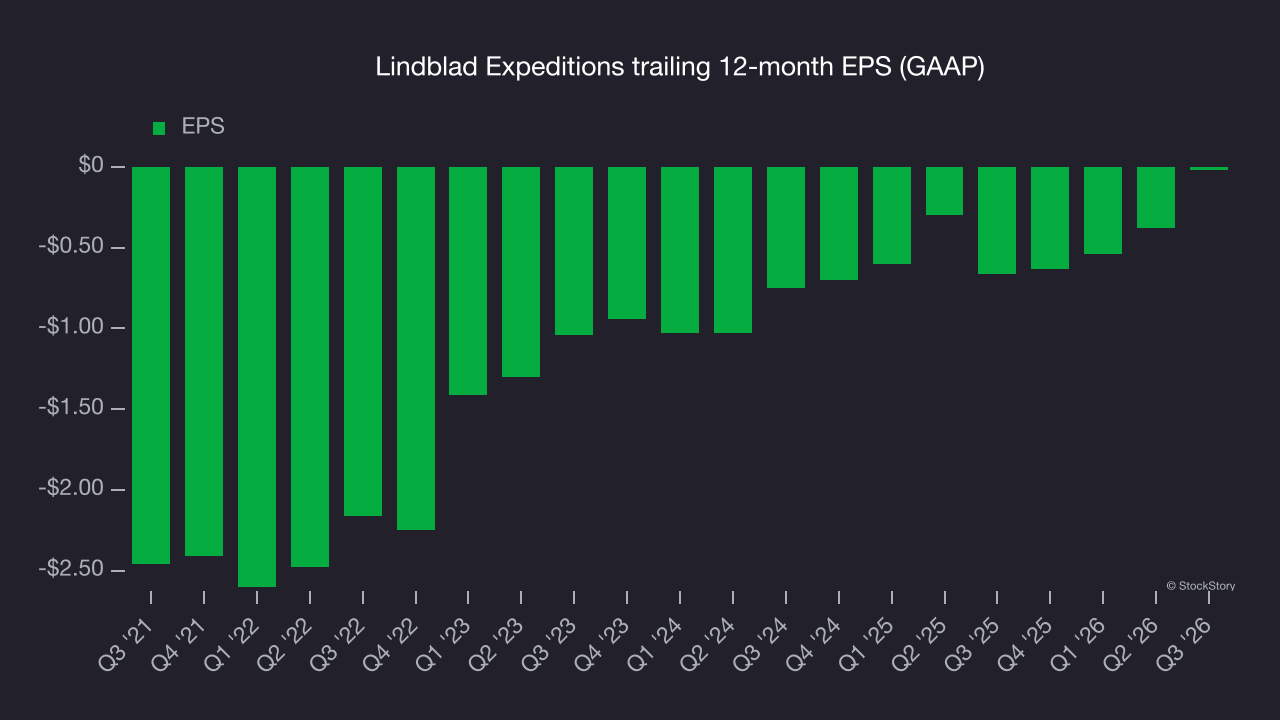
In Q3, Lindblad Expeditions reported EPS of $0.36, up from $0 in the same quarter last year. Despite growing year on year, this result missed analysts’ consensus estimates. Over the next 12 months, Wall Street expects a return to profitability. Analysts forecast Lindblad Expeditions’s full-year EPS will turn positive, rising from negative $0.02 to positive $0.43, according to S&P.
Key takeaways from Lindblad Expeditions’s Q3 results
Lindblad Expeditions delivered a mixed quarter: Revenue and EBITDA topped analysts’ consensus estimates, but EPS fell short. Shares remained flat at $36.61 immediately after the results.
When deciding whether to invest in this stock, the latest quarter matters, but not as much as longer-term business quality and valuation. For more on those factors, read our full research report here (it’s free).