Entertainment venue operator Lucky Strike (NYSE: LUCK) reported calendar Q3 2026 (fiscal Q1 2027) results topping the market’s revenue expectations, with revenue up 3.5% year on year to $302.6 million. The company’s full-year revenue guidance of $1.3 billion at the midpoint came in 0.7% above analysts’ consensus estimates. Its GAAP loss of $0.21 per share was significantly below analysts’ consensus estimates.
For more on Lucky Strike, read our free full research report.
Lucky Strike (LUCK) Q3 CY2026 highlights:
- Revenue $302.6 million vs S&P analysts’ consensus estimates of $299.2 million (3.5% year-on-year growth, 1.2% beat)
- EPS (GAAP) -$0.21 vs analysts’ consensus estimates of -$0.09 (significant miss)
- Adjusted EBITDA $72.1 million vs analysts’ consensus estimates of $72.69 million (23.8% margin, 0.8% miss)
- Revenue guidance The company reconfirmed its revenue guidance for the full year of $1.3 billion at the midpoint
- EBITDA guidance $350 million at the midpoint for the full year, above analysts’ consensus estimates of $347.1 million
- Operating margin 9.3%, in line with the same quarter last year
- Free cash flow -$4.42 million compared to -$32.31 million in the same quarter last year
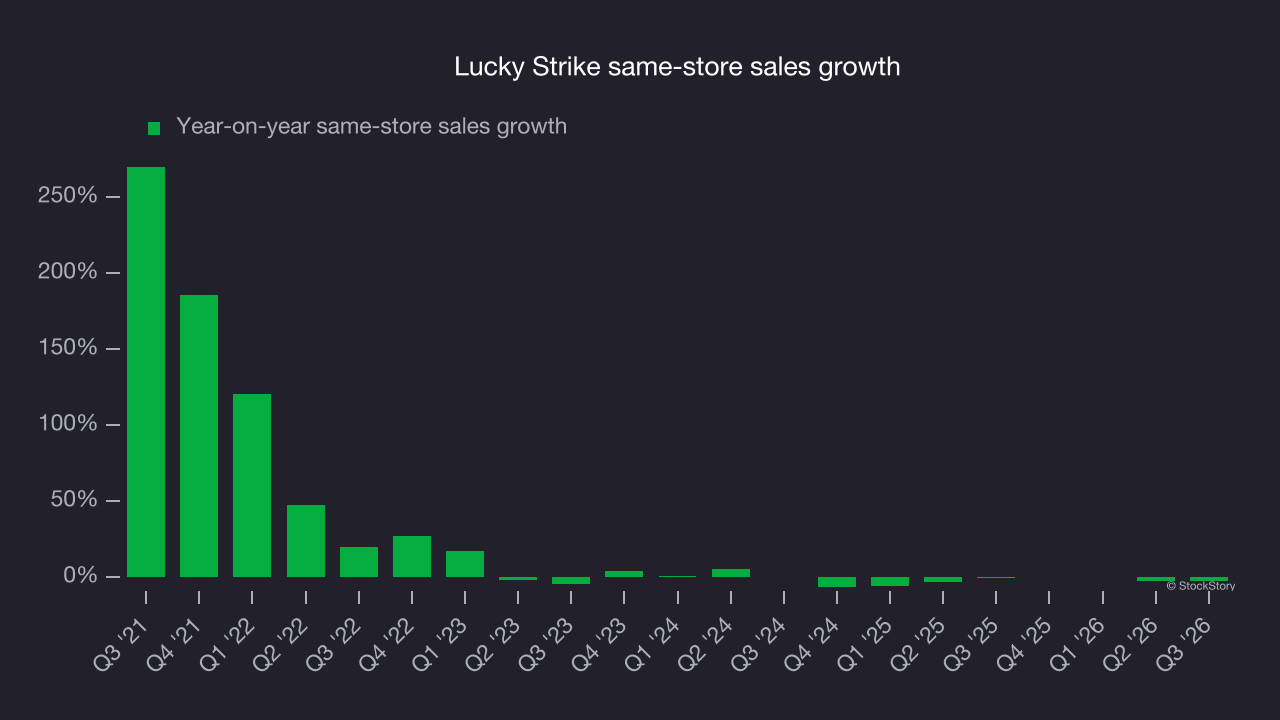
- Same-store sales fell 2.6% year on year (-0.4% in the same quarter last year)
- Market capitalization $602.6 million
“Revenue grew in the first quarter, helped by our first full summer with two new water parks, and while same-store revenue was down, it improved every month and September comped positive,” said Thomas Shannon, Founder and CEO. “We are in a better place than a year ago, but a negative comp is a negative comp, and fixing it comes first.”
Revenue growth
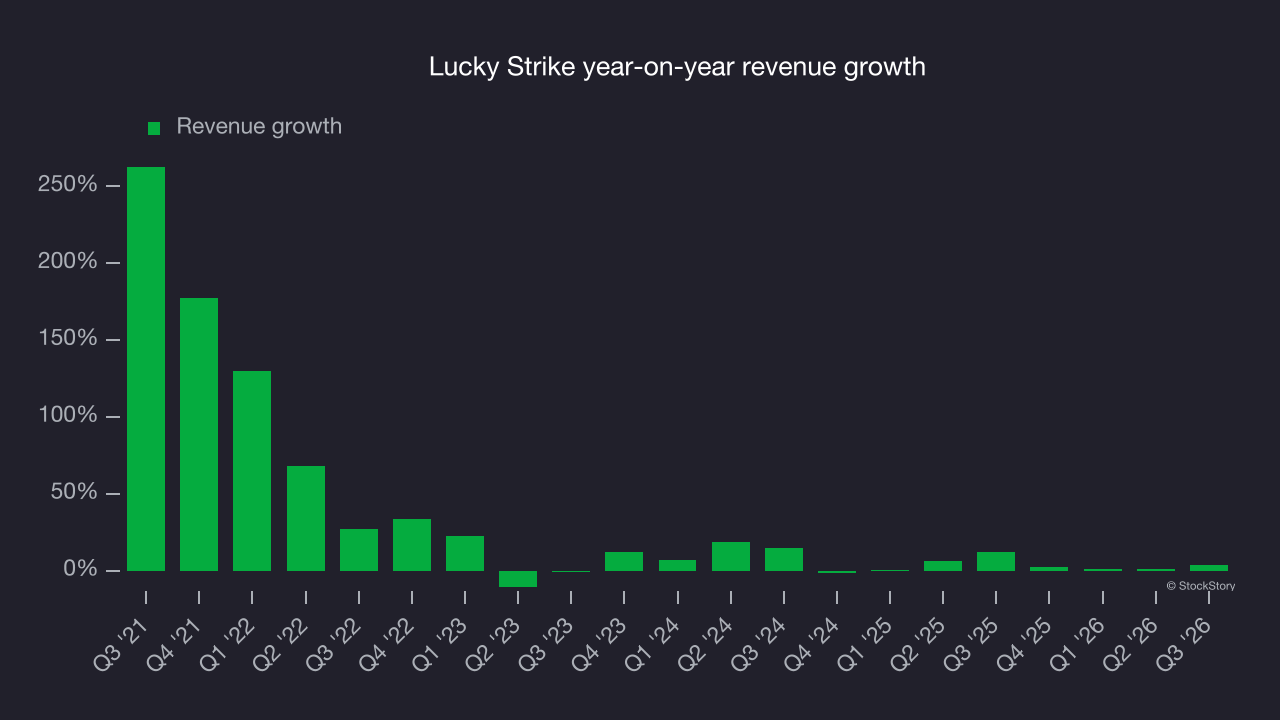
Examining a company’s long-term performance can provide clues about its quality. Any business can have short-term success, but a top-tier one grows for years. Over the last five years, Lucky Strike grew its revenue at a 19% annual rate. Though this growth is acceptable on an absolute basis, revenue growth alone is not enough for the consumer discretionary sector, which can display significant earnings volatility. The bar for the sector is particularly high, reflecting the non-essential and hit-driven nature of the products and services offered. Additionally, the five-year compound annual growth rate starts around Covid, when revenue was depressed before rebounding.
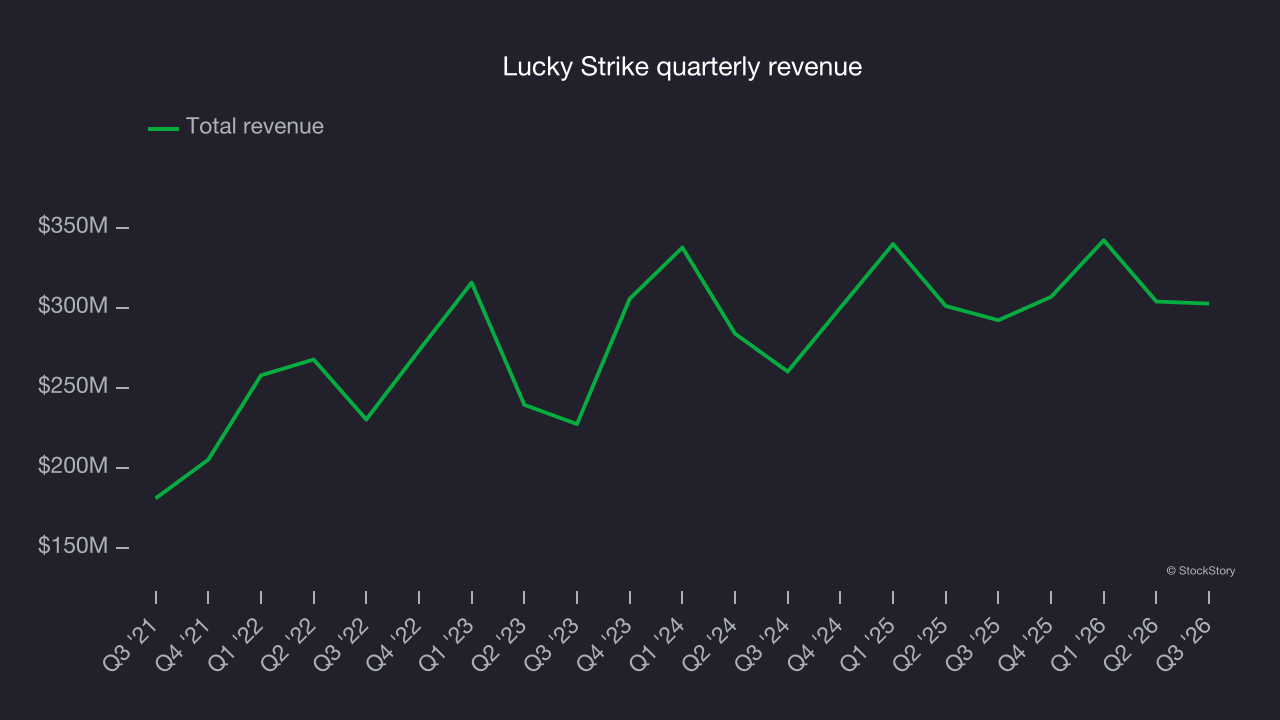
Long-term growth is the most important, but within consumer discretionary, product cycles are short and revenue can be hit-driven due to rapidly changing trends and consumer preferences. Lucky Strike’s recent performance shows its demand has slowed as its annualized revenue growth of 2.8% over the last two years was below its five-year trend. Decelerating revenue growth in the sector warrants caution, as it could signal changing consumer tastes given low switching costs. Note that Covid hurt Lucky Strike’s business in 2020 and part of 2021, and it rebounded sharply thereafter.
The company’s same-store sales offer more detail on its revenue dynamics, showing how much revenue its established locations generate. Over the last two years, Lucky Strike’s same-store sales averaged 2.5% year-on-year declines. Revenue growth outpaced same-store sales growth, indicating that new locations are boosting the company’s revenue performance.
This quarter, Lucky Strike reported modest year-on-year revenue growth of 3.5% but beat Wall Street’s consensus estimates by 1.2%.
Looking ahead, sell-side analysts expect revenue to grow 2.7% over the next 12 months, according to S&P, similar to its two-year rate. This underwhelming projection implies its newer products and services will not accelerate revenue growth yet.
Operating margin
Operating margin is a key measure of profitability. Think of it as net income – the bottom line – excluding the impact of taxes and interest on debt, which are less connected to business fundamentals.
Lucky Strike’s operating margin has shrunk over the last 12 months and averaged 11.6% over the last two years. The company’s profitability was mediocre for a consumer discretionary business and shows it couldn’t pass its higher operating expenses on to its customers.
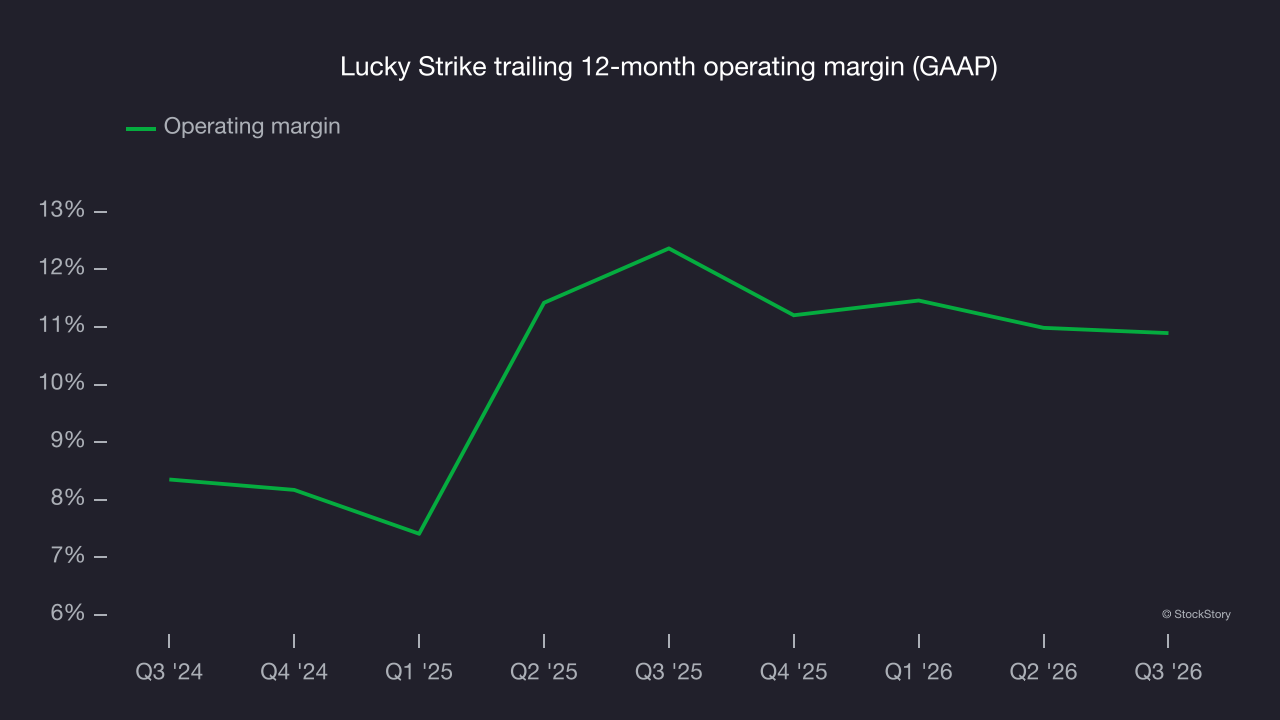
In Q3, Lucky Strike generated an operating margin of 9.3%, in line with the same quarter last year. This indicates the company’s overall cost structure has been relatively stable.
Earnings per share
Revenue trends explain a company’s historical growth, but the long-term change in earnings per share (EPS) points to the profitability of that growth. For example, a company could inflate its revenue through excessive spending on advertising and promotions.
Although Lucky Strike’s full-year earnings are still negative, it reduced its losses and improved its EPS by 3.1% annually over the last five years. The next few quarters will be critical for assessing its long-term profitability.
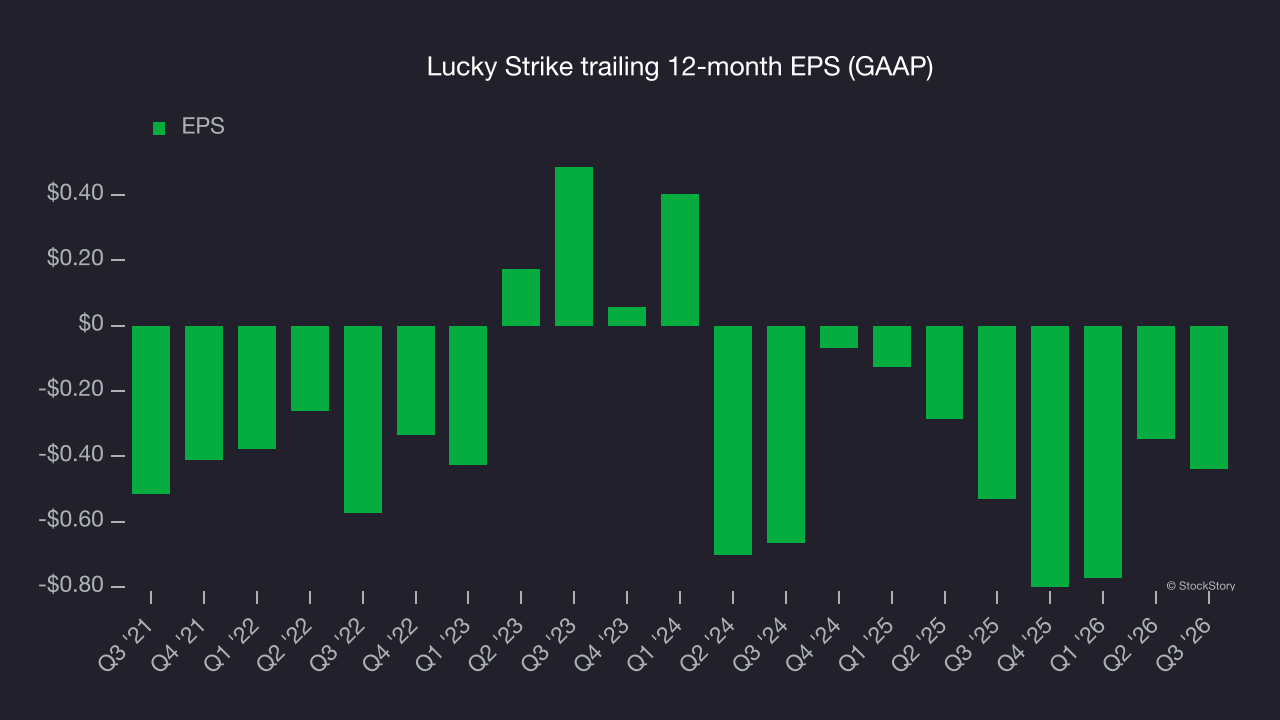
In Q3, Lucky Strike reported EPS of negative $0.21, down from negative $0.12 in the same quarter last year. This result missed analysts’ consensus estimates. Over the next 12 months, analysts forecast Lucky Strike’s full-year EPS will improve from negative $0.44 to roughly break even, according to S&P.
Key takeaways from Lucky Strike’s Q3 results
Lucky Strike’s quarter was mixed: EPS missed estimates despite a narrow revenue beat. Its full-year revenue outlook came in slightly above analysts’ consensus estimates, adding a positive note to the results. Shares tumbled 6.3% to $4.11 immediately after the report.
The latest quarter is only one part of assessing longer-term business quality. Quality, when combined with valuation, can help determine if the stock is a buy. Read the full research report here (it’s free).