Restaurant company Cracker Barrel (NASDAQ: CBRL) reported Q2 CY2026 results topping the market’s revenue expectations, but sales fell by 2.2% year on year to $849.3 million. On the other hand, the company’s full-year revenue guidance of $3.36 billion at the midpoint came in 0.8% below analysts’ estimates. Its non-GAAP profit of $0.99 per share was significantly above analysts’ consensus estimates.
Is now the time to buy Cracker Barrel? Find out by accessing our full research report, it’s free.
Cracker Barrel (CBRL) Q2 CY2026 Highlights:
- Revenue: $849.3 million vs analyst estimates of $836.8 million (2.2% year-on-year decline, 1.5% beat)
- Adjusted EPS: $0.99 vs analyst estimates of $0.17 (significant beat)
- Adjusted EBITDA: $62.05 million vs analyst estimates of $41.96 million (7.3% margin, 47.9% beat)
- EBITDA guidance for the upcoming financial year 2027 is $190 million at the midpoint, above analyst estimates of $178.9 million
- Operating Margin: 1.5%, up from 0.5% in the same quarter last year
- Free Cash Flow Margin: 10.2%, up from 6.5% in the same quarter last year
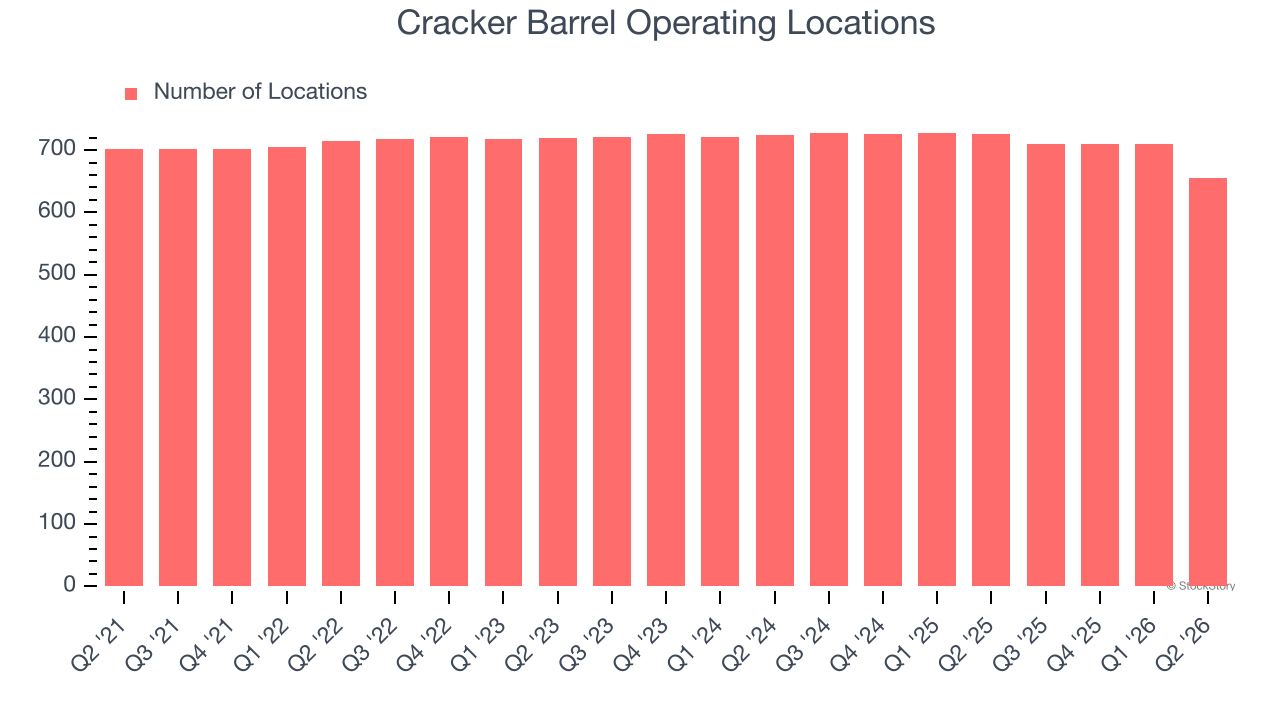
- Locations: 655 at quarter end, down from 725 in the same quarter last year
- Same-Store Sales fell 2.1% year on year (5.4% in the same quarter last year)
- Market Capitalization: $1.06 billion
Cracker Barrel President and Chief Executive Officer David Deno said, "I'm honored to lead such a differentiated and iconic brand. The Company is focused on the right areas and has a strong plan, as demonstrated by the continued improvements in the underlying traffic trend, key guest metrics, and EBITDA results. I am excited about the opportunity ahead and confident that our strategic priorities around food, experience, and people will sustain this momentum and drive long-term value creation."
Company Overview
Known for its country-themed food and merchandise, Cracker Barrel (NASDAQ: CBRL) is a beloved American restaurant and retail chain that celebrates the warmth and charm of Southern hospitality.
Revenue Growth
Reviewing a company’s long-term sales performance reveals insights into its quality. Any business can experience short-term success, but top-performing ones enjoy sustained growth for years.
With $3.32 billion in revenue over the past 12 months, Cracker Barrel is one of the larger restaurant chains in the industry and benefits from a well-known brand that influences consumer purchasing decisions. However, its scale is a double-edged sword because it’s harder to find incremental growth when your existing restaurant banners have penetrated most of the market. For Cracker Barrel to boost its sales, it likely needs to adjust its prices, launch new chains, or lean into foreign markets.
As you can see below, Cracker Barrel’s 1.1% annualized revenue growth over the last seven years was weak as it closed restaurants.
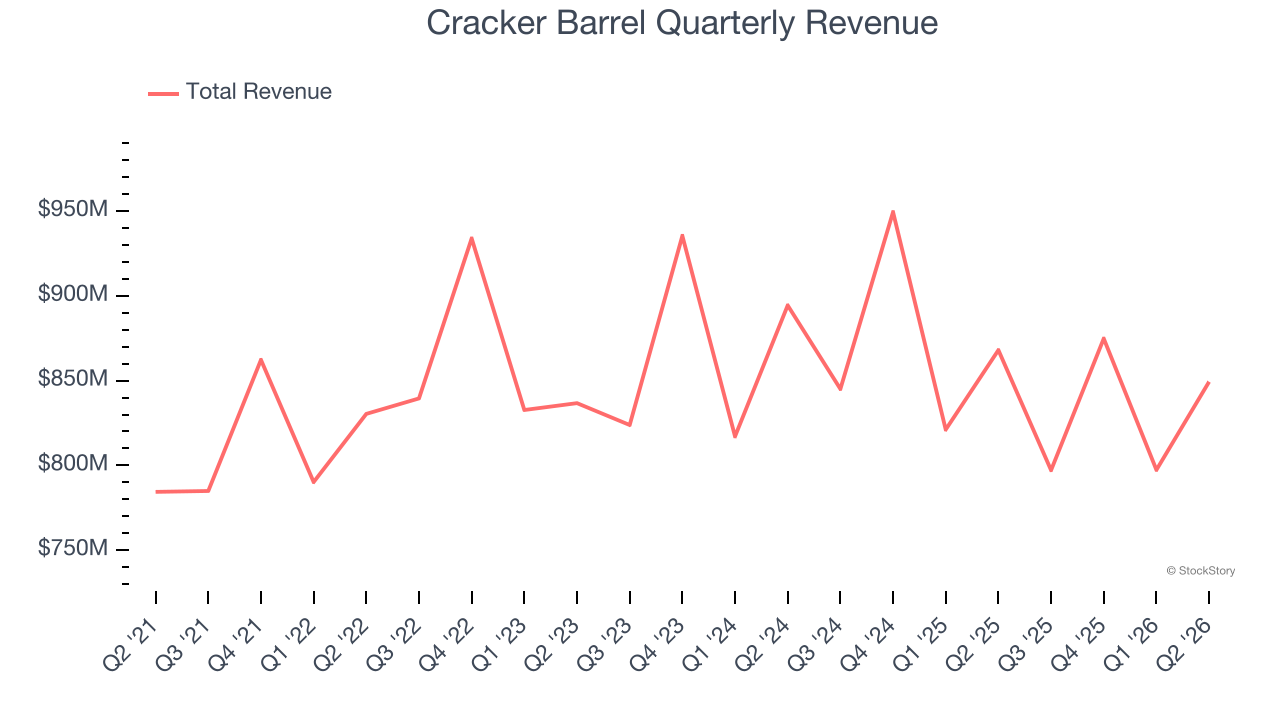
This quarter, Cracker Barrel’s revenue fell by 2.2% year on year to $849.3 million but beat Wall Street’s estimates by 1.5%.
Looking ahead, sell-side analysts expect revenue to remain flat over the next 12 months. This projection is underwhelming and implies its newer menu offerings will not accelerate its top-line performance yet.
ONE MORE THING: 3 Hidden Platforms Growing 3X Faster than Amazon, Google, and PayPal. Amazon, Google, and Meta all followed the same playbook: Dominate an ignored market. Build an unbeatable moat. Scale until you’re unstoppable.
These three platforms are running that exact playbook right now. The early investors in Amazon made fortunes. The early investors in these could do the same. Get All 3 Stocks Here for FREE.
Restaurant Performance
Number of Restaurants
Cracker Barrel listed 655 locations in the latest quarter and has generally closed its restaurants over the last two years, averaging 1.8% annual declines.
When a chain shutters restaurants, it usually means demand for its meals is waning, and it is responding by closing underperforming locations to improve profitability.
Same-Store Sales
A company’s restaurant base only paints one part of the picture. When demand is high, it makes sense to open more. But when demand is low, it’s prudent to close some locations and use the money in other ways. Same-store sales gives us insight into this topic because it measures organic growth at restaurants open for at least a year.
Cracker Barrel’s demand within its existing dining locations has barely increased over the last two years as its same-store sales were flat. This performance isn’t ideal, and Cracker Barrel is attempting to boost same-store sales by closing restaurants (fewer locations sometimes lead to higher same-store sales).
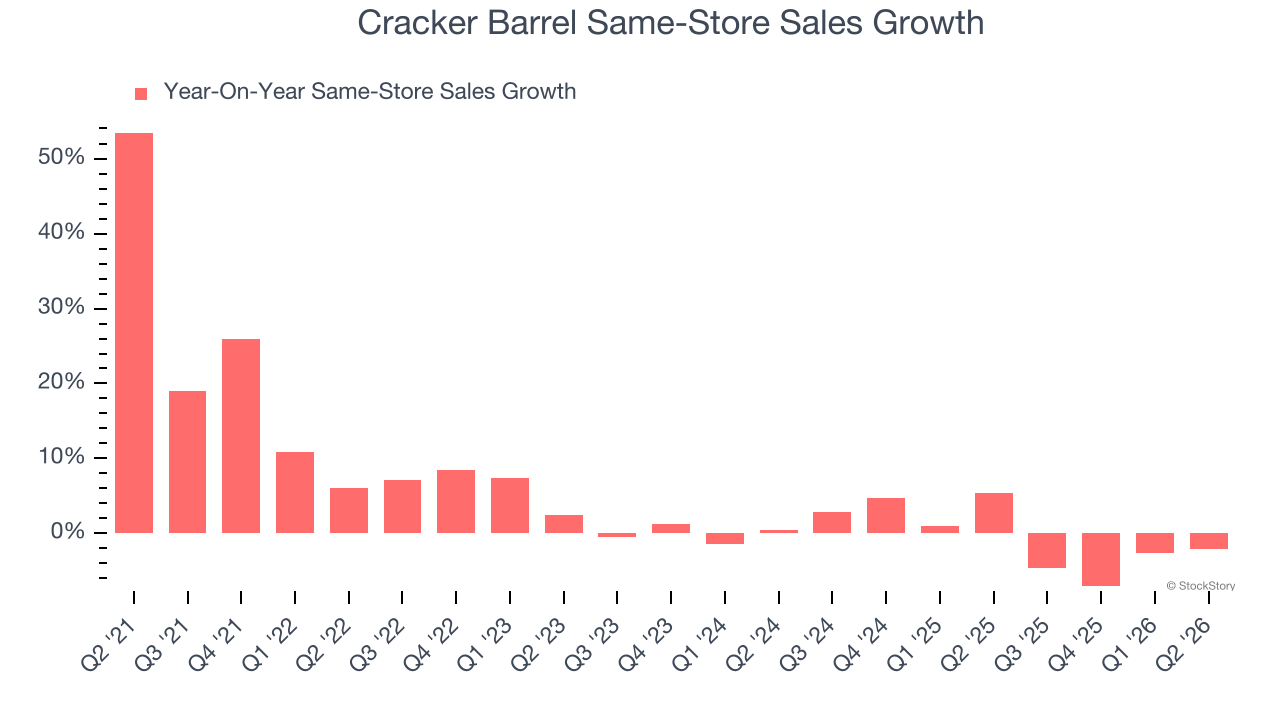
In the latest quarter, Cracker Barrel’s same-store sales fell by 2.1% year on year. This decrease represents a further deceleration from its historical levels. We hope the business can get back on track.
Key Takeaways from Cracker Barrel’s Q2 Results
It was good to see Cracker Barrel beat analysts’ EPS expectations this quarter. We were also excited its EBITDA outperformed Wall Street’s estimates by a wide margin. On the other hand, its full-year revenue guidance slightly missed. Zooming out, we think this was a good print with some key areas of upside. The stock traded up 7.7% to $51.19 immediately following the results.
Cracker Barrel may have had a good quarter, but does that mean you should invest right now? The latest quarter does matter, but not nearly as much as longer-term fundamentals and valuation, when deciding if the stock is a buy. We cover that in our actionable full research report which you can read here (it’s free).