Back in the halcyon days when my late father was teaching me how to chart stocks, there were no trillion-dollar public companies. Not even close. Most of us operating in the markets every day probably didn’t even know what a “trillion” meant. They were good times; innocent times.
And my dad’s focus back then was often on the smallest stocks in the market.
In the course of some research earlier this year, I started thinking about what ground in the US equity market represents “the road less traveled.” That work ultimately resulted in my adding a microcap ETF, IWC, to my ROAR 10 ETF model portfolio.
IWC is one of several ETFs devoted to the market segment known as “microcap stocks.” Generally speaking, this refers to public companies with market capitalization under $1 billion, and in most cases, less than half of that. I know: $10 million here, $10 million there, and before we know it, we’re talking about real money.
But finding the road less traveled goes beyond any one exchange-traded fund. And now, I think I’ve found it.
Digging for Hidden Gems
I often write here about my dad, given that he was my first investing mentor. But here’s a timely nod to my late mom Joyce, who said, “It's always in the place you didn’t expect to find it.”
So in a world where “Billions” was a hit TV show, and “Trillions” is a popular podcast, the contrarian in me is constantly asking, “What are investors in the aggregate missing?”
You never really know until the returns are earned. But I have a hunch that within the landscape of companies too small for most investors to have heard of – and in some cases too small to even crack Russell 3000 membership – there might be something here. And if so, I’ll be able to say, “Dad would have LOVED this market!”
“Sure, that’s a nice story and a great memory, Rob,” I say, speaking to myself as I do all day, navigating my way through the Barchart tool set. “However, isn’t it possible that these modern markets have left tiny little stocks behind for good?”
After all, many younger swing traders today could probably name about 25 stocks, plus another 5-10 they are trading right now.
Who cares about some eight- or nine-figure whatchamacallit name, when Micron (MU), Intel (INTC) and Nvidia (NVDA) have been such easy money? (And as an aside, can you believe Intel’s even part of such a list?)
Frankly, I care. This market is lousy with AI heroes and low P/E zeroes – meaning the stocks have a decent valuation, but the share price doesn’t go up; see about 30% of the S&P 500 Index (SPX) the past few years.
That suggests to me that the hidden gems in this market might just be the most overlooked, well-hidden equities.
To explore this theory, I set out to use a familiar set of Barchart tools, albeit applying them to a very different set of stocks than I’m used to.
Finding Charts That Don’t Suck
Now, don’t give me too much credit for stepping outside of my comfort zone to try to make money with an S&P 500 at all-time highs. This is a contrarian effort.
And more to the point, it’s something many more investors should be doing. Because riding the wave works for a while. But at some point, you have to look for the proverbial coins between the couch cushions.
That said, many of today’s megacap giants were once very small stocks at one point. Still, this is less about finding the next trillion-dollar monster than it is about finding charts that don’t suck.
Why the language? Because this morning, I did indeed chart the S&P 100, which indexes the one hundred largest S&P 500 names by market capitalization. And most of their charts suck.
Maybe that’s a topic for another column, but it bears mentioning here for context – because there are, in fact, a lot of very ominous-looking big-cap stock charts right now. Not all, but most.
Since 1990, Fidelity has had a Low Priced Stock Fund (FLPSX). Its assets today, at around $24 billion, might sound impressive.
But that’s the same figure as back in 2003, and it’s about half of the mutual fund’s 2014 all-time AUM high, even though it has produced around a 10% long-term annualized return. The bottom line: very small stocks have been out of favor, and for a very long time.
Here’s the Barchart ETF Comparison for the iShares Micro-Cap ETF (IWC). It has two primary peers, both of them small-cap ETFs.
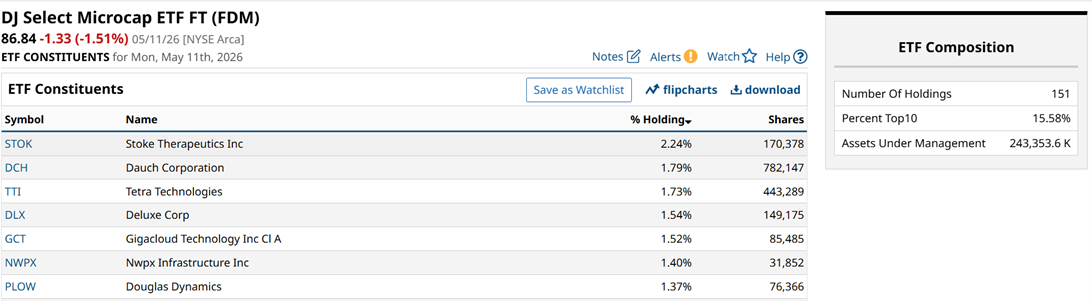
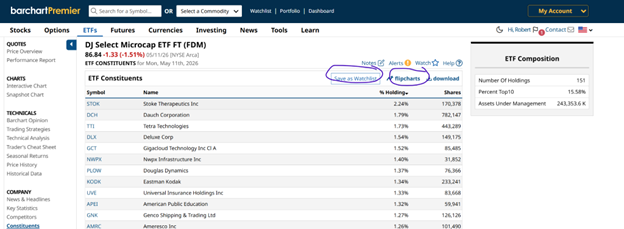
The First Trust Dow Jones Select MicroCap Index Fund (FDM) is about the only other ETF in this niche. Since it already has a fundamental and quality screen, and 150 stocks to IWC’s 1,300, I decided to use FDM as my initial point of comparison.
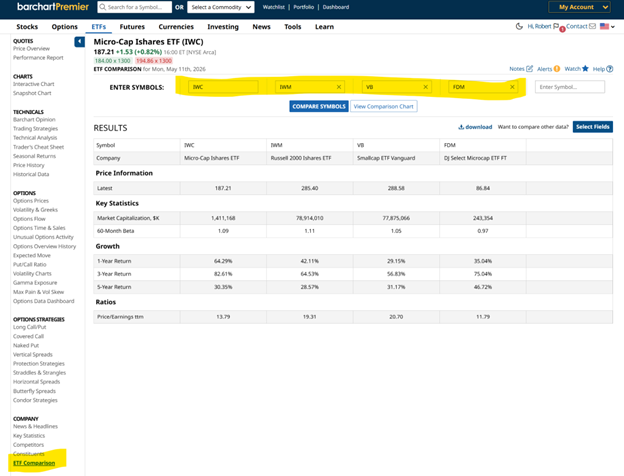
According to its Quote page, FDM’s basket of stocks trades at under 12x trailing earnings, versus IWC’s 14x.
Perhaps more to the benefit of those of us trying to find companies priced to move, I’ll note that the trailing price/earnings (P/E) ratio for the iShares Russell 2000 ETF (IWM) is 19x. IWM is the small-cap market’s answer to the S&P 500, and while it has different flaws than that mighty index, it does have many flaws indeed – not the least of which is that reportedly 40% of its members are facing a “debt cliff” in the coming years.
Translated to English, that means if these companies have to finance their existing debt at current rates, which are now much higher than their last major refi, they might not make it. And I’m not just talking about the refinance; I mean that the companies will be at risk of insolvency.
Think about that the next time some hotshot tells you to “diversify with a small-cap index.”
Why Microcaps Are Different
First, we’ll be considering these small stocks individually, not as a basket. Five to 10 names as a “best-in-show” for fundamentals and technicals would be ideal.
And since these micros are not heavily tied to an index that draws floods of cash each day, like the S&P 500 does, their success is tied to niche execution and local business cycles… as opposed to the global artificial intelligence (AI) trade, which these days is just one big mosh pit of stock market activity.
There’s also the inefficiency aspect here. Because major analysts often ignore these microcap names, the price charts tend to reveal footprints of accumulation long before the news catches up.
I’m observing this now more than ever. Every week, I see a few charts of bigger stocks that seem to defy logic as to why they are trickling higher in price, with no clear narrative. MU was on that regular list of mine not long ago.
Finding Primo Stocks
Before we dive in, I should clarify that I don’t believe in "collecting" stocks. Instead, I believe in modeling outcomes.
To find my shortlist, I took the FDM constituent list — which has already been fundamentally vetted for financial viability, based on the underlying index’s criteria for inclusion — and ran it through a quite seamless, integrated set of Barchart tools.
Step #1: The ETF Members
To start, I pulled up FDM's constituent list.
Obviously, this is just the top of the lineup.
Step #2: Create the Watchlist
I then clicked to save this list of FDM components as a watchlist.
Note that if I had already concluded that these stocks passed muster for my specific criteria, I could skip that step and instead click straight to Flipcharts. This is possibly my personal favorite feature of the entire Barchart site.
However, we’re going to narrow the pool of candidates a bit more before we start charting. Nevertheless, suffice it to say that once you’re in “watchlist mode,” you can easily dive right into technical analysis if you like, or keep refining your list however you prefer.
Like our next step, where we’ll filter for the exact variety of hidden gems we want to unearth.
Step 3: Catch Some ‘Dogs’ with Custom Views
Barchart provides a set of very helpful, easy-to-use data sets known as Views. You can also set up your own Custom Views, which is what you’re looking at below.
I call this one the “DOG CATCHER,” as in: these stocks are dogs. In fact, some of them bring to mind the old adage, “they trade by appointment.” But if they were uber-popular, they wouldn’t be microcaps.
And this type of screen is where I can focus on the contrarian technical approach that I consider my “true” investment identity. It's OK to admit to your true investment identity – we should all have one of those. It’s like the profile name you use to lurk WallStreetBets, except without the mystery.
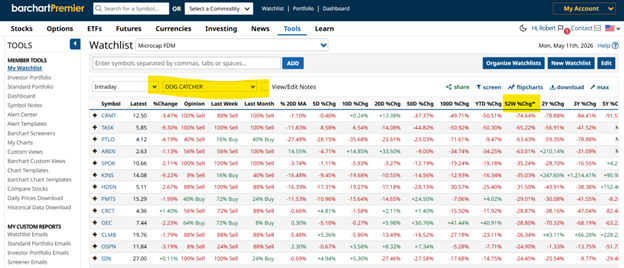
With the DOG CATCHER, I’m taking our watchlist of 150 fundamentally vetted stocks (via their FDM membership) and adding their trailing stock price returns, as well as current Barchart Opinion ratings.
Then, I sorted the list in order of worst 52-week performance to best. That’s simply to see if I can catch some real “dogs” at the start of my chart-flipping.
Note that the further I get into this watchlist, the more I’ll be charting “yesterday’s winners.” In other words, they may have one more chance for a quick pop, but they are most likely not going to be leaders again.
That means they’re a bit like that starting pitcher in baseball: He’s an All-Star, and he might give you a chance in the early innings. You had better get to him sooner, though, because later you won’t have as good a chance.
3 Microcap Stock Charts I Like
I’ll say this: this market is challenged for sustainable winning charts across all market cap levels. Still, here are 3 that stood out to me positively from within our FDM-based watchlist of 150 stocks, with market caps as small as $100 million and as high as $2.3 billion.
I started my analysis with daily charts. My rationale here is that if a stock looks bad on that time frame, there’s not much point in looking beyond that to weekly. Prior to this exercise, I guessed there would be 20-25 decent-looking charts out of the 150.
As it turned out, there were only 6.
And half of those were what I’d consider “too far gone.” In other words, they were already approaching resistance levels, usually previous highs.
While these stocks could break through to new highs, I typically don’t count on that kind of price action. If the prior resistance in question is less than 10% above the current price, that’s simply not enough upside potential (i.e., reward) for me to take on the risk in playing these microcaps.
And I remember my dad saying, back in the day, that it’s often easier to misjudge a chart in this lower-volume corner of the market. Trades by appointment, right?
So, with “charts that still suck” and stocks approaching resistance knocked out of contention, I was able to identify the top 2% of our FDM watchlist.
Three stocks total. Here they are.
And now, the charts.
Starting with American Integrity Insurance Group (AII), a tiny Tampa-based provider of residential property insurance. It IPOed last year, certainly with less fanfare than a few of this year’s recent and expected new offerings will garner.
As opposed to the vast majority of stocks I see across the capitalization spectrum, there’s a base forming below $20, and AII has been to $26 in its brief public life. That’s plenty good enough in this market climate.
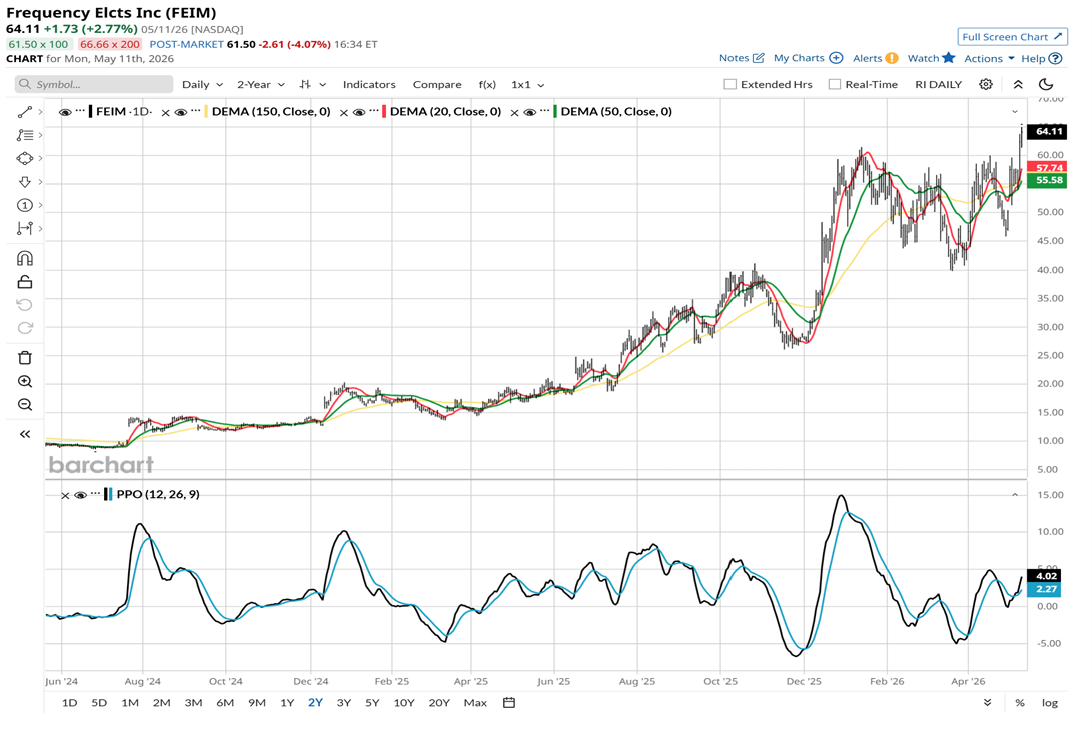
Next is Frequency Electronics (FEIM). To paraphrase a line from one of Elizabeth Volk’s recent articles that made me laugh out loud, the story here is “something something space exploration.”
FEIM’s business is frequency control, thus the company name. And at $600 million in market cap, it totally embodies the definition of a “flyer.” It just broke out to a new high, but its PPO indicator is still nowhere near nosebleed territory. Terrestrial, perhaps, but not grossly overvalued technically.
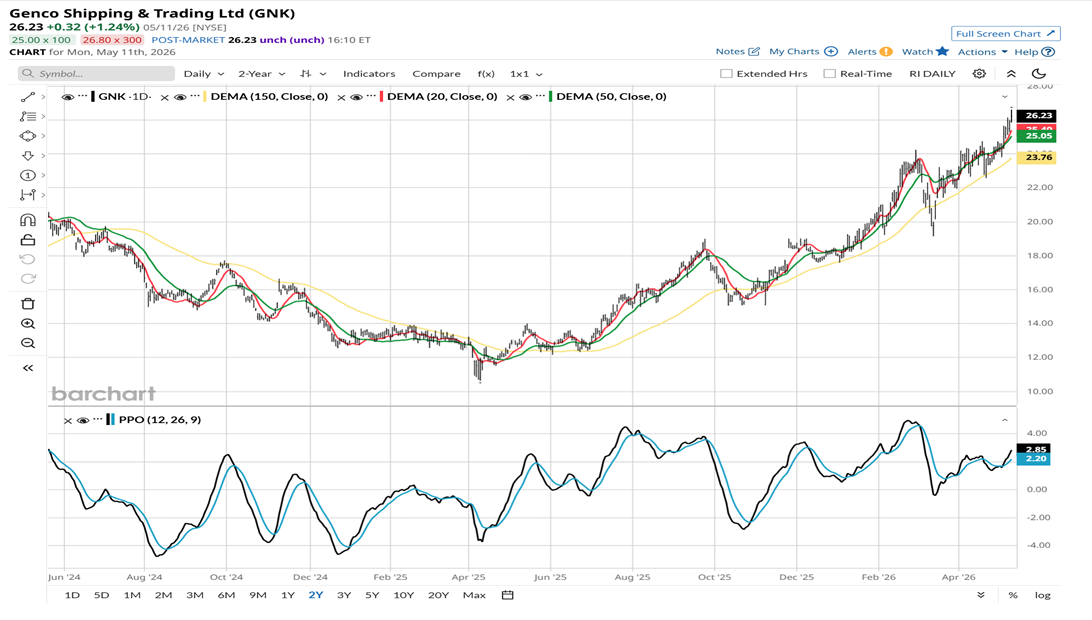
Finally, there’s Genco Shipping & Trading (GNK), which owns ships that transport iron, coal and other dry bulk cargo. This chart is the most stretched of the three presented here. But in a market this wacky, and in an admittedly wacky section of that wacky market, I see it differently. GNK IPOed way back in 2014 and traded up to near $140 immediately.
Today, it is roughly 80% off of that level, and starting to gain some long-term momentum – at a time when shipping is, shall we say, “strait up wild” as an investment opportunity.
Microcaps are not for the timid. So I’ll name GNK to my top three from this batch of 150.
Look Beyond the Big Dogs
I firmly believe we will reach a point in this market cycle where the only stocks that will work are those which are not tied to the major indexes. I do not know when that will occur.
But since I managed other people’s money through the dot-com bubble, and this is looking more like a carbon copy every week, I’ll say this: high correlation has been an investor’s best friend for a long time. Eventually, there will come a time when the only stocks worth owning are the ones few people know about.
Contrarian investing in many forms has taken about a 10-year hiatus. That’s what an era of easy money policies from global central banks has wrought. But to be a successful full-cycle investor, it really helps to think beyond what is popular.
I think microcap stock hunting is a part of that. And I’m wholeheartedly embracing Barchart’s vast analytical playing field to identify my go-to toolset for when that diversity is most sorely needed.
Rob Isbitts created the ROAR Score, based on his 40+ years of technical analysis experience. ROAR helps DIY investors manage risk and create their own portfolios. For Rob's written research, check out ETFYourself.com.
On the date of publication, Rob Isbitts did not have (either directly or indirectly) positions in any of the securities mentioned in this article. All information and data in this article is solely for informational purposes. For more information please view the Barchart Disclosure Policy here.
More news from Barchart
- Magnum Ice Cream Company Surges on Takeover Speculation. What to Know.
- Robust Earnings Growth and Innovation Will Help the Marvell Stock Uptrend Keep Going
- Akamai Stock Is Surging on an Analyst Upgrade. It’s No Longer a Legacy Tech Company.
- Cerebras Stock Pulls Back After Blockbuster IPO. Here's What's Next for the Potential Nvidia Rival.