
Second highest silver reserve and largest gold resource in company history
Hecla Mining Company (NYSE: HL) today reported exploration results and year end reserves. The exploration program has resulted in the second highest silver reserves and the largest gold resource in Hecla’s history. Drilling results include very high-grade and wide intercepts.
This press release features multimedia. View the full release here: https://www.businesswire.com/news/home/20240213785221/en/
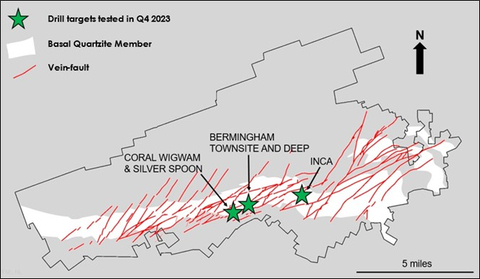
Figure 1: District geology with 2023 drill target locations. (Graphic: Business Wire)
“Hecla’s silver reserves are the second highest in our 133-year history at 238 million silver ounces and only 1% less than last year’s all-time highest reserve, and gold resource is the highest in our history,” said Phillips S. Baker, Jr., President and CEO. “The 2023 exploration program successfully expanded our reserves at Keno Hill and Lucky Friday and expanded mineralization at Greens Creek.”
Baker continued, “Keno Hill’s 2023 exploration provided an 11% increase in reserves, now 45% higher since the acquisition, and does not reflect much of the drilling reported this quarter, so we expect the reserve to grow. Drilling has intersected wider zones and higher grades – such as 54 ounces per ton silver over 39 feet – than are currently in the reserve model and has encountered high-grade mineralization more than 1,000 feet deeper than any previous drilling; both are changing the potential size of the deposit. At Greens Creek, Hecla's exploration efforts spanning 37 years consistently yield remarkable results in both grade and width across the four key metals: silver, gold, zinc, and lead, and we still have many potential targets to drill. It’s almost as if we get a jump in reserves every few years that further extends mine life.”
Baker concluded, “With the recent acquisition of ATAC and its massive 700 square mile land package, we now have 20 district-sized properties with excellent exploration potential to explore and grow our resource base, primarily in the U.S. and Canada. Hecla produces almost half of silver in the U.S., and we expect to be Canada’s largest silver producer in 2024. With half a million ounces of silver required to produce 1 gigawatt of solar, Hecla is playing a key role in mining the silver the world needs.”
EXPLORATION HIGHLIGHTS
Select drill highlights from the company’s exploration programs include the following drill holes, additional drill holes and details are included later in this release.
KENO HILL
-
Footwall Vein: 54.0 oz/ton silver, 4.8% lead, and 2.5% zinc over 39.5 feet
- Includes: 77.1 oz/ton silver, 8.1% lead, and 3.2% zinc over 11.4 feet; and
- Includes: 122.1 oz/ton silver, 8.0% lead, and 6.5% zinc over 8.9 feet
- Footwall Vein: 58.6 oz/ton silver, 3.6% lead, and 4.3% zinc over 10.1 feet
-
Main Vein: 32.7 oz/ton silver, 1.7% lead, and 1.7% zinc over 15.2 feet
- Includes: 78.9 oz/ton silver, 3.9% lead, and 2.3% zinc over 5.8 feet
-
Main Vein: 32.4 oz/ton silver, 8.3% lead, and 4.1% zinc over 9.2 feet
- Includes: 114.9 oz/ton silver, 41.5% lead, and 8.4% zinc over 1.5 feet
GREENS CREEK
West Zone
- 63.4 oz/ton silver, 0.64 oz/ton gold, 8.3% zinc, and 4.3% lead over 26.04 feet
- 28.3 oz/ton silver, 0.08 oz/ton gold, 8.3% zinc, and 4.7% lead over 12.8 feet
- 35.2 oz/ton silver, 0.08 oz/ton gold, 10.0% zinc, and 6.3% lead over 27.3 feet
Upper Plate Zone
- 19.6 oz/ton silver, 0.05 oz/ton gold, 10.9% zinc and 5.4% lead over 27.9 feet
- 28.3 oz/ton silver, 0.01 oz/ton gold, 2.6% zinc and 1.3% lead over 23.9 feet
5250 Zone
- 18.7 oz/ton silver, 0.05 oz/ton gold, 11.4% zinc, and 3.6% lead over 26.8 feet
RESERVES & RESOURCES HIGHLIGHTS
- Silver reserves at 238 million ounces with additions at Keno Hill and Lucky Friday after depletion.
- Keno Hill reserves increased 10% to 55 million ounces, an increase of 45% since acquisition.
- Gold reserves decreased by 16% due to the strategic change to transition to a surface operation only at Casa Berardi.
- Measured and indicated gold reserves increased 21% and inferred gold resources increased 11% following the acquisition of ATAC Resources Ltd (“ATAC”).
YEAR-END 2023 RESERVES AND RESOURCES
On a consolidated basis, the Company replaced 11 million ounces of silver produced during the year. At the Lucky Friday and Keno Hill, production was replaced, and additional silver reserves were defined. Greens Creek saw a drop in silver reserves of 10% due to depletion and other changes not offset by drilling additions. The Company’s proven and probable gold reserves declined 16% to 2.1 million ounces due to having successfully implemented a strategic shift at Casa Berardi transitioning the operation to an open pit only operation.
Reserve metal price assumptions for 2023 were $17/oz silver, $1,650/oz gold, $1.15/lb zinc, and $0.90/lb lead, unchanged from 2022 except for gold, which was $1600/oz in the prior year.
Measured and indicated silver ounces are unchanged with increases at Greens Creek and Keno Hill which offset the decrease at Lucky Friday due to conversion to reserves. Measured and indicated gold ounces also increased 21% to 4.4 million ounces. Losses as a result of the current plan to only mine surface material at Casa Berardi were offset by additions from the acquisition of ATAC Resources Ltd. (ATAC) at the Osiris and Tiger projects in the Yukon.
Inferred silver resources decreased less than 1% to 504 million ounces with decreases at Greens Creek and Lucky Friday almost offset by additions at Keno Hill. Inferred gold resources increased 11% to 6.3 million ounces with decreases at Casa Berardi offset by the addition of the ATAC projects in the Yukon.
Resource metal price assumptions for 2023 were $21/oz silver, $1750/oz gold, $1.35/lb zinc and $1.15/lb lead, and $3.00/lb copper, unchanged from 2022 except for gold, which was $1700/oz in the prior year.
A breakdown of the Company’s reserves and resources is set out in Table A at the end of this news release.
EXPLORATION AND PRE-DEVELOPMENT UPDATE
Keno Hill, Yukon Territory
At Keno Hill, the underground definition and surface exploration drilling programs continued to be focused on extending mineralization, resource conversion in the high-grade Bermingham Bear Zone Veins (Bear, Footwall, and Main Vein Zones), and discovering and defining new mineral resources. During the fourth quarter, two underground drills completed over 12,800 feet of definition and geotechnical drilling, and two surface core drills completed over 14,400 feet of exploration drilling targeting the Deep Bermingham, Bermingham Townsite, Inca, and Coral Wigwam target areas (Figure 1).
Bermingham underground definition and exploration drilling in the three Bear Zone veins (Bear, Footwall, Main veins) continues to extend mineralization to the northeast, southeast, and down dip outside of the current reserve shapes (Figures 2, 3 and 4). Drilling in the Bear Vein identified strong vein mineralization between the Ursa and Splay faults where testing at higher elevations had no significant mineralization; this new drilling expands higher-grade mineralization between the faults and to the southwest near the Arctic fault zone. Drilling in the Footwall Vein intersected substantially wider and higher-grade mineralization than modeled to the southwest internal to the reserve shape. Drilling in the Main Vein intercepted strong mineralization at depth and along strike significantly increasing the strike and depth of high grade in this zone. Assay highlights include (reported widths are estimates of true width):
-
Bear Vein: 21.4 oz/ton silver, 2.8% lead, and 0.5% zinc over 11.7 feet
- Includes: 129.9 oz/ton silver, 14.8% lead, and 3.1% zinc over 1.6 feet
- Bear Vein: 25.5 oz/ton silver, 3.6% lead, and 1.2% zinc over 5.0 feet
-
Footwall Vein: 54.0 oz/ton silver, 4.8% lead, and 2.5% zinc over 39.5 feet
- Includes: 77.1 oz/ton silver, 8.1% lead, and 3.2% zinc over 11.4 feet; and
- Includes: 122.1 oz/ton silver, 8.0% lead, and 6.5% zinc over 8.9 feet
- Footwall Vein: 58.6 oz/ton silver, 3.6% lead, and 4.3% zinc over 10.1 feet
-
Main Vein: 32.7 oz/ton silver, 1.7% lead, and 1.7% zinc over 15.2 feet
- Includes: 78.9 oz/ton silver, 3.9% lead, and 2.3% zinc over 5.8 feet
-
Main Vein: 32.4 oz/ton silver, 8.3% lead, and 4.1% zinc over 9.2 feet
- Includes: 114.9 oz/ton silver, 41.5% lead, and 8.4% zinc over 1.5 feet
Initial surface exploration drilling tested for continuity of the Bermingham vein system at depth intersected strong mineralization (87.2 oz/ton silver over 0.6 feet) 1,050 feet below the existing Deep Bermingham resource. This mineralized intercept resets and expands exploration potential in the district where previously high-grade silver mineralization was thought to occur only in the upper parts of the favorable Basil Quartzite host stratigraphy.
Surface exploration drilling continued targeting the Bermingham Townsite Vein and Townsite Vein Splay system intersected strong mineralization which continues to be open for expansion at depth. Assay highlights include (reported widths are estimates of true width):
- Townsite Vein Splay: 73.5 oz/ton silver, 1.4% lead, and 0.2% zinc over 4.6 feet
Surface exploration drilling targeting the Inca Vein located east of the Hector Calumet area testing for continuity from historic drillhole intercepts intersected strong silver mineralization with significant intercepts associated indium and zinc mineralization. Limited drilling to date has outlined a mineralized zone of over 800 feet of strike length and is open for expansion to the northeast and southwest along strike and up and down dip.
-
Inca Vein 2: 4.7 oz/ton silver, 0.5% lead, 2.7% zinc, and 1.6 oz/ton indium over 22.6 feet
- Includes: 42.9 oz/ton silver, 3.6 oz/ton lead, 21.9% zinc, and 14.9 oz/ton indium over 2.1 feet
-
Inca Vein 2: 5.8 oz/ton silver, 0.2% lead, 1.6% zinc, and 0.9 oz/ton indium over 7.4 feet
- Includes: 107.3 oz/ton silver, 4.6 oz/ton lead, 15.7% zinc, and 10.5 oz/ton indium over 0.4 feet
Greens Creek, Alaska
At Greens Creek, four underground drills completed over 38,000 feet of drilling in 79 drillholes focused on resource conversion and exploration that extends mineralization of known resources. Drilling was focused in the 9a, 200 South, East, West, Gallagher, and Gallagher Fault Block zones while assay results were received from drilling in the 200 South, 5250, East, Upper Plate, West, and 9a zones (Figure 5).
Underground drilling completed 25 drillholes in the 200 South Zone targeting the upper orebody and the deeper mine contact portions of the zone covering a strike length of 1,050 feet. Unexpected zones of mineralized ore lithologies were intersected early in a few of the drillholes before the targeted contact expanding mineralization in those areas. Highlights from this drilling include:
- 17.4 oz/ton silver, 0.02 oz/ton gold, 4.1% zinc, and 3.0% lead over 21.1 feet
- 11.4 oz/ton silver, 0.06 oz/ton gold, 3.1% zinc, and 1.5% lead over 7.0 feet
Drilling in the 5250 Zone targeted 150 feet of strike length in the upper portion of the resources intersected thick sequences of white baritic and massive sulfide ore lithologies above the modeled resources expanding mineralization in that area of the zone. Highlights from this drilling include:
- 18.7 oz/ton silver, 0.05 oz/ton gold, 11.4% zinc, and 3.6% lead over 26.8 feet
Additional assay results have been received from underground drilling in the northern, central, and eastern portion of the Upper Plate zone, targeting mineralization for upgrading and expanding resources over 900 feet of strike length. Results to date indicate that drilling is upgrading and expanding mineralization in the Upper Plate Zone. Highlights from this drilling include:
- 19.6 oz/ton silver, 0.05 oz/ton gold, 10.9% zinc and 5.4% lead over 27.9 feet
- 28.3 oz/ton silver, 0.01 oz/ton gold, 2.6% zinc and 1.3% lead over 23.9 feet
Strong assay results received from underground drilling in the West Zone extend mineralization at the lower mine contact over 400 feet to the west of previous intercepts and infills a 200-foot gap in drilling in the central ore band (Figure 6). Highlights from this drilling include:
- 63.4 oz/ton silver, 0.64 oz/ton gold, 8.3% zinc, and 4.3% lead over 26.04 feet
- 28.3 oz/ton silver, 0.08 oz/ton gold, 8.3% zinc, and 4.7% lead over 12.8 feet
- 35.2 oz/ton silver, 0.08 oz/ton gold, 10.0% zinc, and 6.3% lead over 27.3 feet
Detailed complete drill assay highlights can be found in Table B at the end of the release.
ABOUT HECLA
Founded in 1891, Hecla Mining Company (NYSE: HL) is the largest silver producer in the United States. In addition to operating mines in Alaska, Idaho, and Quebec, Canada, the Company is developing a mine in the Yukon, Canada, and owns a number of exploration and pre-development projects in world-class silver and gold mining districts throughout North America.
Cautionary Statements Regarding Estimates and Forward-Looking Statements, Including 2024 Outlook
Statements made or information provided in this news release that are not historical facts are "forward-looking statements" within the meaning of Section 27A of the Securities Act of 1933, as amended, and Section 21E of the Securities Exchange Act of 1934, as amended, which are intended to be covered by the safe harbor created by such sections and other applicable laws, and "forward-looking information" within the meaning of Canadian securities laws. When a forward-looking statement expresses or implies an expectation or belief as to future events or results, such expectation or belief is expressed in good faith and believed to have a reasonable basis. However, such statements are subject to risks, uncertainties and other factors, which could cause actual results to differ materially from future results expressed, projected or implied by the forward-looking statements. Forward-looking statements often address our expected future business and financial performance and financial condition and often contain words such as “anticipate,” “intend,” “plan,” “will,” “could,” “would,” “estimate,” “should,” “expect,” “believe,” “project,” “target,” “indicative,” “preliminary,” “potential” and similar expressions. Forward-looking statements in this news release may include, without limitation: (i) the Company expects fourth quarter 2023 exploration drilling should grow the reserves at Keno Hill; (ii) the Company expects to grow its resource base, primarily in the U.S. and Canada; (iii) the Company expects to be Canada’s largest silver producer in 2024; and (iv) the Company will play a key role in mining the silver the world needs for decades to come. Estimates or expectations of future events or results are based upon certain assumptions, which may prove to be incorrect, which could cause actual results to differ from forward-looking statements. Such assumptions, include, but are not limited to: (i) there being no significant change to current geotechnical, metallurgical, hydrological and other physical conditions; (ii) permitting, development, operations and expansion of the Company’s projects being consistent with current expectations and mine plans; (iii) political/regulatory developments in any jurisdiction in which the Company operates being consistent with its current expectations; (iv) certain price assumptions for gold, silver, lead and zinc; (v) prices for key supplies being approximately consistent with current levels; (vi) the accuracy of our current mineral reserve and mineral resource estimates; (vii) the Company’s plans for development and production will proceed as expected and will not require revision as a result of risks or uncertainties, whether known, unknown or unanticipated; (viii) sufficient workforce is available and trained to perform assigned tasks; (ix) weather patterns and rain/snowfall within normal seasonal ranges so as not to impact operations; (x) relations with interested parties, including Native Americans, remain productive; and (xi) factors do not arise that reduce available cash balances.
In addition, material risks that could cause actual results to differ from forward-looking statements include, but are not limited to: (i) gold, silver and other metals price volatility; (ii) operating risks; (iii) currency fluctuations; (iv) increased production costs and variances in ore grade or recovery rates from those assumed in mining plans; (v) community relations; (vi) conflict resolution and outcome of projects or oppositions; (vii) litigation, political, regulatory, labor and environmental risks; (viii) exploration risks and results, including that mineral resources are not mineral reserves, they do not have demonstrated economic viability and there is no certainty that they can be upgraded to mineral reserves through continued exploration; (ix) the failure of counterparties to perform their obligations under hedging instruments; (x) we take a material impairment charge on any of our assets; and (xi) inflation causes our costs to rise more than we currently expect. For a more detailed discussion of such risks and other factors, see the Company’s 2023 Annual Report on Form 10-K, to be filed with the Securities and Exchange Commission (“SEC”) on February 15, 2024. The Company does not undertake any obligation to release publicly, revisions to any “forward-looking statement,” including, without limitation, outlook, to reflect events or circumstances after the date of this presentation, or to reflect the occurrence of unanticipated events, except as may be required under applicable securities laws. Investors should not assume that any lack of update to a previously issued “forward-looking statement” constitutes a reaffirmation of that statement. Continued reliance on “forward-looking statements” is at investors’ own risk.
Cautionary Statements to Investors on Reserves and Resources
This news release uses the terms “mineral resources”, “measured mineral resources”, “indicated mineral resources” and “inferred mineral resources”. Mineral resources that are not mineral reserves do not have demonstrated economic viability. You should not assume that all or any part of measured or indicated mineral resources will ever be converted into mineral reserves. Further, inferred mineral resources have a great amount of uncertainty as to their existence and as to whether they can be mined legally or economically, and an inferred mineral resource may not be considered when assessing the economic viability of a mining project, and may not be converted to a mineral reserve. We report reserves and resources under the SEC’s mining disclosure rules (“S-K 1300”) and Canada’s National Instrument 43-101 – Standards of Disclosure for Mineral Projects (“NI 43-101”) because we are a “reporting issuer” under Canadian securities laws. Unless otherwise indicated, all resource and reserve estimates contained in this press release have been prepared in accordance with S-K 1300 as well as NI 43-101.
Qualified Person (QP)
Kurt D. Allen, MSc., CPG, VP - Exploration of Hecla Mining Company and Keith Blair, MSc., CPG, Chief Geologist of Hecla Limited, who serve as a Qualified Person under S-K 1300 and NI 43-101, supervised the preparation of the scientific and technical information concerning Hecla’s mineral projects in this news release. Technical Report Summaries (each a “TRS”) for each of the Company’s Greens Creek and Lucky Friday properties are filed as exhibits 96.1 and 96.2 respectively, to the Company’s Annual Report on Form 10-K for the year ended December 31, 2022 and are available at www.sec.gov. A TRS for each of the Company’s Casa Berardi and Keno Hill properties will be filed as exhibits 96.3 and 96.4, respectively, to the Company’s Annual Report on Form 10-K for the year ended December 31, 2023 to be filed on February 15, 2024 and will then be available at www.sec.gov. Information regarding data verification, surveys and investigations, quality assurance program and quality control measures and a summary of analytical or testing procedures for (i) the Greens Creek Mine are contained in its TRS and in a NI 43-101 technical report titled “Technical Report for the Greens Creek Mine” effective date December 31, 2018, (ii) the Lucky Friday Mine are contained in its TRS and in its technical report titled “Technical Report for the Lucky Friday Mine Shoshone County, Idaho, USA” effective date April 2, 2014, (iii) Casa Berardi will be contained in its TRS titled “Technical Report Summary on the Casa Berardi Mine, Northwestern Quebec, Canada” effective date December 31, 2023 and are contained in its NI 43-101 technical report titled “Technical Report on the mineral resource and mineral reserve estimate for Casa Berardi Mine, Northwestern Quebec, Canada” effective date December 31, 2018, (iv) Keno Hill will be contained in its TRS titled “S-K 1300 Technical Report Summary on the Keno Hill Mine, Yukon, Canada” and are contained its NI 43-101 technical report titled “Technical Report on Updated Mineral Resource and Reserve Estimate of the Keno Hill Silver District” effective date April 1, 2021, and (v) the San Sebastian Mine, Mexico, are contained in a technical report prepared for Hecla titled “Technical Report for the San Sebastian Ag-Au Property, Durango, Mexico” effective date September 8, 2015. Also included or to be included in each TRS and the four technical reports is a description of the key assumptions, parameters and methods used to estimate mineral reserves and resources and a general discussion of the extent to which the estimates may be affected by any known environmental, permitting, legal, title, taxation, socio-political, marketing, or other relevant factors. Information regarding data verification, surveys and investigations, quality assurance program and quality control measures and a summary of sample, analytical or testing procedures are contained in technical reports prepared for Klondex Mines Ltd. for (i) the Fire Creek Mine (technical report dated March 31, 2018), (ii) the Hollister Mine (technical report dated May 31, 2017, amended August 9, 2017), and (iii) the Midas Mine (technical report dated August 31, 2014, amended April 2, 2015). Information regarding data verification, surveys and investigations, quality assurance program and quality control measures and a summary of sample, analytical or testing procedures are contained in technical reports prepared for ATAC Resources Ltd. for (i) the Osiris Project (technical report dated July 28, 2022) and (ii) the Tiger Project (technical report dated February 27, 2020). Copies of these technical reports are available under the SEDAR profiles of Klondex Mines Unlimited Liability Company and ATAC Resources Ltd., respectively, at www.sedar.com (the Fire Creek technical report is also available under Hecla’s profile on SEDAR). Mr. Allen and Mr. Blair reviewed and verified information regarding drill sampling, data verification of all digitally collected data, drill surveys and specific gravity determinations relating to all the mines. The review encompassed quality assurance programs and quality control measures including analytical or testing practice, chain-of-custody procedures, sample storage procedures and included independent sample collection and analysis. This review found the information and procedures meet industry standards and are adequate for Mineral Resource and Mineral Reserve estimation and mine planning purposes.
Table A
Mineral Reserves – 12/31/2023 (1)
Proven Reserves (1) |
|||||||||||
Asset |
Location |
Ownership |
Tons (000) |
Silver
|
Gold
|
Lead
|
Zinc
|
Silver
|
Gold
|
Lead Tons |
Zinc Tons |
Greens Creek (2,3) |
United States |
100.0% |
9 |
11.3 |
0.08 |
3.5 |
8.4 |
100 |
1 |
310 |
740 |
Lucky Friday (2,4) |
United States |
100.0% |
5,299 |
12.8 |
- |
8.0 |
3.8 |
67,595 |
- |
424,080 |
201,280 |
Casa Berardi Underground (2,5) |
Canada |
100.0% |
55 |
- |
0.12 |
- |
- |
- |
7 |
- |
- |
Casa Berardi Open Pit (2,5) |
Canada |
100.0% |
4,240 |
- |
0.09 |
- |
- |
- |
379 |
- |
- |
Keno Hill (2,6) |
Canada |
100.0% |
- |
- |
- |
- |
- |
- |
- |
- |
- |
Total |
|
|
9,603 |
|
|
|
|
67,695 |
387 |
424,390 |
202,020 |
Probable Reserves (7) |
|||||||||||
Asset |
Location |
Ownership |
Tons (000) |
Silver
|
Gold
|
Lead
|
Zinc
|
Silver
|
Gold
|
Lead
|
Zinc
|
Greens Creek (2,3) |
United States |
100.0% |
10,009 |
10.5 |
0.09 |
2.5 |
6.6 |
105,122 |
880 |
250,270 |
657,990 |
Lucky Friday (2,4) |
United States |
100.0% |
966 |
10.8 |
- |
7.1 |
2.9 |
10,411 |
- |
68,320 |
28,100 |
Casa Berardi Underground (2,5) |
Canada |
100.0% |
175 |
- |
0.15 |
- |
- |
- |
26 |
- |
- |
Casa Berardi Open Pit (2,5) |
Canada |
100.0% |
11,384 |
- |
0.08 |
- |
- |
- |
859 |
- |
- |
Keno Hill (2,6) |
Canada |
100.0% |
2,069 |
26.6 |
0.01 |
2.8 |
2.5 |
55,068 |
13 |
58,170 |
52,380 |
Total |
|
|
24,603 |
|
|
|
|
170,601 |
1,778 |
376,760 |
738,470 |
Proven and Probable Reserves |
|||||||||||
Asset |
Location |
Ownership |
Tons (000) |
Silver
|
Gold
|
Lead
|
Zinc
|
Silver
|
Gold
|
Lead
|
Zinc
|
Greens Creek (2,3) |
United States |
100.0% |
10,018 |
10.5 |
0.09 |
2.5 |
6.6 |
105,222 |
881 |
250,580 |
658,730 |
Lucky Friday (2,4) |
United States |
100.0% |
6,265 |
12.5 |
- |
7.9 |
3.7 |
78,006 |
- |
492,400 |
229,380 |
Casa Berardi Underground (2,5) |
Canada |
100.0% |
230 |
- |
0.14 |
- |
- |
- |
33 |
- |
- |
Casa Berardi Open Pit (2,5) |
Canada |
100.0% |
15,624 |
- |
0.08 |
- |
- |
- |
1,238 |
- |
- |
Keno Hill (2,6) |
Canada |
100.0% |
2,069 |
26.6 |
0.01 |
2.8 |
2.5 |
55,068 |
13 |
58,170 |
52,380 |
Total |
34,206 |
|
|
|
238,296 |
2,165 |
801,150 |
940,490 |
|||
(1) |
The term “reserve” means an estimate of tonnage and grade or quality of indicated and measured mineral resources that, in the opinion of the qualified person, can be the basis of an economically viable project. More specifically, it is the economically mineable part of a measured or indicated mineral resource, which includes diluting materials and allowances for losses that may occur when the material is mined or extracted. The term “proven reserves” means the economically mineable part of a measured mineral resource and can only result from conversion of a measured mineral resource. See footnotes 8 and 9 below. |
|
(2) |
Mineral reserves are based on $17/oz silver, $1,650/oz gold, $0.90/lb lead, $1.15/lb zinc, unless otherwise stated. All Mineral Reserves are reported in-situ with estimates of mining dilution and mining loss. |
|
(3) |
The reserve NSR cut-off values for Greens Creek are $230/ton for all zones except the Gallagher Zone at $235/ton; metallurgical recoveries (actual 2023): 80% for silver, 74% for gold, 82% for lead, and 89% for zinc. |
|
(4) |
The reserve NSR cut-off values for Lucky Friday are $241.34/ton for the 30 Vein and $268.67/ton for the Intermediate Veins; metallurgical recoveries (actual 2023): 96% for silver, 95% for lead, and 85% for zinc |
|
(5) |
The average reserve cut-off grades at Casa Berardi are 0.11 oz/ton gold underground and 0.03 oz/ton gold for open pit. Metallurgical recovery (actual 2023): 85% for gold; US$/CAN$ exchange rate: 1:1.3. Underground mineral reserves at Casa Berardi were based on a gold price of $1,850/oz. |
|
(6) |
The reserve NSR cut-off value at Keno Hill is $244.24/ton (CAN$350/tonne), Metallurgical recovery (actual 2023): 96% for silver, 93% for lead, 81% for zinc; US$/CAN$ exchange rate: 1:1.3 |
|
(7) |
The term “probable reserves” means the economically mineable part of an indicated and, in some cases, a measured mineral resource. See footnotes 9 and 10 below. |
|
| Totals may not represent the sum of parts due to rounding | ||
Mineral Resources - 12/31/2023 (8)
Measured Resources (9) |
|||||||||||||
Asset |
Location |
Ownership |
Tons (000) |
Silver
|
Gold
|
Lead
|
Zinc
|
Copper
|
Silver
|
Gold
|
Lead
|
Zinc
|
Copper
|
Greens Creek (12,13) |
United States |
100.0% |
- |
- |
- |
- |
- |
- |
- |
- |
- |
- |
- |
Lucky Friday (12,14) |
United States |
100.0% |
5,326 |
8.6 |
- |
5.6 |
2.7 |
- |
45,785 |
- |
299,360 |
146,420 |
- |
Casa Berardi Underground(12,15) |
Canada |
100.0% |
1,099 |
- |
0.21 |
- |
- |
- |
- |
234 |
- |
- |
- |
Casa Berardi Open Pit (12,15) |
Canada |
100.0% |
67 |
- |
0.03 |
- |
- |
- |
- |
2 |
- |
- |
- |
Keno Hill (12,16) |
Canada |
100.0% |
- |
- |
- |
- |
- |
- |
- |
- |
- |
- |
- |
San Sebastian - Oxide (17) |
Mexico |
100.0% |
- |
- |
- |
- |
- |
- |
- |
- |
- |
- |
- |
San Sebastian - Sulfide (17) |
Mexico |
100.0% |
- |
- |
- |
- |
- |
- |
- |
- |
- |
- |
- |
Fire Creek (18,19) |
United States |
100.0% |
- |
- |
- |
- |
- |
- |
- |
- |
- |
- |
- |
Hollister (18,20) |
United States |
100.0% |
18 |
4.9 |
0.59 |
- |
- |
- |
87 |
10 |
- |
- |
- |
Midas (18,21) |
United States |
100.0% |
2 |
7.6 |
0.68 |
- |
- |
- |
14 |
1 |
- |
- |
- |
Heva (22) |
Canada |
100.0% |
- |
- |
- |
- |
- |
- |
- |
- |
- |
- |
- |
Hosco (22) |
Canada |
100.0% |
- |
- |
- |
- |
- |
- |
- |
- |
- |
- |
- |
Star (12,23) |
United States |
100.0% |
- |
- |
- |
- |
- |
- |
- |
- |
- |
- |
- |
Rackla - Tiger Underground (29) |
Canada |
100.0% |
881 |
- |
0.09 |
- |
- |
- |
- |
75 |
- |
- |
- |
Rackla - Tiger Open Pit (29) |
Canada |
100.0% |
32 |
- |
0.06 |
- |
- |
- |
- |
2 |
- |
- |
- |
Rackla - Osiris Underground (30) |
Canada |
100.0% |
- |
- |
- |
- |
- |
- |
- |
- |
- |
- |
- |
Rackla - Osiris Open Pit (30) |
Canada |
100.0% |
- |
- |
- |
- |
- |
- |
- |
- |
- |
- |
- |
Total |
|
|
7,425 |
|
|
|
|
|
45,886 |
324 |
299,360 |
146,420 |
- |
Indicated Resources (10) |
|||||||||||||
Asset |
Location |
Ownership |
Tons (000) |
Silver
|
Gold
|
Lead
|
Zinc
|
Copper
|
Silver
|
Gold
|
Lead
|
Zinc
|
Copper
|
Greens Creek (12,13) |
United States |
100.0% |
8,040 |
13.9 |
0.10 |
3.0 |
8.0 |
- |
111,526 |
800 |
239,250 |
643,950 |
- |
Lucky Friday (12,14) |
United States |
100.0% |
1,011 |
8.0 |
- |
6.0 |
2.7 |
- |
8,136 |
- |
60,200 |
26,910 |
- |
Casa Berardi Underground (12,15) |
Canada |
100.0% |
3,154 |
- |
0.19 |
- |
- |
- |
- |
603 |
- |
- |
- |
Casa Berardi Open Pit (12,15) |
Canada |
100.0% |
205 |
- |
0.03 |
- |
- |
- |
- |
5 |
- |
- |
- |
Keno Hill (12,16) |
Canada |
100.0% |
4,504 |
7.5 |
0.006 |
0.9 |
3.5 |
- |
33,926 |
26 |
41,120 |
157,350 |
- |
San Sebastian - Oxide (17) |
Mexico |
100.0% |
1,453 |
6.5 |
0.09 |
- |
- |
- |
9,430 |
135 |
- |
- |
- |
San Sebastian - Sulfide (17) |
Mexico |
100.0% |
1,187 |
5.5 |
0.01 |
1.9 |
2.9 |
1.2 |
6,579 |
16 |
22,420 |
34,100 |
14,650 |
Fire Creek (18,19) |
United States |
100.0% |
114 |
1.0 |
0.46 |
- |
- |
- |
113 |
53 |
- |
- |
- |
Hollister (18,20) |
United States |
100.0% |
70 |
1.9 |
0.58 |
- |
- |
- |
130 |
40 |
- |
- |
- |
Midas (18,21) |
United States |
100.0% |
76 |
5.7 |
0.42 |
- |
- |
- |
430 |
32 |
- |
- |
- |
Heva (22) |
Canada |
100.0% |
1,266 |
- |
0.06 |
- |
- |
- |
- |
76 |
- |
- |
- |
Hosco (22) |
Canada |
100.0% |
29,287 |
- |
0.04 |
- |
- |
- |
- |
1,202 |
- |
- |
- |
Star (12,23) |
United States |
100.0% |
1,068 |
3.0 |
- |
6.4 |
7.7 |
- |
3,177 |
- |
67,970 |
82,040 |
- |
Rackla - Tiger Underground (29) |
Canada |
100.0% |
3,116 |
- |
0.10 |
- |
- |
- |
- |
311 |
- |
- |
- |
Rackla - Tiger Open Pit (29) |
Canada |
100.0% |
960 |
- |
0.08 |
- |
- |
- |
- |
76 |
- |
- |
- |
Rackla - Osiris Underground (30) |
Canada |
100.0% |
5,135 |
- |
0.12 |
- |
- |
- |
- |
604 |
- |
- |
- |
Rackla - Osiris Open Pit (30) |
Canada |
100.0% |
960 |
- |
0.13 |
- |
- |
- |
- |
128 |
- |
- |
- |
Total |
|
|
61,606 |
|
|
|
|
|
173,447 |
4,107 |
430,960 |
944,350 |
14,650 |
Measured & Indicated Resources |
|||||||||||||
Asset |
Location |
Ownership |
Tons (000) |
Silver
|
Gold
|
Lead
|
Zinc
|
Copper
|
Silver
|
Gold
|
Lead
|
Zinc
|
Copper
|
Greens Creek (12,13) |
United States |
100.0% |
8,040 |
13.9 |
0.10 |
3.0 |
8.0 |
- |
111,526 |
800 |
239,250 |
643,950 |
- |
Lucky Friday (12,14) |
United States |
100.0% |
6,337 |
8.3 |
- |
5.8 |
2.7 |
- |
53,921 |
- |
359,560 |
173,330 |
- |
Casa Berardi Underground (12,15) |
Canada |
100.0% |
4,253 |
- |
0.20 |
- |
- |
- |
- |
837 |
- |
- |
- |
Casa Berardi Open Pit (12,15) |
Canada |
100.0% |
272 |
- |
0.03 |
- |
- |
- |
- |
7 |
- |
- |
- |
Keno Hill (12,16) |
Canada |
100.0% |
4,504 |
7.5 |
0.006 |
0.9 |
3.5 |
- |
33,926 |
26 |
41,120 |
157,350 |
- |
San Sebastian - Oxide (17) |
Mexico |
100.0% |
1,453 |
6.5 |
0.09 |
- |
- |
- |
9,430 |
135 |
- |
- |
- |
San Sebastian - Sulfide (17) |
Mexico |
100.0% |
1,187 |
5.5 |
0.01 |
1.9 |
2.9 |
1.2 |
6,579 |
16 |
22,420 |
34,100 |
14,650 |
Fire Creek (18,19) |
United States |
100.0% |
114 |
1.0 |
0.46 |
- |
- |
- |
113 |
53 |
- |
- |
- |
Hollister (18,20) |
United States |
100.0% |
88 |
2.5 |
0.58 |
- |
- |
- |
217 |
50 |
- |
- |
- |
Midas (18,21) |
United States |
100.0% |
78 |
5.7 |
0.43 |
- |
- |
- |
444 |
33 |
- |
- |
- |
Heva (22) |
Canada |
100.0% |
1,266 |
- |
0.06 |
- |
- |
- |
- |
76 |
- |
- |
- |
Hosco (22) |
Canada |
100.0% |
29,287 |
- |
0.04 |
- |
- |
- |
- |
1,202 |
- |
- |
- |
Star (12,23) |
United States |
100.0% |
1,068 |
3.0 |
- |
6.4 |
7.7 |
- |
3,177 |
- |
67,970 |
82,040 |
- |
Rackla - Tiger Underground (29) |
Canada |
100.0% |
3,997 |
- |
0.10 |
- |
- |
- |
- |
386 |
- |
- |
- |
Rackla - Tiger Open Pit (29) |
Canada |
100.0% |
992 |
- |
0.08 |
- |
- |
- |
- |
78 |
- |
- |
- |
Rackla - Osiris Underground (30) |
Canada |
100.0% |
5,135 |
- |
0.12 |
- |
- |
- |
- |
604 |
- |
- |
- |
Rackla - Osiris Open Pit (30) |
Canada |
100.0% |
960 |
- |
0.13 |
- |
- |
- |
- |
128 |
- |
- |
- |
Total |
|
|
69,031 |
|
|
|
|
|
219,333 |
4,431 |
730,320 |
1,090,770 |
14,650 |
Inferred Resources (11) |
|||||||||||||
Asset |
Location |
Ownership |
Tons (000) |
Silver
|
Gold
|
Lead
|
Zinc
|
Copper
|
Silver
|
Gold
|
Lead
|
Zinc
|
Copper
|
Greens Creek (12,13) |
United States |
100.0% |
1,930 |
13.4 |
0.08 |
2.9 |
6.9 |
- |
25,891 |
154 |
55,890 |
133,260 |
- |
Lucky Friday (12,14) |
United States |
100.0% |
3,600 |
7.8 |
- |
5.9 |
2.8 |
- |
27,934 |
- |
211,340 |
100,630 |
- |
Casa Berardi Underground (12,15) |
Canada |
100.0% |
1,475 |
- |
0.22 |
- |
- |
- |
- |
332 |
- |
- |
- |
Casa Berardi Open Pit (12,15) |
Canada |
100.0% |
828 |
- |
0.08 |
- |
- |
- |
- |
64 |
- |
- |
- |
Keno Hill (12,16) |
Canada |
100.0% |
2,836 |
11.2 |
0.003 |
1.1 |
1.8 |
- |
31,791 |
9 |
32,040 |
51,870 |
- |
San Sebastian - Oxide (17) |
Mexico |
100.0% |
3,490 |
6.4 |
0.05 |
- |
- |
- |
22,353 |
182 |
- |
- |
- |
San Sebastian - Sulfide (17) |
Mexico |
100.0% |
385 |
4.2 |
0.01 |
1.6 |
2.3 |
0.9 |
1,606 |
5 |
6,070 |
8,830 |
3,330 |
Fire Creek (18,19) |
United States |
100.0% |
764 |
0.5 |
0.51 |
- |
- |
- |
393 |
392 |
- |
- |
- |
Fire Creek - Open Pit (24) |
United States |
100.0% |
74,584 |
0.1 |
0.03 |
- |
- |
- |
5,232 |
2,178 |
- |
- |
- |
Hollister (18,20) |
United States |
100.0% |
642 |
3.0 |
0.42 |
- |
- |
- |
1,916 |
273 |
- |
- |
- |
Midas (18,21) |
United States |
100.0% |
1,232 |
6.3 |
0.50 |
- |
- |
- |
7,723 |
615 |
- |
- |
- |
Heva (22) |
Canada |
100.0% |
2,787 |
- |
0.08 |
- |
- |
- |
- |
216 |
- |
- |
- |
Hosco (22) |
Canada |
100.0% |
17,726 |
- |
0.04 |
- |
- |
- |
- |
663 |
- |
- |
- |
Star (12,23) |
United States |
100.0% |
2,851 |
3.1 |
- |
5.9 |
5.9 |
- |
8,795 |
- |
168,180 |
166,930 |
- |
San Juan Silver (12,25) |
United States |
100.0% |
2,570 |
14.9 |
0.01 |
1.4 |
1.1 |
- |
38,203 |
34 |
49,400 |
39,850 |
- |
Monte Cristo (26) |
United States |
100.0% |
913 |
0.3 |
0.14 |
- |
- |
- |
271 |
131 |
- |
- |
- |
Rock Creek (12,27) |
United States |
100.0% |
100,086 |
1.5 |
- |
- |
- |
0.7 |
148,736 |
- |
- |
- |
658,680 |
Libby Exploration Project (12,28) |
United States |
100.0% |
112,185 |
1.6 |
- |
- |
- |
0.7 |
183,346 |
- |
- |
- |
759,420 |
Rackla - Tiger Underground (29) |
Canada |
100.0% |
30 |
- |
0.05 |
- |
- |
- |
- |
2 |
- |
- |
- |
Rackla - Tiger Open Pit (29) |
Canada |
100.0% |
152 |
- |
0.07 |
- |
- |
- |
- |
10 |
- |
- |
- |
Rackla - Osiris Underground (30) |
Canada |
100.0% |
5,919 |
- |
0.09 |
- |
- |
- |
- |
530 |
- |
- |
- |
Rackla - Osiris Open Pit (30) |
Canada |
100.0% |
4,398 |
- |
0.12 |
- |
- |
- |
- |
514 |
- |
- |
- |
Total |
|
|
341,383 |
|
|
|
|
|
504,190 |
6,304 |
522,920 |
501,370 |
1,421,430 |
| Note: All estimates are in-situ except for the proven reserves at Greens Creek which are in surface stockpiles. Mineral resources are exclusive of reserves. | ||
(8) |
The term "mineral resources" means a concentration or occurrence of material of economic interest in or on the Earth's crust in such form, grade or quality, and quantity that there are reasonable prospects for economic extraction. A mineral resource is a reasonable estimate of mineralization, taking into account relevant factors such as cut-off grade, likely mining dimensions, location or continuity, that, with the assumed and justifiable technical and economic conditions, is likely to, in whole or in part, become economically extractable. It is not merely an inventory of all mineralization drilled or sampled. |
|
(9) |
The term "measured resources" means that part of a mineral resource for which quantity and grade or quality are estimated on the basis of conclusive geological evidence and sampling. The level of geological certainty associated with a measured mineral resource is sufficient to allow a qualified person to apply modifying factors in sufficient detail to support detailed mine planning and final evaluation of the economic viability of the deposit. Because a measured mineral resource has a higher level of confidence than the level of confidence of either an indicated mineral resource or an inferred mineral resource, a measured mineral resource may be converted to a proven mineral reserve or to a probable mineral reserve. |
|
(10) |
The term "indicated resources" means that part of a mineral resource for which quantity and grade or quality are estimated on the basis of adequate geological evidence and sampling. The level of geological certainty associated with an indicated mineral resource is sufficient to allow a qualified person to apply modifying factors in sufficient detail to support mine planning and evaluation of the economic viability of the deposit. Because an indicated mineral resource has a lower level of confidence than the level of confidence of a measured mineral resource, an indicated mineral resource may only be converted to a probable mineral reserve. |
|
(11) |
The term "inferred resources" means that part of a mineral resource for which quantity and grade or quality are estimated on the basis of limited geological evidence and sampling. The level of geological uncertainty associated with an inferred mineral resource is too high to apply relevant technical and economic factors likely to influence the prospects of economic extraction in a manner useful for evaluation of economic viability. Because an inferred mineral resource has the lowest level of geological confidence of all mineral resources, which prevents the application of the modifying factors in a manner useful for evaluation of economic viability, an inferred mineral resource may not be considered when assessing the economic viability of a mining project, and may not be converted to a mineral reserve. |
|
(12) |
Mineral resources for operating properties are based on $1,750/oz gold, $21/oz silver, $1.15/lb lead, $1.35/lb zinc and $3.00/lb copper, unless otherwise stated. Mineral resources for non-operating resource projects are based on $1,700/oz for gold, $21.00/oz for silver, $1.15/lb for lead, $1.35/lb for zinc and $3.00/lb for copper, unless otherwise stated. |
|
(13) |
The resource NSR cut-off values for Greens Creek are $230/ton for all zones except the Gallagher Zone at $235/ton; metallurgical recoveries (actual 2023): 80% for silver, 74% for gold, 82% for lead, and 89% for zinc. |
|
(14) |
The resource NSR cut-off values for Lucky Friday are $200.57/ton for the 30 Vein, $227.90/ton for the Intermediate Veins and $198.48/ton for the Lucky Friday Veins; metallurgical recoveries (actual 2023): 96% for silver, 95% for lead, and 85% for zinc |
|
(15) |
The average resource cut-off grades at Casa Berardi are 0.12 oz/ton gold for underground and 0.03 oz/ton gold for open pit; metallurgical recovery (actual 2023): 85% for gold; US$/CAN$ exchange rate: 1:1.3. |
|
(16) |
The resource NSR cut-off value at Keno Hill is $129.10/ton (CAN$185/tonne); using minimum width of 4.9 feet (1.5m); metallurgical recovery (actual 2023): 96% for silver, 93% for lead, 81% for zinc; US$/CAN$ exchange rate: 1:1.3 |
|
(17) |
Indicated resources for most zones at San Sebastian based on $1,500/oz gold, $21/oz silver, $1.15/lb lead, $1.35/lb zinc and $3.00/lb copper using a cut-off grade of $90.72/ton ($100/tonne); $1700/oz gold used for Toro, Bronco, and Tigre zones. Metallurgical recoveries based on grade dependent recovery curves: recoveries at the mean resource grade average 89% for silver and 84% for gold for oxide material and 85% for silver, 83% for gold, 81% for lead, 86% for zinc, and 83% for copper for sulfide material. Resources reported at a minimum mining width of 8.2 feet (2.5m) for Middle Vein, North Vein, and East Francine, 6.5ft (1.98m) for El Toro, El Bronco, and El Tigre, and 4.9 feet (1.5 m) for Hugh Zone and Andrea. |
|
(18) |
Mineral resources for Fire Creek, Hollister and Midas are reported using $1,500/oz gold and $21/oz silver prices, unless otherwise noted. A minimum mining width is defined as four feet or the vein true thickness plus two feet, whichever is greater. |
|
(19) |
Fire Creek mineral resources are reported at a gold equivalent cut-off grade of 0.283 oz/ton. Metallurgical recoveries: 90% for gold and 70% for silver. |
|
(20) |
Hollister mineral resources, including the Hatter Graben are reported at a gold equivalent cut-off grade of 0.238 oz/ton. Metallurgical recoveries: 88% for gold and 66% for silver |
|
(21) |
Midas mineral resources are reported at a gold equivalent cut-off grade of 0.237 oz/ton. Metallurgical recoveries: 90% for gold and 70% for silver. A gold-equivalent cut-off grade of 0.1 oz/ton and a gold price of $1,700/oz used for Sinter Zone with resources undiluted. |
|
(22) |
Measured, indicated and inferred resources at Heva and Hosco are based on $1,500/oz gold. Resources are without dilution or material loss at a gold cut-off grade of 0.01 oz/ton for open pit and 0.088 oz/ton for underground. Metallurgical recovery: Heva: 95% for gold, Hosco: 88% for gold. |
|
(23) |
Indicated and Inferred resources at the Star property are reported using a minimum mining width of 4.3 feet and an NSR cut-off value of $150/ton; Metallurgical recovery: 93% for silver, 93% for lead, and 87% for zinc. |
|
(24) |
Inferred open-pit resources for Fire Creek calculated November 30, 2017 using gold and silver recoveries of 65% and 30% for oxide material and 60% and 25% for mixed oxide-sulfide material. Indicated Resources reclassified as Inferred in 2019. Open pit resources are calculated at $1,400 gold and $19.83 silver and cut-off grade of 0.01 Au Equivalent oz/ton and is inclusive of 10% mining dilution and 5% ore loss. Open pit mineral resources exclusive of underground mineral resources. NI43-101 Technical Report for the Fire Creek Project, Lander County, Nevada; Effective Date March 31, 2018; prepared by Practical Mining LLC, Mark Odell, P.E. for Hecla Mining Company, June28, 2018. |
|
(25) |
Inferred resources reported at a minimum mining width of 6.0 feet for Bulldog and an NSR cut-off value of $175/ton and 5.0 feet for Equity and North Amethyst veins at an NSR cut-off value of $100/ton; Metallurgical recoveries based on grade dependent recovery curves; metal recoveries at the mean resource grade average 89% silver, 74% lead, and 81% zinc for the Bulldog and a constant 85% gold and 85% silver for North Amethyst and Equity. |
|
(26) |
Inferred resource at Monte Cristo reported at a minimum mining width of 5.0 feet; resources based on $1,400 Au, $26.50 Ag using a 0.06 oz/ton gold cut-off grade. Metallurgical recovery: 90% for gold and 90% silver. |
|
(27) |
Inferred resource at Rock Creek reported at a minimum thickness of 15 feet and an NSR cut-off value of $24.50/ton; Metallurgical recoveries: 88% for silver and 92% for copper. Resources adjusted based on mining restrictions as defined by U.S. Forest Service, Kootenai National Forest in the June 2003 'Record of Decision, Rock Creek Project'. |
|
(28) |
Inferred resource at the Libby Exploration Project reported at a minimum thickness of 15 feet and an NSR cut-off value of $24.50/ton NSR; Metallurgical recoveries: 88% for silver and 92% copper. Resources adjusted based on mining restrictions as defined by U.S. Forest Service, Kootenai National Forest, Montana DEQ in December 2015 'Joint Final EIS, Montanore Project' and the February 2016 U.S Forest Service - Kootenai National Forest 'Record of Decision, Montanore Project'. |
|
(29) |
Mineral resources at the Rackla-Tiger Project are based on a gold price of $1650/oz, metallurgical recovery of 95% for gold, and cut-off grades of 0.02 oz/ton gold for the open pit portion of the resources and 0.04 oz/ton gold for the underground portions of the resources; US$/CAN$ exchange rate: 1:1.3. |
|
(30) |
Mineral resources at the Rackla-Osiris Project are based on a gold price of $1,850/oz, metallurgical recovery of 83% for gold, and cut-off grades of 0.03 oz/ton gold for the open pit portion of the resources and 0.06 oz/ton gold for the underground portions of the resources; US$/CAN$ exchange rate: 1:1.3. |
|
| Totals may not represent the sum of parts due to rounding | ||
Table B
Assay Results – Q4 2022
Keno Hill |
Zone |
Drillhole Number |
Drillhole Azm/Dip |
Sample From (feet) |
Sample To (feet) |
True Width (feet) |
Silver (oz/ton) |
Gold (oz/ton) |
Lead (%) |
Zinc (%) |
Indium (oz/ton) |
Depth From Surface (feet) |
Underground |
Bermingham Bear Vein |
BMUG23-086 |
153/-13 |
268.7 |
272.7 |
2.6 |
49.7 |
0.01 |
12.8 |
4.3 |
|
897 |
Bermingham Bear Vein |
BMUG23-087 |
153/-20 |
304.8 |
308.2 |
1.4 |
50.0 |
0.01 |
0.9 |
1.0 |
|
948 |
|
Bermingham Bear Vein |
BMUG23-088 |
145/-17 |
255.4 |
255.9 |
0.3 |
39.7 |
0.00 |
18.5 |
0.1 |
|
910 |
|
Bermingham Bear Vein |
BMUG23-089 |
145/-25 |
338.7 |
345.6 |
3.9 |
0.1 |
0.00 |
0.0 |
0.0 |
|
991 |
|
Bermingham Bear Vein |
BMUG23-090 |
136/-14 |
228.1 |
240.1 |
9.0 |
10.8 |
0.00 |
0.4 |
0.4 |
|
886 |
|
Bermingham Bear Vein |
Including |
230.2 |
231.3 |
0.8 |
83.7 |
0.01 |
1.4 |
1.4 |
|
887 |
||
Bermingham Bear Vein |
BMUG23-091 |
136/-21 |
278.9 |
279.5 |
0.3 |
0.4 |
0.00 |
0.0 |
0.0 |
|
932 |
|
Bermingham Bear Vein |
BMUG23-092 |
136/-26 |
347.9 |
350.7 |
1.0 |
0.1 |
0.00 |
0.0 |
0.0 |
|
1001 |
|
Bermingham Bear Vein |
BMUG23-093 |
130/-14 |
221.1 |
225.1 |
2.8 |
82.5 |
0.01 |
7.2 |
1.5 |
|
889 |
|
Bermingham Bear Vein |
Including |
222.0 |
223.1 |
0.8 |
278.5 |
0.00 |
25.0 |
5.0 |
|
889 |
||
Bermingham Bear Vein |
BMUG23-094 |
130/-20 |
254.0 |
259.5 |
3.7 |
2.7 |
0.00 |
0.1 |
0.5 |
|
925 |
|
Bermingham Bear Vein |
BMUG23-095 |
115/-7 |
351.5 |
354.6 |
2.7 |
10.8 |
0.00 |
1.6 |
0.4 |
|
925 |
|
Bermingham Bear Vein |
BMUG23-096 |
130/-26 |
352.0 |
355.6 |
1.3 |
0.1 |
0.00 |
0.0 |
0.0 |
|
1007 |
|
Bermingham Bear Vein |
BMUG23-097 |
145/06 |
373.1 |
379.7 |
5.0 |
25.5 |
0.02 |
3.6 |
1.2 |
|
847 |
|
Bermingham Bear Vein |
BMUG23-098A |
120/-15 |
212.9 |
213.9 |
0.7 |
0.6 |
0.00 |
0.3 |
0.5 |
|
877 |
|
Bermingham Bear Vein |
BMUG23-105 |
140/-08 |
388.8 |
404.6 |
11.7 |
21.4 |
0.00 |
2.8 |
0.5 |
|
947 |
|
Bermingham Bear Vein |
Including |
396.6 |
398.8 |
1.6 |
129.9 |
0.01 |
14.8 |
3.1 |
|
949 |
||
Bermingham Bear Vein |
Including |
404.3 |
404.6 |
0.2 |
84.3 |
0.01 |
22.8 |
3.0 |
|
950 |
||
Bermingham Bear Vein |
BMUG23-106 |
110/-22 |
249.5 |
252.1 |
1.4 |
0.1 |
0.00 |
0.0 |
0.0 |
|
926 |
|
Bermingham Bear Vein |
BMUG23-107 |
100/-16 |
348.9 |
357.0 |
3.4 |
0.2 |
0.00 |
0.0 |
0.0 |
|
928 |
|
Bermingham Footwall Vein |
BMUG23-087 |
153/-20 |
611.4 |
614.3 |
2.2 |
8.8 |
0.01 |
0.7 |
0.9 |
|
1096 |
|
Bermingham Footwall Vein |
BMUG23-088 |
145/-17 |
548.9 |
561.5 |
10.1 |
58.6 |
0.01 |
3.6 |
4.3 |
|
1010 |
|
Bermingham Footwall Vein |
BMUG23-090 |
136/-14 |
497.7 |
509.2 |
10.1 |
13.9 |
0.00 |
0.9 |
2.9 |
|
966 |
|
Bermingham Footwall Vein |
Including |
497.7 |
498.8 |
1.0 |
121.0 |
0.02 |
6.4 |
24.4 |
|
965 |
||
Bermingham Footwall Vein |
BMUG23-093 |
130/-14 |
483.9 |
487.4 |
3.0 |
17.7 |
0.00 |
0.2 |
1.8 |
|
968 |
|
Bermingham Footwall Vein |
Including |
483.9 |
485.8 |
1.7 |
31.4 |
0.00 |
0.3 |
2.9 |
|
968 |
||
Bermingham Footwall Vein |
BMUG23-094 |
130/-20 |
510.7 |
513.0 |
2.0 |
6.9 |
0.00 |
0.2 |
1.8 |
|
1001 |
|
Bermingham Footwall Vein |
BMUG23-098A |
120/-15 |
471.5 |
485.9 |
12.2 |
8.3 |
0.01 |
1.1 |
3.1 |
|
958 |
|
Bermingham Footwall Vein |
Including |
473.4 |
474.3 |
0.8 |
21.8 |
0.01 |
7.3 |
13.1 |
|
958 |
||
Bermingham Footwall Vein |
Including |
484.6 |
485.9 |
1.1 |
47.7 |
0.02 |
4.7 |
1.4 |
|
961 |
||
Bermingham Footwall Vein |
BMUG23-105 |
140/-08 |
553.9 |
598.2 |
39.5 |
54.0 |
0.01 |
4.8 |
2.5 |
|
980 |
|
Bermingham Footwall Vein |
Including |
554.7 |
567.4 |
11.4 |
77.1 |
0.02 |
8.1 |
3.2 |
|
981 |
||
Bermingham Footwall Vein |
Including |
574.5 |
575.1 |
0.6 |
137.7 |
0.01 |
44.5 |
6.2 |
|
984 |
||
Bermingham Footwall Vein |
Including |
583.3 |
593.3 |
8.9 |
122.1 |
0.01 |
8.0 |
6.5 |
|
985 |
||
Bermingham Main Vein |
BMUG23-086 |
153/-13 |
615.8 |
631.1 |
10.3 |
28.3 |
0.00 |
0.9 |
0.1 |
|
974 |
|
Bermingham Main Vein |
Including |
615.8 |
617.8 |
1.4 |
117.0 |
0.01 |
2.0 |
0.1 |
|
974 |
||
Bermingham Main Vein |
Including |
628.5 |
631.1 |
1.8 |
47.6 |
0.01 |
2.1 |
0.4 |
|
974 |
||
Bermingham Main Vein |
BMUG23-087 |
153/-20 |
766.1 |
783.9 |
9.2 |
32.4 |
0.01 |
8.3 |
4.1 |
|
1152 |
|
Bermingham Main Vein |
Including |
770.0 |
772.9 |
1.5 |
114.9 |
0.02 |
41.5 |
8.4 |
|
1152 |
||
Bermingham Main Vein |
Including |
779.8 |
783.9 |
2.1 |
35.7 |
0.01 |
1.6 |
3.5 |
|
1152 |
||
Bermingham Main Vein |
BMUG23-088 |
145/-17 |
604.2 |
608.1 |
2.8 |
1.2 |
0.00 |
0.1 |
0.0 |
|
1028 |
|
Bermingham Main Vein |
BMUG23-090 |
136/-14 |
528.2 |
547.3 |
15.2 |
32.7 |
0.01 |
1.7 |
1.7 |
|
978 |
|
Bermingham Main Vein |
Including |
531.8 |
539.1 |
5.8 |
78.9 |
0.01 |
3.9 |
2.3 |
|
978 |
||
Bermingham Main Vein |
BMUG23-093 |
130/-14 |
494.1 |
507.5 |
10.1 |
19.8 |
0.01 |
1.0 |
3.9 |
|
971 |
|
Bermingham Main Vein |
Including |
494.1 |
499.5 |
4.1 |
46.3 |
0.02 |
2.2 |
9.2 |
|
971 |
||
Bermingham Main Vein |
BMUG23-094 |
130/-20 |
535.1 |
539.0 |
3.0 |
15.4 |
0.01 |
0.9 |
1.1 |
|
1014 |
|
Bermingham Main Vein |
Including |
535.1 |
535.9 |
0.6 |
70.6 |
0.01 |
3.2 |
3.6 |
|
1014 |
||
Bermingham Main Vein |
BMUG23-105 |
140/-08 |
674.0 |
680.1 |
4.4 |
0.2 |
0.00 |
0.0 |
0.1 |
|
1001 |
|
Stockwork Mineralization |
BMUG23-086 |
153/-13 |
137.2 |
137.8 |
0.4 |
12.6 |
0.00 |
5.7 |
6.7 |
|
863 |
|
Stockwork Mineralization |
BMUG23-087 |
153/-20 |
635.2 |
636.2 |
0.7 |
89.5 |
0.02 |
1.7 |
4.6 |
|
1096 |
|
Stockwork Mineralization |
BMUG23-092 |
136/-26 |
407.4 |
417.3 |
3.6 |
0.9 |
0.00 |
0.4 |
0.2 |
|
1024 |
|
Stockwork Mineralization |
BMUG23-104 |
110/-15 |
403.9 |
407.3 |
2.4 |
5.4 |
0.00 |
0.0 |
3.7 |
|
944 |
|
Stockwork Mineralization |
Including |
403.9 |
404.6 |
0.5 |
22.7 |
0.00 |
0.1 |
15.4 |
|
944 |
||
Surface Exploration |
Bermingham Footwall Vein |
K-23-0855 |
278/-63 |
3138.9 |
3139.8 |
0.6 |
87.2 |
0.03 |
0.0 |
0.0 |
|
2719 |
Bermingham Footwall Vein |
K-23-0869 |
285/-54 |
2632.0 |
2634.1 |
1.8 |
0.2 |
0.00 |
0.0 |
0.0 |
|
1995 |
|
Bermingham Main Vein |
K-23-0855 |
278/-63 |
2438.9 |
2457.7 |
16.9 |
0.1 |
0.00 |
0.0 |
0.0 |
|
2186 |
|
Bermingham Main Vein |
K-23-0869 |
285/-54 |
2223.7 |
2224.6 |
0.9 |
2.7 |
0.00 |
1.0 |
0.4 |
|
1729 |
|
Bermingham Main Vein |
K-23-0869 |
285/-54 |
2317.6 |
2318.4 |
0.8 |
1.1 |
0.00 |
0.5 |
1.4 |
|
1831 |
|
Bermingham Ruby Vein |
K-23-0860 |
330/-60 |
540.0 |
543.1 |
2.8 |
0.4 |
0.00 |
0.0 |
0.1 |
|
394 |
|
Bermingham Ruby Vein |
K-23-0870 |
300/-66.5 |
757.9 |
762.3 |
3.5 |
33.2 |
0.00 |
0.0 |
0.0 |
|
636 |
|
Bermingham Townsite Vein |
K-23-0860 |
330/-60 |
1013.6 |
1014.3 |
0.6 |
0.4 |
0.00 |
0.0 |
0.0 |
|
720 |
|
Bermingham Townsite Vein |
K-23-0860 |
330/-60 |
1073.1 |
1075.9 |
2.4 |
0.1 |
0.00 |
0.0 |
0.4 |
|
762 |
|
Bermingham Townsite Vein |
TSUG23-001 |
030/-55 |
451.7 |
455.9 |
2.7 |
0.3 |
0.00 |
0.0 |
0.0 |
|
1031 |
|
Bermingham Townsite Vein |
K-23-0861 |
315/-60 |
1018.4 |
1023.1 |
4.3 |
1.7 |
0.00 |
0.4 |
0.7 |
|
770 |
|
Bermingham Townsite Vein |
K-23-0862 |
309/-65 |
1082.2 |
1084.5 |
2.0 |
6.1 |
0.00 |
0.5 |
0.1 |
|
969 |
|
Bermingham Townsite Vein |
K-23-0863 |
338/-53 |
596.1 |
609.5 |
12.5 |
3.2 |
0.00 |
0.1 |
1.6 |
|
427 |
|
Bermingham Townsite Vein |
K-23-0864 |
308/-59 |
592.8 |
594.7 |
1.7 |
0.2 |
0.01 |
0.0 |
0.2 |
|
463 |
|
Bermingham Townsite Vein |
K-23-0865 |
308/-70 |
665.5 |
667.5 |
1.7 |
1.2 |
0.00 |
0.1 |
0.7 |
|
587 |
|
Bermingham Townsite Vein |
K-23-0867 |
305/-67 |
1070.5 |
1079.6 |
8.0 |
5.4 |
0.00 |
0.3 |
0.1 |
|
889 |
|
Bermingham Townsite Vein |
Including |
1070.5 |
1070.9 |
0.3 |
30.6 |
0.01 |
4.2 |
1.5 |
|
889 |
||
Bermingham Townsite Vein |
Including |
1078.8 |
1079.6 |
0.6 |
51.6 |
0.01 |
2.1 |
0.1 |
|
889 |
||
Bermingham Townsite Vein |
K-23-0868 |
271/-75 |
803.5 |
804.5 |
0.7 |
0.1 |
0.00 |
0.0 |
0.1 |
|
755 |
|
Bermingham Townsite Vein |
K-23-0870 |
300/-66.5 |
1166.5 |
1168.8 |
2.0 |
8.1 |
0.00 |
0.0 |
3.6 |
|
997 |
|
Bermingham Townsite Vein |
TSUG23-002 |
023/-74 |
487.0 |
489.6 |
1.8 |
0.2 |
0.00 |
0.0 |
0.0 |
|
1159 |
|
Bermingham Townsite Vein splay |
K-23-0862 |
309/-65 |
1195.0 |
1200.5 |
4.6 |
73.5 |
0.01 |
1.4 |
0.2 |
|
1029 |
|
Bermingham Townsite Vein splay |
Including |
1195.8 |
1200.5 |
3.9 |
85.7 |
0.02 |
1.6 |
0.2 |
|
1029 |
||
Bermingham Townsite Vein splay |
K-23-0865 |
308/-70 |
693.9 |
698.7 |
4.0 |
0.3 |
0.00 |
0.2 |
0.4 |
|
612 |
|
Bermingham Townsite Vein splay |
K-23-0870 |
300/-66.5 |
1186.9 |
1196.7 |
8.4 |
2.4 |
0.00 |
0.5 |
0.1 |
|
1007 |
|
Bermingham Townsite Vein Stockwork |
K-23-0867 |
305/-67 |
1053.6 |
1054.0 |
0.4 |
7.7 |
0.01 |
0.8 |
4.8 |
|
840 |
|
Coral Wigwam Walleye Vein |
K-23-0857 |
260/-73 |
1603.0 |
1608.7 |
3.2 |
0.1 |
0.00 |
0.1 |
0.0 |
|
1512 |
|
Coral Wigwam Walleye Vein |
K-23-0858 |
297/-73 |
1488.7 |
1492.1 |
2.3 |
24.9 |
0.00 |
0.0 |
0.1 |
|
1353 |
|
Inca Vein 1 |
K-23-0871 |
314/-65 |
585.4 |
595.2 |
8.6 |
6.9 |
0.00 |
0.3 |
2.7 |
0.3 |
571 |
|
Inca Vein 1 |
K-23-0872 |
336/-58 |
610.2 |
612.5 |
1.9 |
6.4 |
0.00 |
0.2 |
8.6 |
4.5 |
548 |
|
Inca Vein 1 |
K-23-0873 |
355/-56 |
587.2 |
590.1 |
2.5 |
14.6 |
0.00 |
1.0 |
4.3 |
1.7 |
467 |
|
Inca Vein 1 |
K-23-0874 |
007/-67 |
713.4 |
714.2 |
0.6 |
1.4 |
0.00 |
0.0 |
3.0 |
1.7 |
605 |
|
Inca Vein 2 |
K-23-0873 |
355/-56 |
671.4 |
702.1 |
22.6 |
4.7 |
0.00 |
0.5 |
2.7 |
1.6 |
545 |
|
Inca Vein 2 |
Including |
696.0 |
698.8 |
2.1 |
42.9 |
0.02 |
3.6 |
21.9 |
14.9 |
567 |
||
Inca Vein 2 |
K-23-0874 |
007/-67 |
757.1 |
759.0 |
1.3 |
4.2 |
0.02 |
0.9 |
13.8 |
9.6 |
646 |
|
Inca Vein 2 |
K-23-0874 |
007/-67 |
767.7 |
778.5 |
7.4 |
5.8 |
0.00 |
0.2 |
1.6 |
0.9 |
656 |
|
Inca Vein 2 |
Including |
767.7 |
768.2 |
0.4 |
107.3 |
0.03 |
4.6 |
15.7 |
10.5 |
656 |
||
Inca Vein 2 |
K-23-0874 |
007/-67 |
800.4 |
806.9 |
4.4 |
3.0 |
0.01 |
3.5 |
12.1 |
10.1 |
687 |
|
Greens Creek (Alaska) |
Zone |
Drill Hole Number |
Drill Hole Azm/Dip |
Sample From (feet) |
Sample To (feet) |
Est. True Width (feet) |
Silver (oz/ton) |
Gold (oz/ton) |
Zinc (%) |
Lead (%) |
Depth From Mine Portal (feet) |
Underground |
200 South |
GC6069 |
216.7/-81.4 |
603.0 |
604.7 |
1.2 |
10.8 |
0.07 |
5.9 |
3.3 |
-1907 |
200 South |
GC6120 |
131.8/-83.5 |
301.5 |
306.5 |
2.5 |
20.0 |
0.01 |
1.9 |
1.1 |
-1620 |
|
200 South |
GC6120 |
131.8/-83.5 |
589.4 |
592.4 |
2.8 |
8.6 |
0.13 |
0.2 |
0.1 |
-1909 |
|
200 South |
GC6120 |
131.8/-83.5 |
638.6 |
641.6 |
1.8 |
12.2 |
0.05 |
1.0 |
0.4 |
-1959 |
|
200 South |
GC6162 |
243.4/63.7 |
13.5 |
14.5 |
0.9 |
11.5 |
0.05 |
6.0 |
4.4 |
-1266 |
|
200 South |
GC6162 |
243.4/63.7 |
32.0 |
41.0 |
8.1 |
6.1 |
0.04 |
6.8 |
3.3 |
-1244 |
|
200 South |
GC6162 |
243.4/63.7 |
64.0 |
65.7 |
1.5 |
5.3 |
0.02 |
12.0 |
4.2 |
-1219 |
|
200 South |
GC6170 |
63.4/52.9 |
104.0 |
106.9 |
2.4 |
8.1 |
0.09 |
2.3 |
1.8 |
-1195 |
|
200 South |
GC6192 |
243.4/-44.1 |
65.5 |
67.0 |
1.4 |
10.6 |
0.02 |
4.8 |
2.2 |
-1344 |
|
200 South |
GC6192 |
243.4/-44.1 |
71.0 |
73.0 |
1.9 |
8.9 |
0.02 |
6.6 |
3.3 |
-1347 |
|
200 South |
GC6192 |
243.4/-44.1 |
81.0 |
83.6 |
2.4 |
9.1 |
0.03 |
4.3 |
2.3 |
-1353 |
|
200 South |
GC6192 |
243.4/-44.1 |
120.0 |
160.0 |
21.1 |
17.4 |
0.02 |
4.1 |
3.0 |
-1389 |
|
200 South |
GC6195 |
243.4/-23.6 |
37.5 |
45.3 |
7.0 |
11.4 |
0.06 |
3.1 |
1.5 |
-1313 |
|
200 South |
GC6196 |
243.4/-13.1 |
36.1 |
40.8 |
3.2 |
4.2 |
0.01 |
9.0 |
4.4 |
-1299 |
|
200 South |
GC6200 |
63.4/47.5 |
49.0 |
57.6 |
3.7 |
5.7 |
0.03 |
6.1 |
3.2 |
-1243 |
|
200 South |
GC6200 |
63.4/47.5 |
87.6 |
93.0 |
4.4 |
3.6 |
0.06 |
2.7 |
1.2 |
-1216 |
|
200 South |
GC6200 |
63.4/47.5 |
104.4 |
105.6 |
0.8 |
6.9 |
0.05 |
6.5 |
3.1 |
-1205 |
|
5250 |
GC6151 |
36.5/27 |
0.0 |
30.5 |
10.6 |
20.0 |
0.14 |
11.8 |
3.9 |
266 |
|
5250 |
GC6151 |
36.5/27 |
61.8 |
92.0 |
30.0 |
14.2 |
0.07 |
8.4 |
2.4 |
287 |
|
5250 |
GC6151 |
36.5/27 |
104.0 |
131.6 |
26.8 |
18.7 |
0.05 |
11.4 |
3.6 |
310 |
|
East |
GC6152 |
23.1/59.6 |
188.6 |
189.7 |
1.0 |
8.4 |
0.01 |
9.2 |
6.7 |
76 |
|
East |
GC6160 |
63.4/48.6 |
204.0 |
205.6 |
1.5 |
6.5 |
0.01 |
10.1 |
6.1 |
68 |
|
East |
GC6165 |
63.4/31.6 |
247.8 |
259.0 |
7.4 |
12.7 |
0.02 |
5.8 |
3.3 |
44 |
|
East |
GC6165 |
63.4/31.6 |
267.0 |
271.0 |
2.7 |
9.7 |
0.07 |
2.3 |
1.4 |
38 |
|
East |
GC6207 |
63.4/50.7 |
164.5 |
176.0 |
11.0 |
14.3 |
0.04 |
2.4 |
2.0 |
45 |
|
East |
GC6207 |
63.4/50.7 |
193.4 |
194.7 |
1.1 |
4.0 |
0.02 |
9.5 |
4.5 |
50 |
|
East |
GC6207 |
63.4/50.7 |
203.3 |
204.6 |
0.7 |
21.5 |
0.01 |
3.7 |
2.0 |
75 |
|
Upper Plate |
GC6127 |
351.2/76 |
77.9 |
106.2 |
27.9 |
19.6 |
0.05 |
10.9 |
5.4 |
93 |
|
Upper Plate |
GC6127 |
351.2/76 |
130.7 |
132.3 |
1.6 |
16.3 |
0.05 |
15.1 |
7.5 |
113 |
|
Upper Plate |
GC6127 |
351.2/76 |
141.8 |
143.3 |
1.5 |
2.2 |
0.01 |
14.0 |
6.3 |
142 |
|
Upper Plate |
GC6127 |
351.2/76 |
167.0 |
183.0 |
15.0 |
15.0 |
0.07 |
12.9 |
4.8 |
246 |
|
Upper Plate |
GC6141 |
222.3/56.3 |
222.4 |
227.0 |
3.9 |
17.9 |
0.01 |
6.6 |
3.4 |
200 |
|
Upper Plate |
GC6149 |
14/70.2 |
465.5 |
466.7 |
1.1 |
11.7 |
0.01 |
1.9 |
1.1 |
288 |
|
Upper Plate |
GC6164 |
54.5/73.6 |
348.0 |
372.0 |
23.9 |
28.3 |
0.01 |
2.6 |
1.3 |
198 |
|
Upper Plate |
GC6164 |
54.5/73.6 |
461.5 |
466.2 |
4.6 |
13.9 |
0.01 |
1.9 |
0.7 |
299 |
|
Upper Plate |
GC6191 |
253.9/74.1 |
506.9 |
526.4 |
14.9 |
13.0 |
0.02 |
2.7 |
1.1 |
352 |
|
Upper Plate |
GC6191 |
253.9/74.1 |
557.6 |
561.7 |
3.5 |
11.4 |
0.01 |
10.1 |
3.7 |
388 |
|
Upper Plate |
GC6201 |
254.8/48.6 |
726.2 |
732.9 |
4.8 |
24.3 |
0.02 |
18.5 |
8.5 |
380 |
|
Upper Plate |
GC6206 |
5.3/73.9 |
226.0 |
247.0 |
18.4 |
11.1 |
0.04 |
5.3 |
3.3 |
288 |
|
Upper Plate |
GC6209 |
15.3/69.4 |
146.0 |
159.0 |
7.4 |
12.3 |
0.01 |
1.4 |
0.7 |
223 |
|
Upper Plate |
GC6209 |
15.3/69.4 |
242.0 |
250.0 |
7.9 |
14.2 |
0.05 |
5.7 |
3.9 |
313 |
|
Upper Plate |
GC6219 |
225.9/64.8 |
154.0 |
161.2 |
6.8 |
38.3 |
0.03 |
9.3 |
4.4 |
223 |
|
Upper Plate |
GC6219 |
225.9/64.8 |
178.5 |
194.0 |
14.0 |
8.7 |
0.02 |
7.6 |
3.4 |
249 |
|
Upper Plate |
GC6219 |
225.9/64.8 |
241.0 |
244.0 |
3.0 |
16.0 |
0.06 |
0.2 |
0.1 |
298 |
|
Upper Plate |
GC6220 |
259.2/76.2 |
124.1 |
129.2 |
5.1 |
13.1 |
0.01 |
5.1 |
2.0 |
205 |
|
Upper Plate |
GC6220 |
259.2/76.2 |
239.5 |
259.4 |
19.9 |
21.5 |
0.03 |
12.9 |
6.4 |
326 |
|
West |
GC6179 |
16.1/-40.8 |
21.4 |
28.1 |
6.4 |
8.8 |
0.01 |
5.4 |
2.4 |
-116 |
|
West |
GC6179 |
16.1/-40.8 |
50.0 |
59.4 |
9.0 |
7.3 |
0.04 |
11.5 |
4.6 |
-134 |
|
West |
GC6179 |
16.1/-40.8 |
63.0 |
66.2 |
3.1 |
3.5 |
0.05 |
15.2 |
7.5 |
-139 |
|
West |
GC6179 |
16.1/-40.8 |
92.5 |
107.0 |
12.7 |
8.4 |
0.02 |
19.6 |
9.6 |
-164 |
|
West |
GC6183 |
243.4/-82.6 |
120.3 |
128.8 |
8.5 |
10.4 |
0.07 |
20.0 |
8.9 |
-221 |
|
West |
GC6212 |
63.4/-9.5 |
110.5 |
112.4 |
0.9 |
0.6 |
0.01 |
10.3 |
8.9 |
-111 |
|
West |
GC6212 |
63.4/-9.5 |
126.3 |
136.2 |
4.8 |
8.2 |
0.00 |
8.0 |
4.0 |
-113 |
|
West |
GC6214 |
63.4/-35.9 |
57.0 |
90.5 |
26.0 |
63.4 |
0.64 |
8.3 |
4.3 |
-147 |
|
West |
GC6214 |
63.4/-35.9 |
282.0 |
307.6 |
12.8 |
28.3 |
0.08 |
8.3 |
4.7 |
-273 |
|
West |
GC6221 |
63.4/-71.2 |
48.1 |
59.0 |
10.8 |
40.6 |
0.07 |
8.4 |
5.0 |
-148 |
|
West |
GC6221 |
63.4/-71.2 |
102.0 |
110.2 |
8.0 |
7.7 |
0.03 |
12.4 |
5.1 |
-202 |
|
West |
GC6221 |
63.4/-71.2 |
116.0 |
125.0 |
9.0 |
6.3 |
0.02 |
9.3 |
3.7 |
-215 |
|
West |
GC6223 |
10.5/-49.7 |
49.6 |
53.8 |
3.3 |
7.8 |
0.02 |
9.5 |
5.5 |
-140 |
|
West |
GC6223 |
10.5/-49.7 |
90.1 |
92.4 |
2.1 |
2.0 |
0.01 |
26.4 |
7.8 |
-167 |
|
West |
GC6223 |
10.5/-49.7 |
116.0 |
121.4 |
5.4 |
77.5 |
0.42 |
9.6 |
4.3 |
-189 |
|
West |
GC6226 |
243.4/-63.6 |
72.9 |
74.5 |
1.6 |
4.2 |
0.02 |
9.0 |
6.9 |
-162 |
|
West |
GC6226 |
243.4/-63.6 |
83.7 |
88.7 |
4.3 |
2.5 |
0.01 |
11.0 |
5.9 |
-175 |
|
West |
GC6226 |
243.4/-63.6 |
196.5 |
199.0 |
1.9 |
15.1 |
0.01 |
10.4 |
5.0 |
-274 |
|
West |
GC6228 |
243.4/-81.6 |
62.6 |
73.0 |
10.3 |
2.2 |
0.01 |
10.4 |
8.6 |
-255 |
|
West |
GC6228 |
243.4/-81.6 |
150.6 |
158.0 |
7.4 |
9.5 |
0.02 |
13.8 |
7.2 |
-170 |
|
West |
GC6232 |
95.6/-26.3 |
145.3 |
159.1 |
9.3 |
6.7 |
0.01 |
9.6 |
4.3 |
-166 |
|
West |
GC6232 |
95.6/-26.3 |
145.3 |
159.1 |
9.3 |
6.7 |
0.01 |
9.6 |
4.3 |
-166 |
|
West |
GC6233 |
63.4/-41.5 |
52.7 |
83.6 |
27.3 |
35.2 |
0.08 |
10.0 |
6.3 |
-140 |
|
West |
GC6233 |
63.4/-41.5 |
234.4 |
260.0 |
15.8 |
11.0 |
0.02 |
5.7 |
2.8 |
-269 |
|
9a |
GC6242 |
239.7/37 |
133.3 |
135.2 |
1.9 |
29.7 |
0.02 |
21.0 |
15.5 |
-8 |
|
9a |
GC6242 |
239.7/37 |
152.2 |
155.5 |
3.3 |
10.7 |
0.01 |
8.4 |
3.2 |
3 |
View source version on businesswire.com: https://www.businesswire.com/news/home/20240213785221/en/
Contacts
Anvita M. Patil
Vice President - Investor Relations and Treasurer
Cheryl Turner
Communications Coordinator
800-HECLA91 (800-432-5291)
Investor Relations
Email: hmc-info@hecla.com
Website: http://www.hecla.com


