
Railway infrastructure company L.B. Foster (NASDAQ: FSTR) met Wall Street’s revenue expectations in Q2 CY2025, with sales up 2% year on year to $143.6 million. The company’s full-year revenue guidance of $545 million at the midpoint came in 0.9% above analysts’ estimates. Its GAAP profit of $0.27 per share was 47.6% below analysts’ consensus estimates.
Is now the time to buy L.B. Foster? Find out by accessing our full research report, it’s free.
L.B. Foster (FSTR) Q2 CY2025 Highlights:
- Revenue: $143.6 million vs analyst estimates of $144.3 million (2% year-on-year growth, in line)
- EPS (GAAP): $0.27 vs analyst expectations of $0.52 (47.6% miss)
- Adjusted EBITDA: $12.23 million vs analyst estimates of $11.64 million (8.5% margin, 5.1% beat)
- The company dropped its revenue guidance for the full year to $545 million at the midpoint from $560 million, a 2.7% decrease
- EBITDA guidance for the full year is $42 million at the midpoint, above analyst estimates of $41.15 million
- Operating Margin: 5.3%, up from 3.2% in the same quarter last year
- Free Cash Flow was $7.73 million, up from -$7.01 million in the same quarter last year
- Backlog: $269.9 million at quarter end
- Market Capitalization: $233.1 million
John Kasel, President and Chief Executive Officer, commented, "In line with our expectations, we achieved a strong, broad recovery in our business in the second quarter, with 2.0% organic sales growth delivering 51.4% higher Adjusted EBITDA. The improved results in the quarter were realized primarily in our Infrastructure segment with organic sales up 22.4%, led by 36.0% higher Precast Concrete sales. Rail sales remained soft in the quarter, down 11.2% versus last year. However, Rail backlog increased 42.5% during the quarter and was up 13.9% over last year, which sets a solid foundation for expected robust sales growth in the 2025 second half. We also realized significant operating expense leverage in the quarter, with the SG&A percentage of sales of 15.6% improving 200 bps versus last year. We're very pleased with our team's accomplishments in the quarter and the improving track we're on."
Company Overview
Founded with a $2,500 loan, L.B. Foster (NASDAQ: FSTR) is a provider of products and services for the transportation and energy infrastructure sectors, including rail products, construction materials, and coating solutions.
Revenue Growth
Reviewing a company’s long-term sales performance reveals insights into its quality. Even a bad business can shine for one or two quarters, but a top-tier one grows for years. L.B. Foster struggled to consistently generate demand over the last five years as its sales dropped at a 1.6% annual rate. This wasn’t a great result and is a sign of poor business quality.
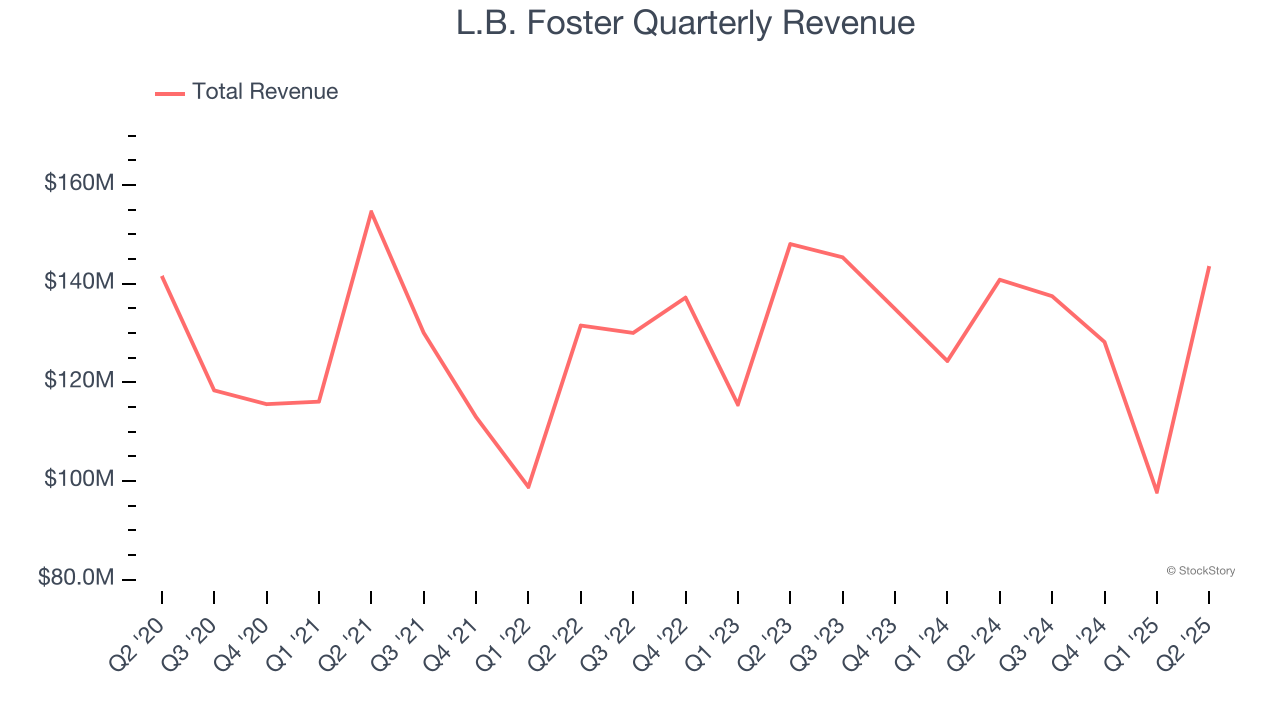
Long-term growth is the most important, but within industrials, a half-decade historical view may miss new industry trends or demand cycles. L.B. Foster’s annualized revenue declines of 2.3% over the last two years align with its five-year trend, suggesting its demand has consistently shrunk. 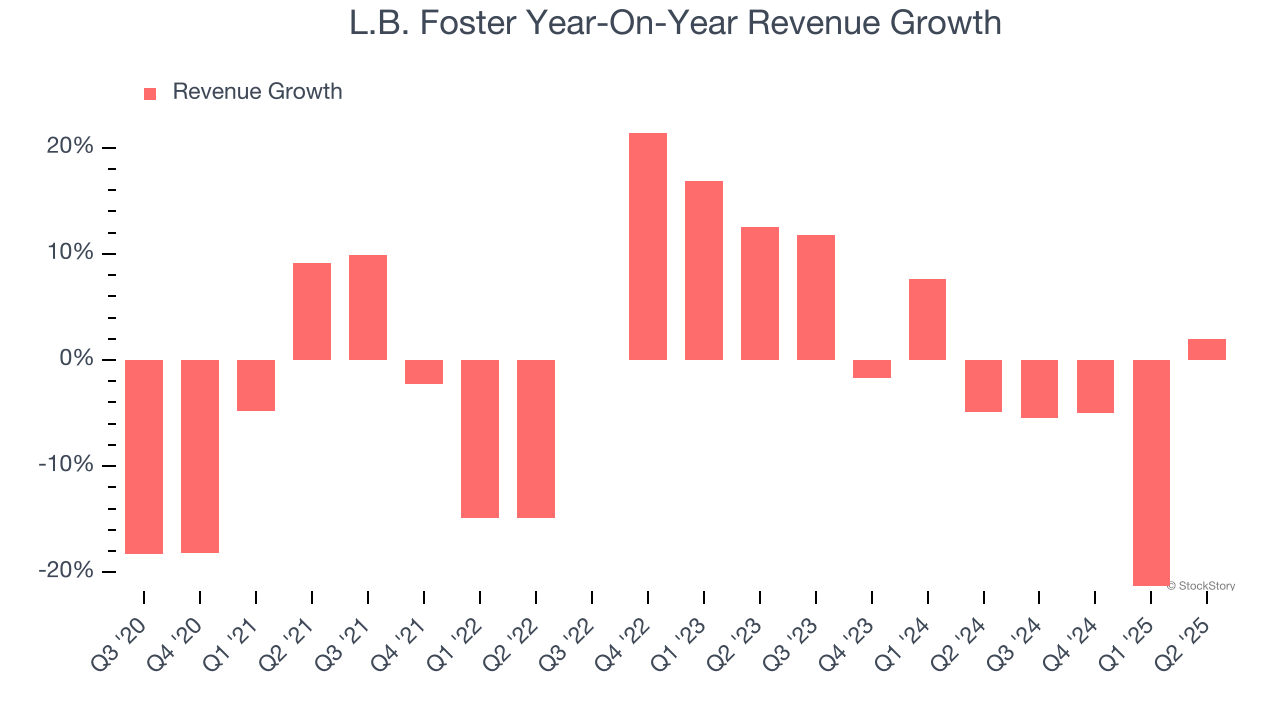
This quarter, L.B. Foster grew its revenue by 2% year on year, and its $143.6 million of revenue was in line with Wall Street’s estimates.
Looking ahead, sell-side analysts expect revenue to grow 10.5% over the next 12 months, an improvement versus the last two years. This projection is healthy and indicates its newer products and services will spur better top-line performance.
Unless you’ve been living under a rock, it should be obvious by now that generative AI is going to have a huge impact on how large corporations do business. While Nvidia and AMD are trading close to all-time highs, we prefer a lesser-known (but still profitable) stock benefiting from the rise of AI. Click here to access our free report one of our favorites growth stories.
Operating Margin
Operating margin is an important measure of profitability as it shows the portion of revenue left after accounting for all core expenses – everything from the cost of goods sold to advertising and wages. It’s also useful for comparing profitability across companies with different levels of debt and tax rates because it excludes interest and taxes.
L.B. Foster was profitable over the last five years but held back by its large cost base. Its average operating margin of 2% was weak for an industrials business. This result isn’t too surprising given its low gross margin as a starting point.
On the plus side, L.B. Foster’s operating margin rose by 1.4 percentage points over the last five years.
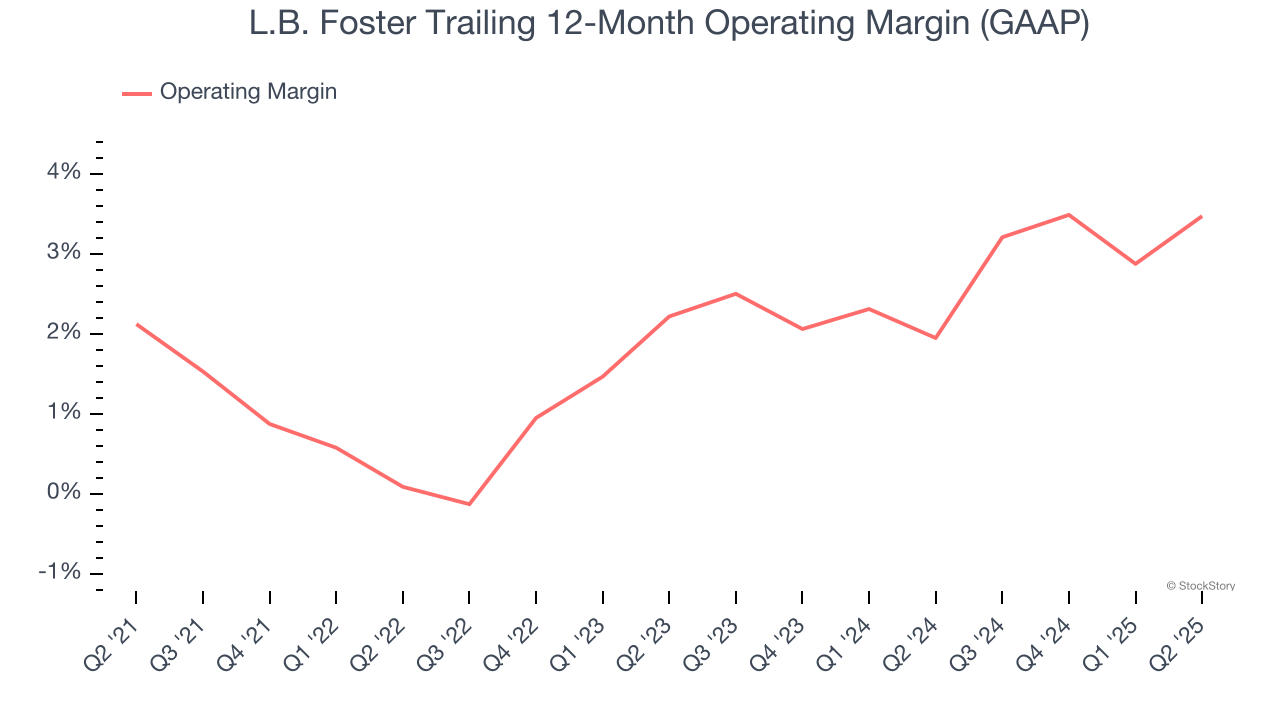
This quarter, L.B. Foster generated an operating margin profit margin of 5.3%, up 2.1 percentage points year on year. The increase was encouraging, and because its operating margin rose more than its gross margin, we can infer it was more efficient with expenses such as marketing, R&D, and administrative overhead.
Earnings Per Share
Revenue trends explain a company’s historical growth, but the long-term change in earnings per share (EPS) points to the profitability of that growth – for example, a company could inflate its sales through excessive spending on advertising and promotions.
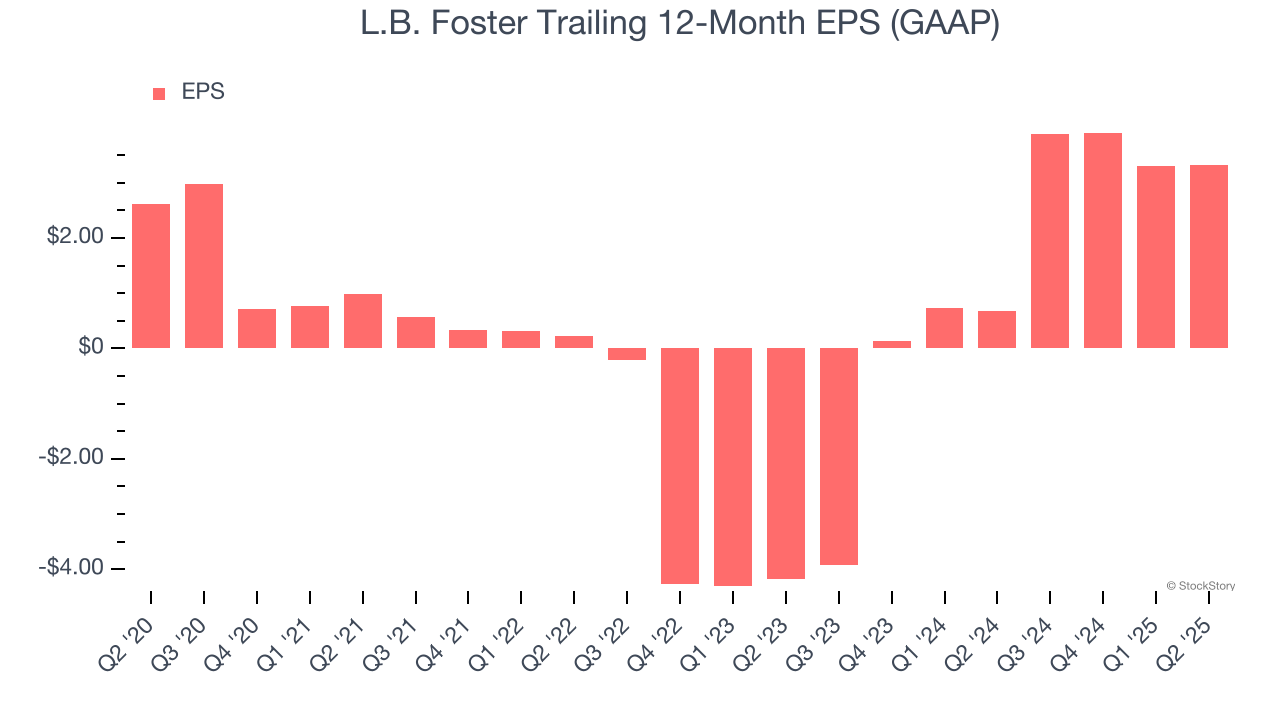
L.B. Foster’s EPS grew at an unimpressive 4.9% compounded annual growth rate over the last five years. On the bright side, this performance was better than its 1.6% annualized revenue declines and tells us management adapted its cost structure in response to a challenging demand environment.
Diving into the nuances of L.B. Foster’s earnings can give us a better understanding of its performance. As we mentioned earlier, L.B. Foster’s operating margin expanded by 1.4 percentage points over the last five years. This was the most relevant factor (aside from the revenue impact) behind its higher earnings; interest expenses and taxes can also affect EPS but don’t tell us as much about a company’s fundamentals.
Like with revenue, we analyze EPS over a shorter period to see if we are missing a change in the business.
For L.B. Foster, its two-year annual EPS growth of 67.2% was higher than its five-year trend. This acceleration made it one of the faster-growing industrials companies in recent history.
In Q2, L.B. Foster reported EPS at $0.27, up from $0.26 in the same quarter last year. Despite growing year on year, this print missed analysts’ estimates. Over the next 12 months, Wall Street expects L.B. Foster’s full-year EPS of $3.32 to shrink by 37.8%.
Key Takeaways from L.B. Foster’s Q2 Results
It was great to see L.B. Foster’s full-year EBITDA guidance top analysts’ expectations. We were also glad its EBITDA outperformed Wall Street’s estimates. On the other hand, its EPS missed and its revenue was in line with Wall Street’s estimates. Overall, this print was mixed but still had some key positives. The stock traded up 2% to $22.52 immediately after reporting.
Big picture, is L.B. Foster a buy here and now? When making that decision, it’s important to consider its valuation, business qualities, as well as what has happened in the latest quarter. We cover that in our actionable full research report which you can read here, it’s free.