
Media broadcasting company Sinclair (NASDAQ: SBGI) met Wall Street’s revenue expectations in Q4 CY2025, but sales fell by 16.7% year on year to $836 million. On the other hand, the company’s full-year revenue guidance of $3.47 billion at the midpoint came in 0.8% below analysts’ estimates. Its GAAP profit of $1.55 per share was significantly above analysts’ consensus estimates.
Is now the time to buy Sinclair? Find out by accessing our full research report, it’s free.
Sinclair (SBGI) Q4 CY2025 Highlights:
- Revenue: $836 million vs analyst estimates of $839.7 million (16.7% year-on-year decline, in line)
- EPS (GAAP): $1.55 vs analyst estimates of -$0.25 (significant beat)
- Adjusted EBITDA: $168 million vs analyst estimates of $148.4 million (20.1% margin, 13.2% beat)
- Operating Margin: 9.6%, down from 26.5% in the same quarter last year
- Market Capitalization: $979.8 million
Company Overview
With over 2,400 hours of local news produced weekly and 640 broadcast channels reaching millions of American homes, Sinclair (NASDAQ: SBGI) operates a network of 185 local television stations across 86 U.S. markets, producing news programming and distributing content from major networks.
Revenue Growth
A company’s long-term sales performance is one signal of its overall quality. Any business can experience short-term success, but top-performing ones enjoy sustained growth for years.
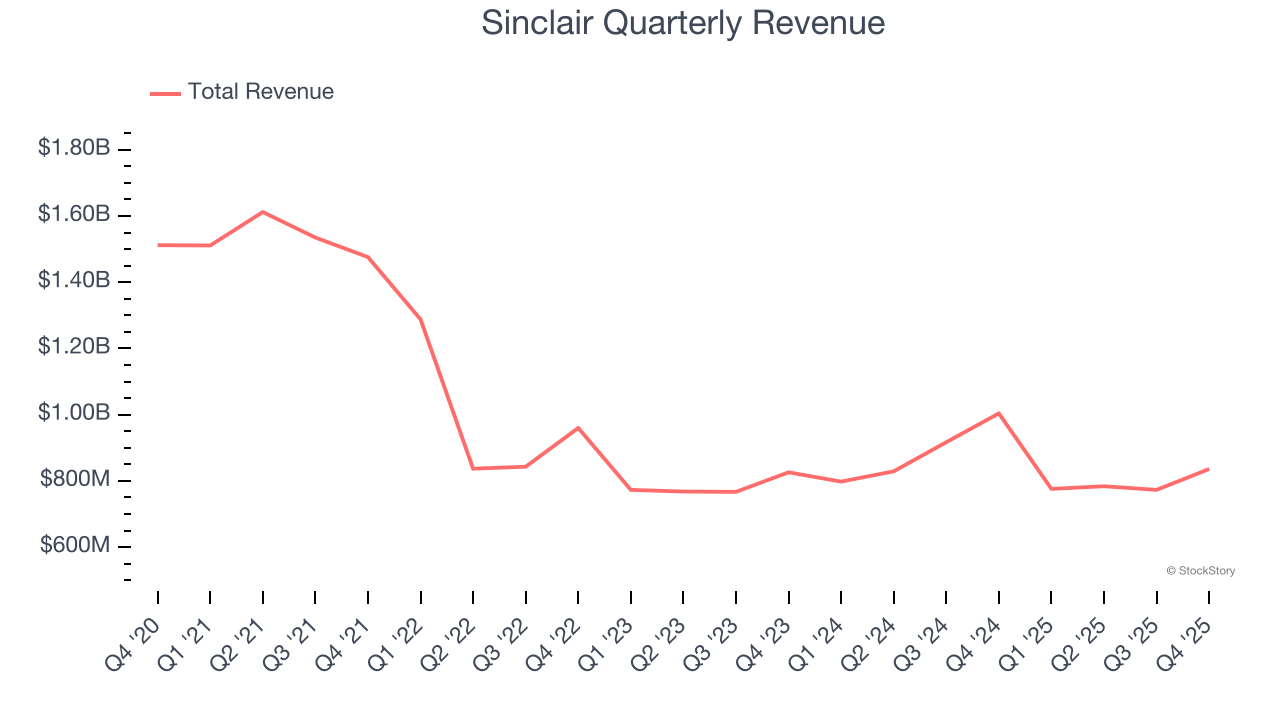
With $3.17 billion in revenue over the past 12 months, Sinclair is a mid-sized business services company, which sometimes brings disadvantages compared to larger competitors benefiting from better economies of scale.
As you can see below, Sinclair’s revenue declined by 11.8% per year over the last five years, a rough starting point for our analysis.
Long-term growth is the most important, but within business services, a half-decade historical view may miss new innovations or demand cycles. Sinclair’s revenue over the last two years was flat, sugggesting its demand was weak but stabilized after its initial drop. 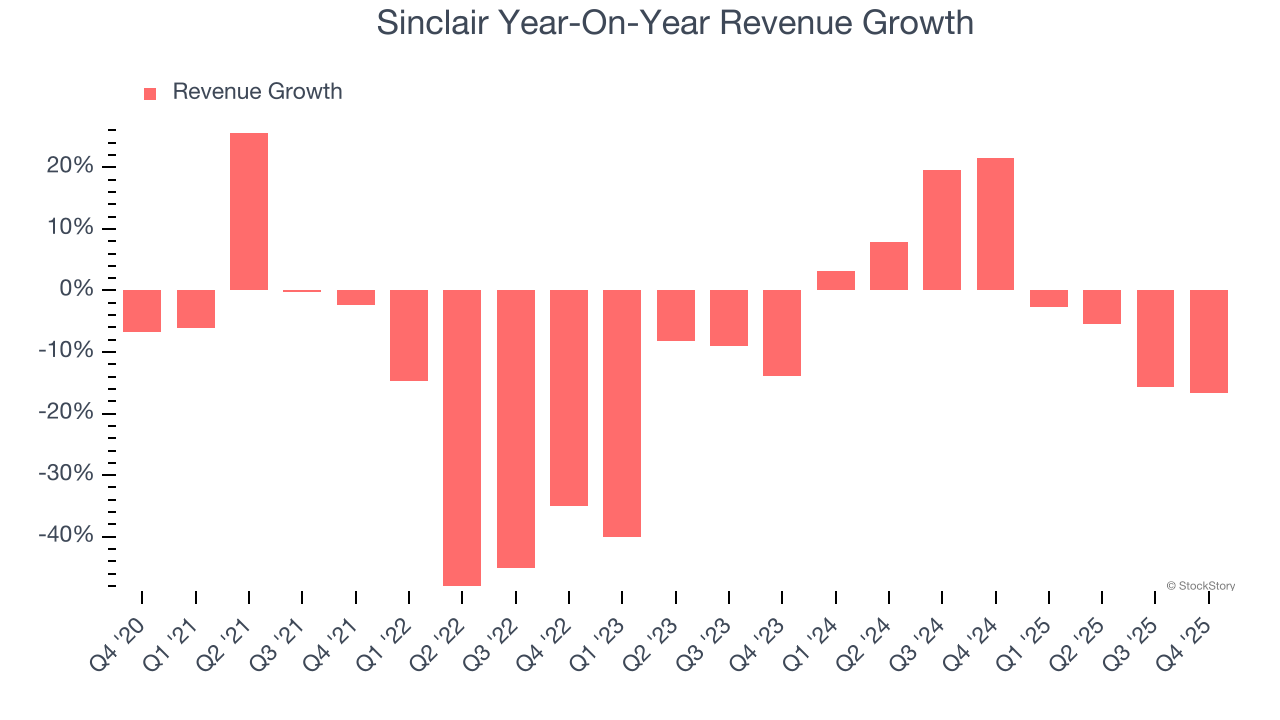
Sinclair also breaks out the revenue for its most important segments, Distribution and Advertising, which are 100% and 52.4% of revenue. Over the last two years, Sinclair’s Distribution revenue (content distribution) averaged 21.1% year-on-year growth while its Advertising revenue (advertising sales) averaged 7.8% growth. 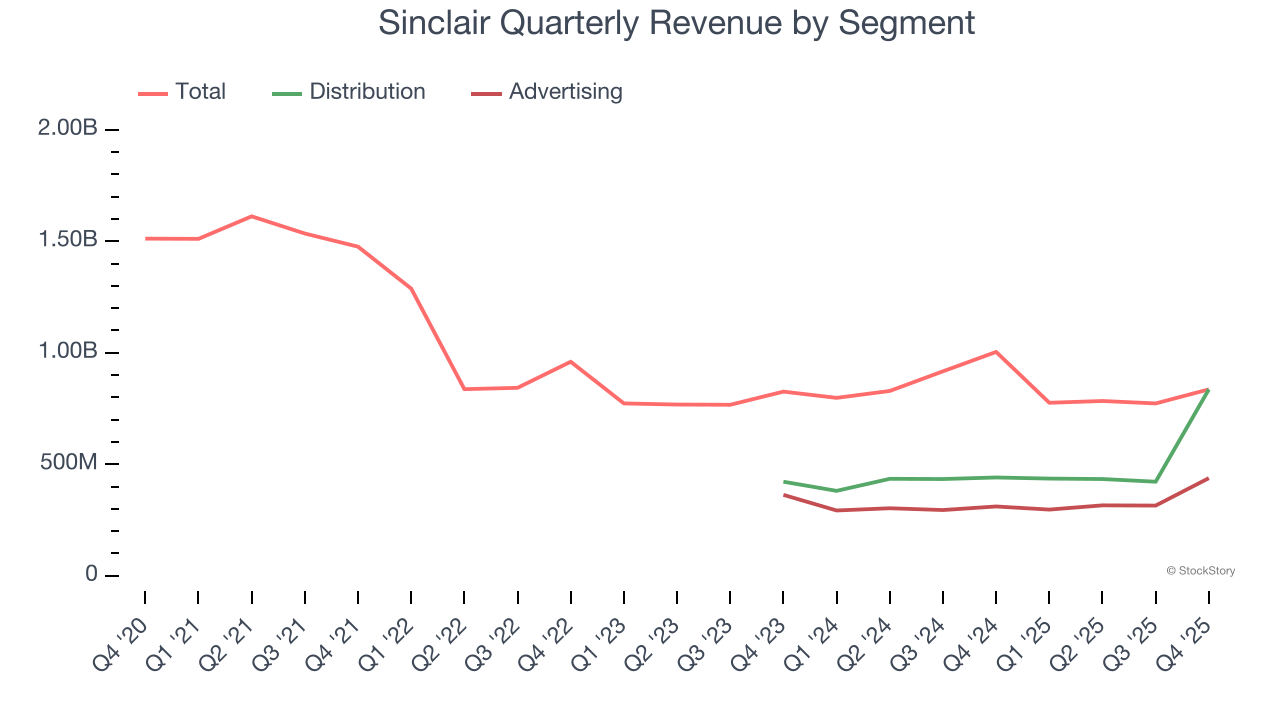
This quarter, Sinclair reported a rather uninspiring 16.7% year-on-year revenue decline to $836 million of revenue, in line with Wall Street’s estimates.
Looking ahead, sell-side analysts expect revenue to grow 11.1% over the next 12 months, an improvement versus the last two years. This projection is healthy and suggests its newer products and services will catalyze better top-line performance.
While Wall Street chases Nvidia at all-time highs, an under-the-radar semiconductor supplier is dominating a critical AI component these giants can’t build without. Click here to access our free report one of our favorites growth stories.
Operating Margin
Operating margin is one of the best measures of profitability because it tells us how much money a company takes home after subtracting all core expenses, like marketing and R&D.
Sinclair has been a well-oiled machine over the last five years. It demonstrated elite profitability for a business services business, boasting an average operating margin of 22.4%.
Looking at the trend in its profitability, Sinclair’s operating margin rose by 3.9 percentage points over the last five years, showing its efficiency has improved.
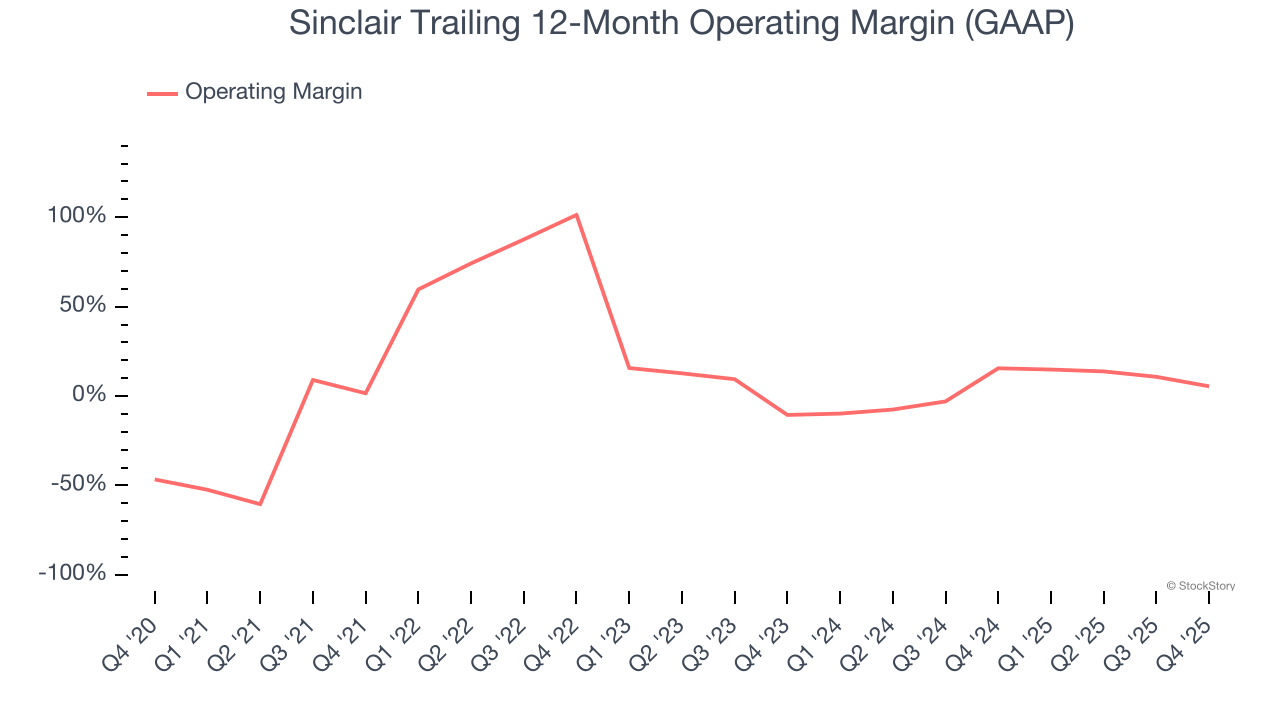
This quarter, Sinclair generated an operating margin profit margin of 9.6%, down 16.9 percentage points year on year. This contraction shows it was less efficient because its expenses increased relative to its revenue.
Earnings Per Share
We track the long-term change in earnings per share (EPS) for the same reason as long-term revenue growth. Compared to revenue, however, EPS highlights whether a company’s growth is profitable.
Although Sinclair’s full-year earnings are still negative, it reduced its losses and improved its EPS by 44.7% annually over the last five years. The next few quarters will be critical for assessing its long-term profitability.
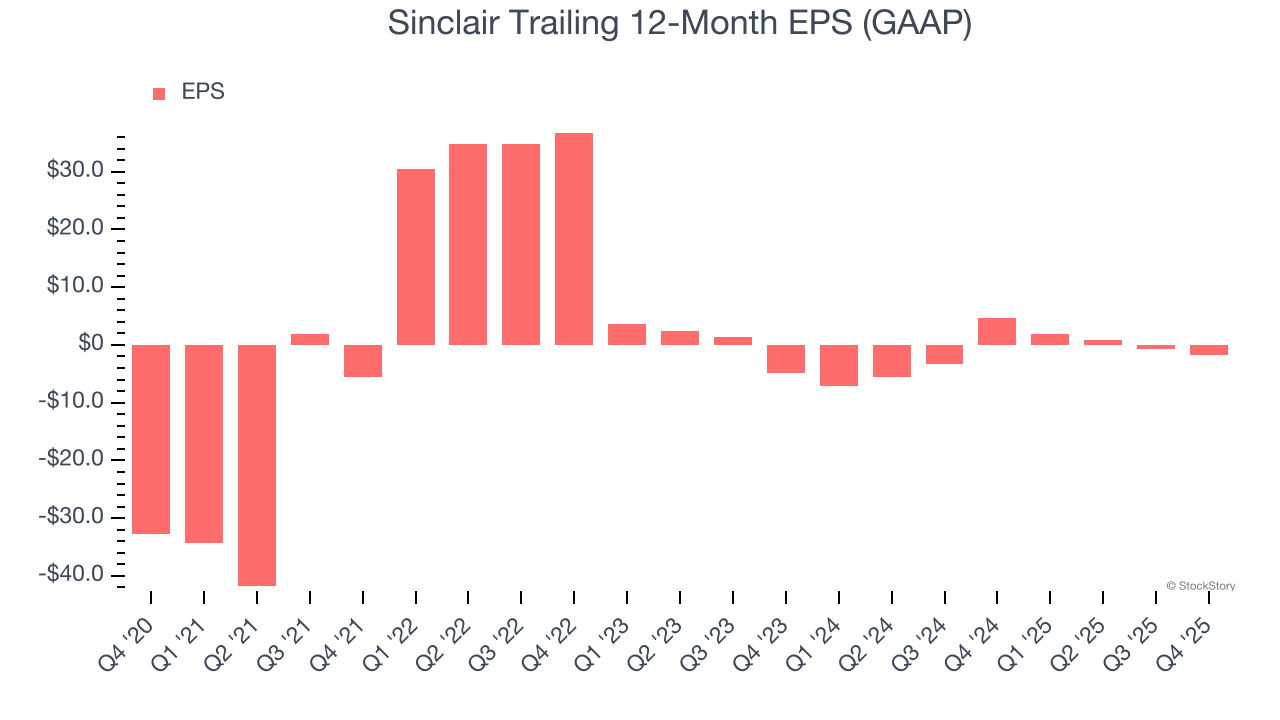
Like with revenue, we analyze EPS over a more recent period because it can provide insight into an emerging theme or development for the business.
For Sinclair, its two-year annual EPS growth of 40.8% was lower than its five-year trend. We still think its growth was good and hope it can accelerate in the future.
In Q4, Sinclair reported EPS of $1.55, down from $2.62 in the same quarter last year. Despite falling year on year, this print easily cleared analysts’ estimates. Over the next 12 months, Wall Street is optimistic. Analysts forecast Sinclair’s full-year EPS of negative $1.70 will flip to positive $0.59.
Key Takeaways from Sinclair’s Q4 Results
It was good to see Sinclair beat analysts’ EPS expectations this quarter. On the other hand, its full-year revenue guidance slightly missed and its revenue was in line with Wall Street’s estimates. Overall, this print was mixed but still had some key positives. The stock remained flat at $13.81 immediately after reporting.
Is Sinclair an attractive investment opportunity at the current price? What happened in the latest quarter matters, but not as much as longer-term business quality and valuation, when deciding whether to invest in this stock. We cover that in our actionable full research report which you can read here (it’s free).