Vertically integrated manufacturing solutions provider Mayville Engineering Company (NYSE: MEC) met Wall Street’s revenue expectations in Q4 CY2025, with sales up 10.7% year on year to $134.3 million. On the other hand, next quarter’s revenue guidance of $140 million was less impressive, coming in 2.5% below analysts’ estimates. Its non-GAAP loss of $0.08 per share was in line with analysts’ consensus estimates.
Is now the time to buy Mayville Engineering? Find out by accessing our full research report, it’s free.
Mayville Engineering (MEC) Q4 CY2025 Highlights:
- Revenue: $134.3 million vs analyst estimates of $134.1 million (10.7% year-on-year growth, in line)
- Adjusted EPS: -$0.08 vs analyst estimates of -$0.07 (in line)
- Adjusted EBITDA: $6.31 million vs analyst estimates of $11.1 million (4.7% margin, 43.1% miss)
- Revenue Guidance for Q1 CY2026 is $140 million at the midpoint, below analyst estimates of $143.6 million
- EBITDA guidance for the upcoming financial year 2026 is $55 million at the midpoint, below analyst estimates of $66.57 million
- Operating Margin: -4.1%, down from 19% in the same quarter last year
- Free Cash Flow Margin: 7.6%, down from 29.4% in the same quarter last year
- Market Capitalization: $437.7 million
“We closed fiscal 2025 with strong momentum within our Data Center & Critical Power end market, securing $15 million of incremental project awards during the fourth quarter, strengthening our 2026 orderbook,” said Jag Reddy, President and Chief Executive Officer.
Company Overview
Originally founded solely on tool and die manufacturing, Mayville Engineering Company (NYSE: MEC) specializes in metal fabrication, tube bending, and welding to be used in various industries.
Revenue Growth
Examining a company’s long-term performance can provide clues about its quality. Any business can put up a good quarter or two, but many enduring ones grow for years. Luckily, Mayville Engineering’s sales grew at a decent 8.9% compounded annual growth rate over the last five years. Its growth was slightly above the average industrials company and shows its offerings resonate with customers.
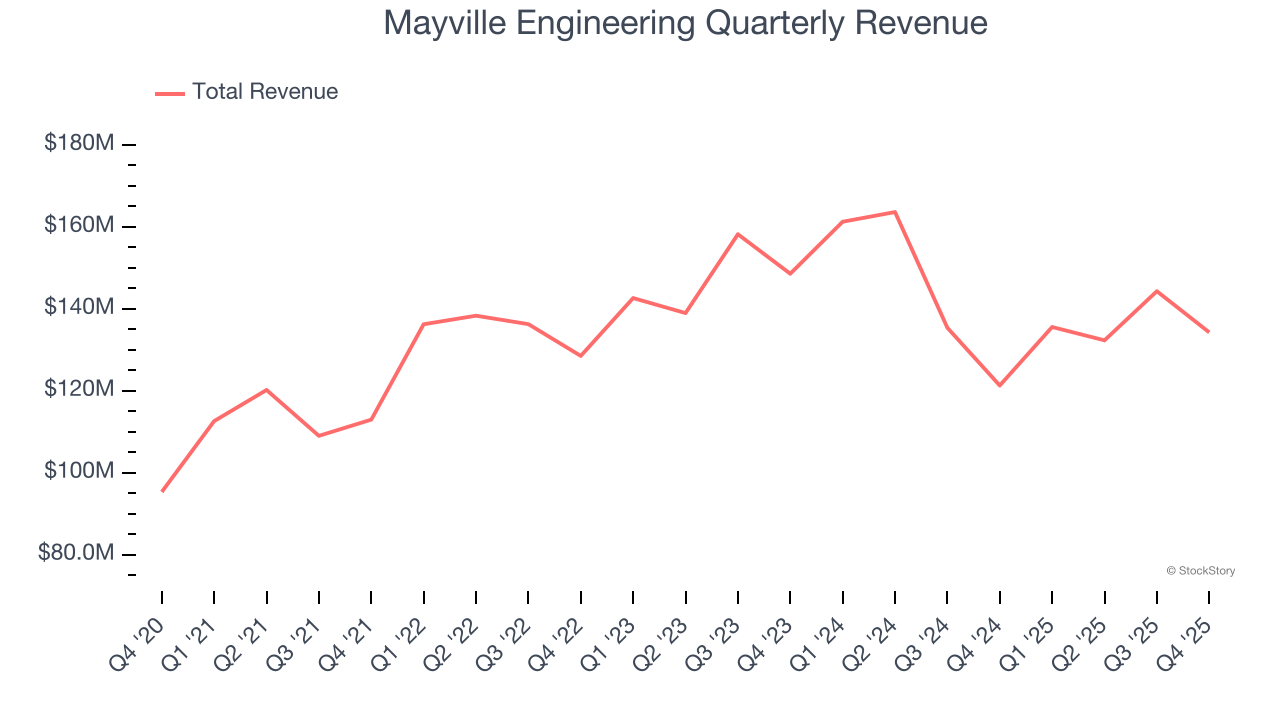
We at StockStory place the most emphasis on long-term growth, but within industrials, a half-decade historical view may miss cycles, industry trends, or a company capitalizing on catalysts such as a new contract win or a successful product line. Mayville Engineering’s recent performance marks a sharp pivot from its five-year trend as its revenue has shown annualized declines of 3.6% over the last two years. 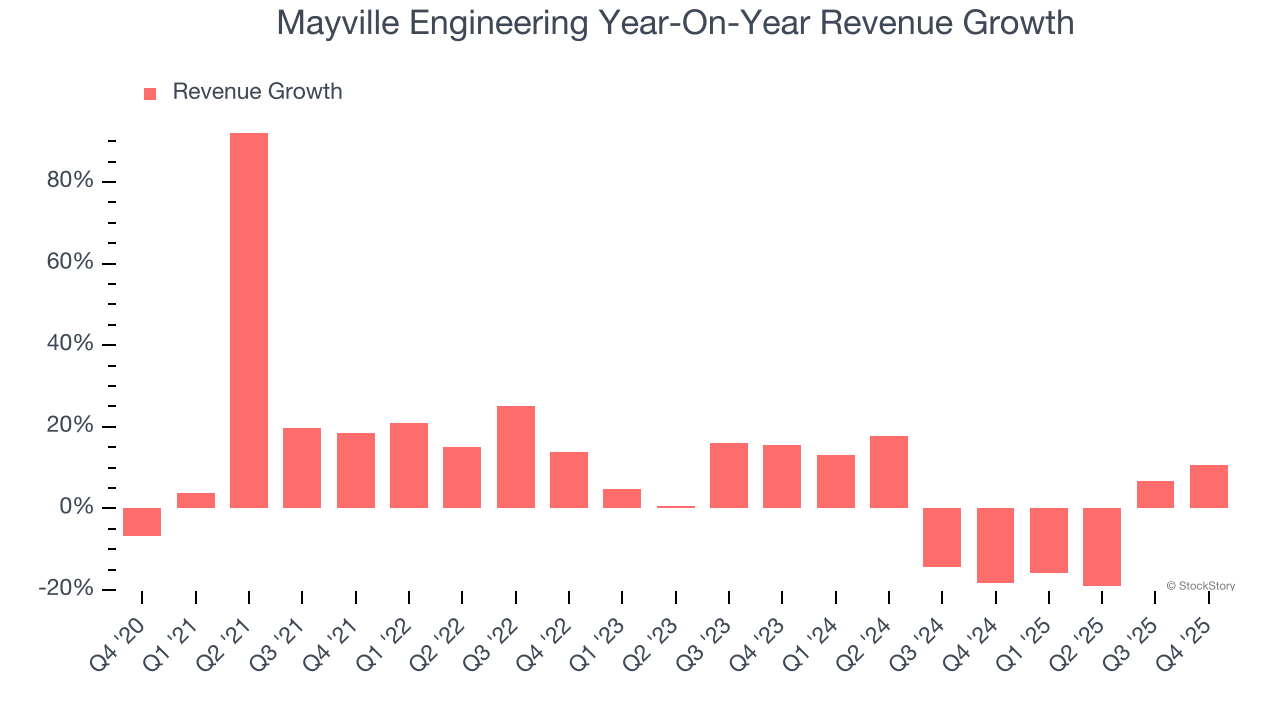
Mayville Engineering also breaks out the revenue for its most important segments, Commercial Vehicle and Construction & Access, which are 28.6% and 14.3% of revenue. Over the last two years, Mayville Engineering’s Commercial Vehicle revenue (exhaust, engine components, fuel systems) averaged 17.5% year-on-year declines while its Construction & Access revenue (fenders, hoods, frames for heavy machinery) averaged 13.7% declines. 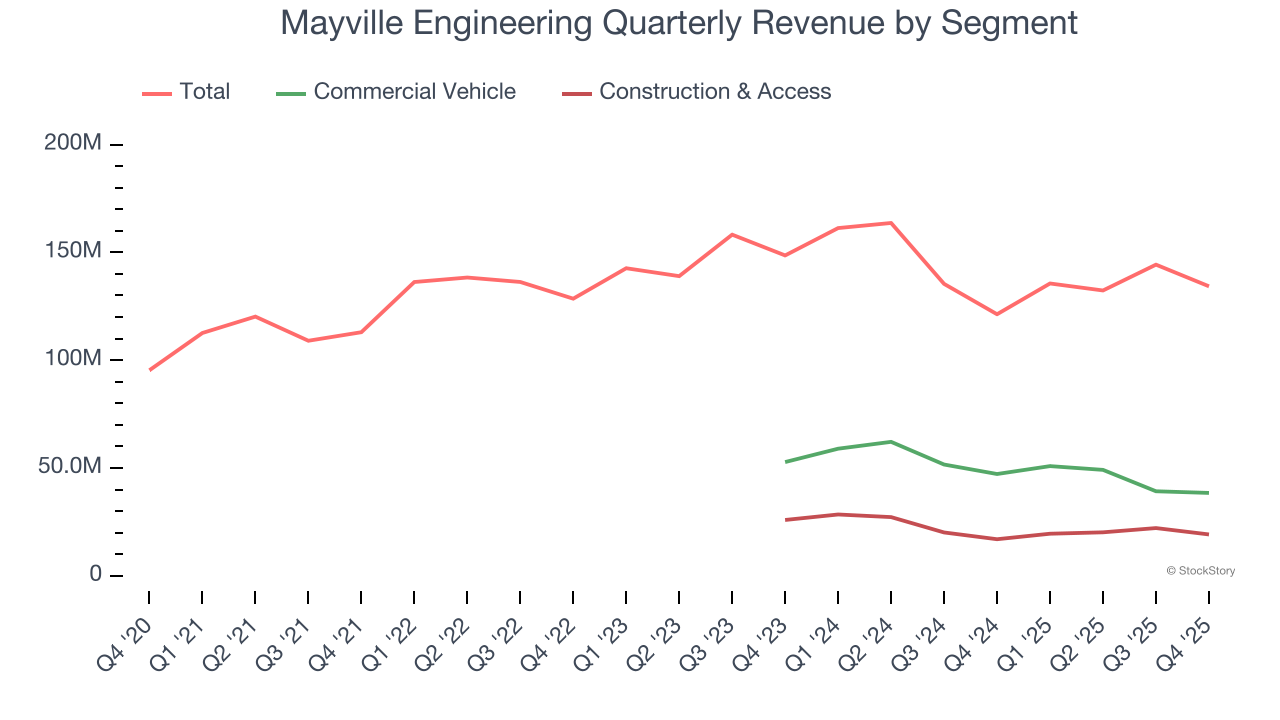
This quarter, Mayville Engineering’s year-on-year revenue growth was 10.7%, and its $134.3 million of revenue was in line with Wall Street’s estimates. Company management is currently guiding for a 3.3% year-on-year increase in sales next quarter.
Looking further ahead, sell-side analysts expect revenue to grow 10.4% over the next 12 months, an improvement versus the last two years. This projection is admirable and indicates its newer products and services will spur better top-line performance.
WHILE YOU’RE HERE: The Next Palantir? One satellite company captures images of every point on Earth. Every single day. The Pentagon wants it. Hedge funds are using it to beat earnings. You’ve probably never heard of it.
This is what the early days of Palantir looked like before it became a $437 billion giant. Same playbook. Different technology. If you missed Palantir, you need to see this. Claim The Stock Ticker for Free HERE.
Operating Margin
Mayville Engineering’s operating margin has generally stayed the same over the last 12 months, averaging 2.9% over the last five years. This profitability was lousy for an industrials business and caused by its suboptimal cost structureand low gross margin.
Looking at the trend in its profitability, Mayville Engineering’s operating margin might fluctuated slightly but has generally stayed the same over the last five years. This raises questions about the company’s expense base because its revenue growth should have given it leverage on its fixed costs, resulting in better economies of scale and profitability.
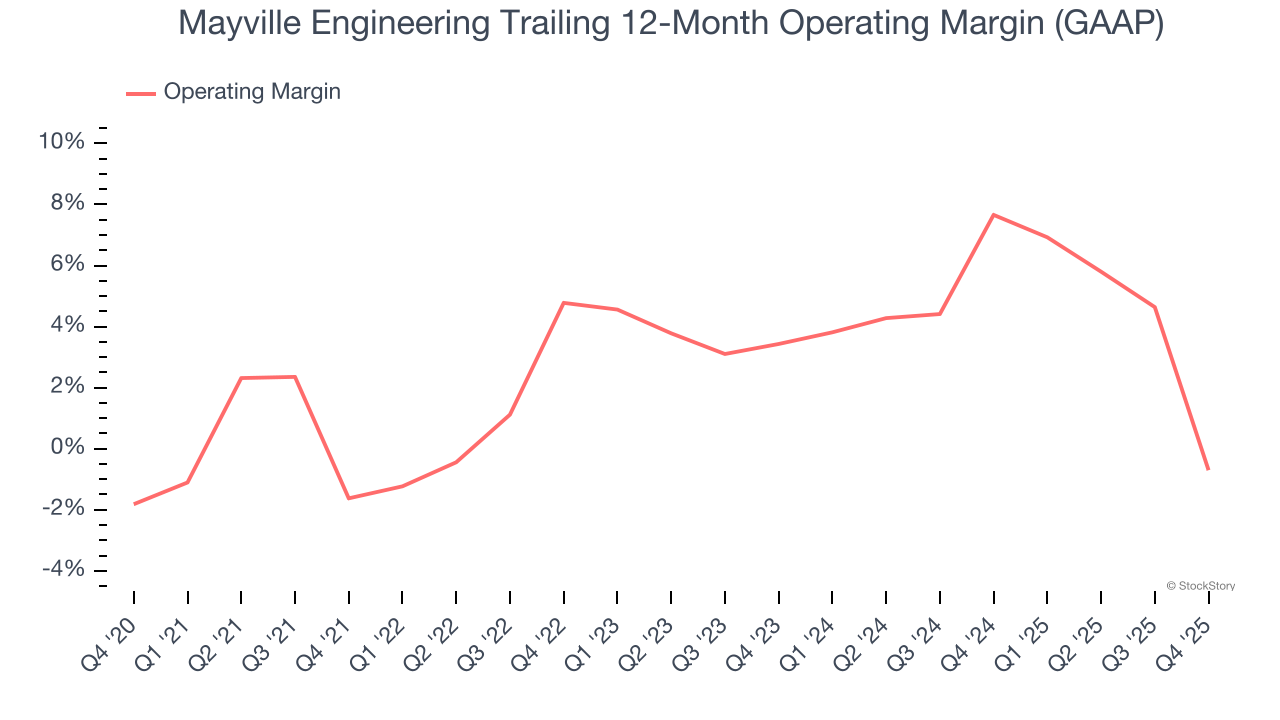
In Q4, Mayville Engineering generated an operating margin profit margin of negative 4.1%, down 23.1 percentage points year on year. Since Mayville Engineering’s operating margin decreased more than its gross margin, we can assume it was less efficient because expenses such as marketing, R&D, and administrative overhead increased.
Earnings Per Share
We track the long-term change in earnings per share (EPS) for the same reason as long-term revenue growth. Compared to revenue, however, EPS highlights whether a company’s growth is profitable.
Mayville Engineering’s full-year EPS flipped from negative to positive over the last five years. This is encouraging and shows it’s at a critical moment in its life.
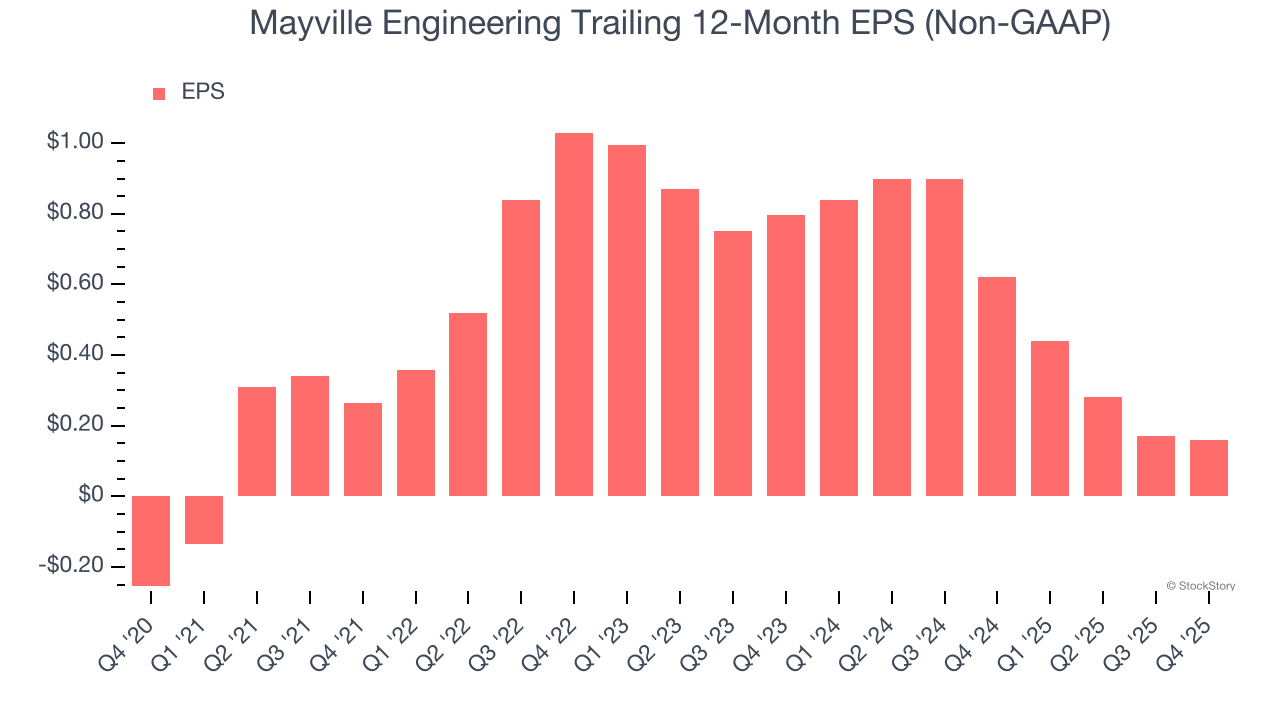
Like with revenue, we analyze EPS over a shorter period to see if we are missing a change in the business.
Sadly for Mayville Engineering, its EPS declined by more than its revenue over the last two years, dropping 55.2%. This tells us the company struggled to adjust to shrinking demand.
We can take a deeper look into Mayville Engineering’s earnings to better understand the drivers of its performance. Mayville Engineering’s operating margin has declined over the last two years. This was the most relevant factor (aside from the revenue impact) behind its lower earnings; interest expenses and taxes can also affect EPS but don’t tell us as much about a company’s fundamentals.
In Q4, Mayville Engineering reported adjusted EPS of negative $0.08, down from negative $0.07 in the same quarter last year. This print missed analysts’ estimates, but we care more about long-term adjusted EPS growth than short-term movements. Over the next 12 months, Wall Street expects Mayville Engineering’s full-year EPS of $0.16 to grow 163%.
Key Takeaways from Mayville Engineering’s Q4 Results
We struggled to find many positives in these results. Its full-year EBITDA guidance missed and its EBITDA fell short of Wall Street’s estimates. Overall, this was a softer quarter. The stock traded down 2.9% to $20.49 immediately after reporting.
Mayville Engineering’s latest earnings report disappointed. One quarter doesn’t define a company’s quality, so let’s explore whether the stock is a buy at the current price. If you’re making that decision, you should consider the bigger picture of valuation, business qualities, as well as the latest earnings. We cover that in our actionable full research report which you can read here (it’s free).