Homebuilder D.R. Horton (NYSE: DHI) fell short of the market’s revenue expectations in Q1 CY2026, with sales falling 2.3% year on year to $7.56 billion. On the other hand, the company’s full-year revenue guidance of $34 billion at the midpoint came in 1.1% above analysts’ estimates. Its GAAP profit of $2.24 per share was 4.7% above analysts’ consensus estimates.
Is now the time to buy D.R. Horton? Find out by accessing our full research report, it’s free.
D.R. Horton (DHI) Q1 CY2026 Highlights:
- Revenue: $7.56 billion vs analyst estimates of $7.61 billion (2.3% year-on-year decline, 0.7% miss)
- EPS (GAAP): $2.24 vs analyst estimates of $2.14 (4.7% beat)
- Adjusted EBITDA: $862.7 million vs analyst estimates of $885.4 million (11.4% margin, 2.6% miss)
- The company dropped its revenue guidance for the full year to $34 billion at the midpoint from $34.25 billion, a 0.7% decrease
- Operating Margin: 10.6%, down from 12.9% in the same quarter last year
- Free Cash Flow was -$449.7 million compared to -$470.5 million in the same quarter last year
- Backlog: $6.42 billion at quarter end, up 16.8% year on year
- Market Capitalization: $44.42 billion
David Auld, Executive Chairman, said: “The D.R. Horton team delivered a solid second quarter, highlighted by a pre-tax profit margin of 11.5%, above the high end of our guidance range."
Company Overview
One of the largest homebuilding companies in the U.S., D.R. Horton (NYSE: DHI) builds a variety of new construction homes across multiple markets.
Revenue Growth
Reviewing a company’s long-term sales performance reveals insights into its quality. Even a bad business can shine for one or two quarters, but a top-tier one grows for years. Unfortunately, D.R. Horton’s 6.6% annualized revenue growth over the last five years was mediocre. This fell short of our benchmark for the industrials sector and is a rough starting point for our analysis.
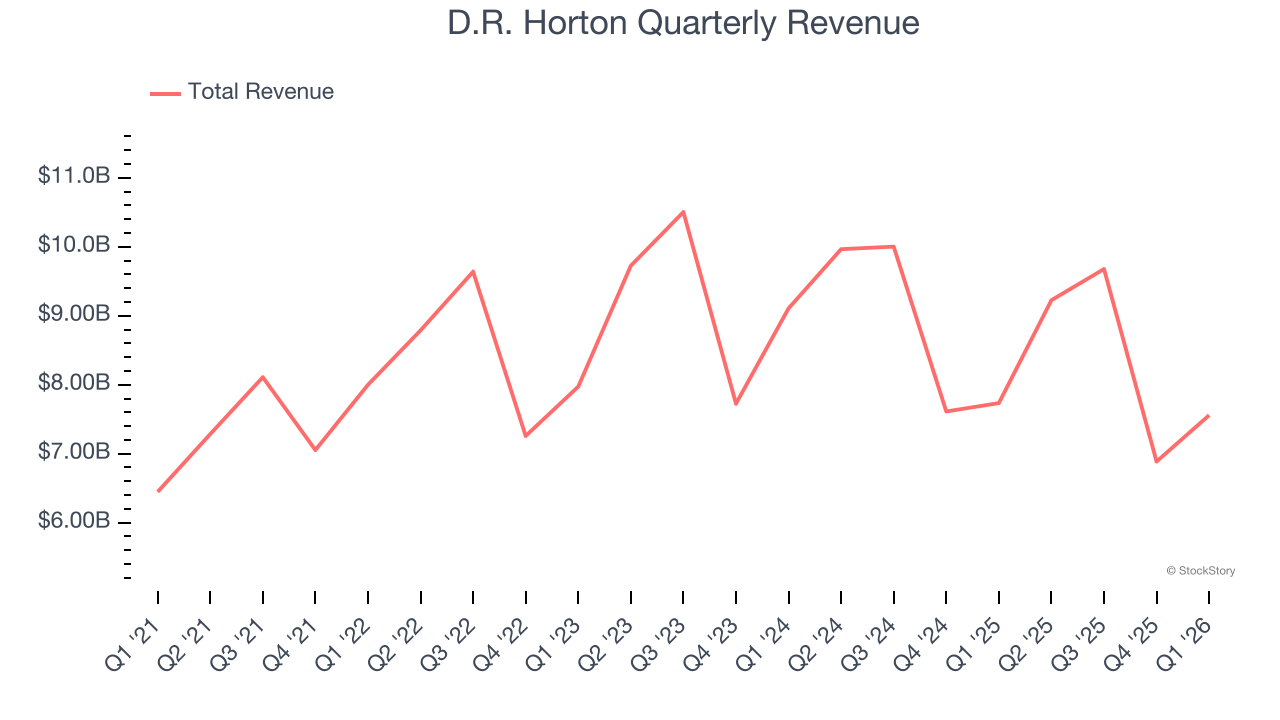
Long-term growth is the most important, but within industrials, a half-decade historical view may miss new industry trends or demand cycles. D.R. Horton’s performance shows it grew in the past but relinquished its gains over the last two years, as its revenue fell by 5.1% annually. 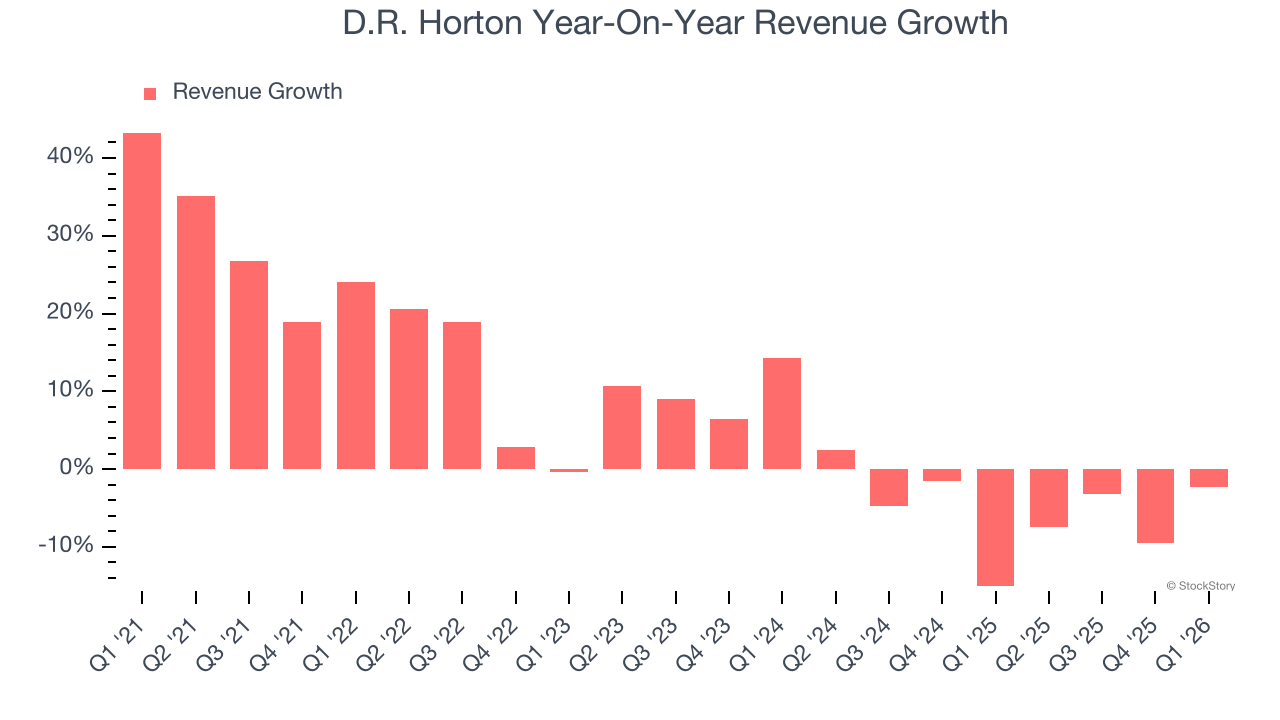
We can better understand the company’s revenue dynamics by analyzing its backlog, or the value of its outstanding orders that have not yet been executed or delivered. D.R. Horton’s backlog reached $6.42 billion in the latest quarter and averaged 7.6% year-on-year declines over the last two years. Because this number is lower than its revenue growth, we can see the company hasn’t secured enough new orders to maintain its growth rate in the future. 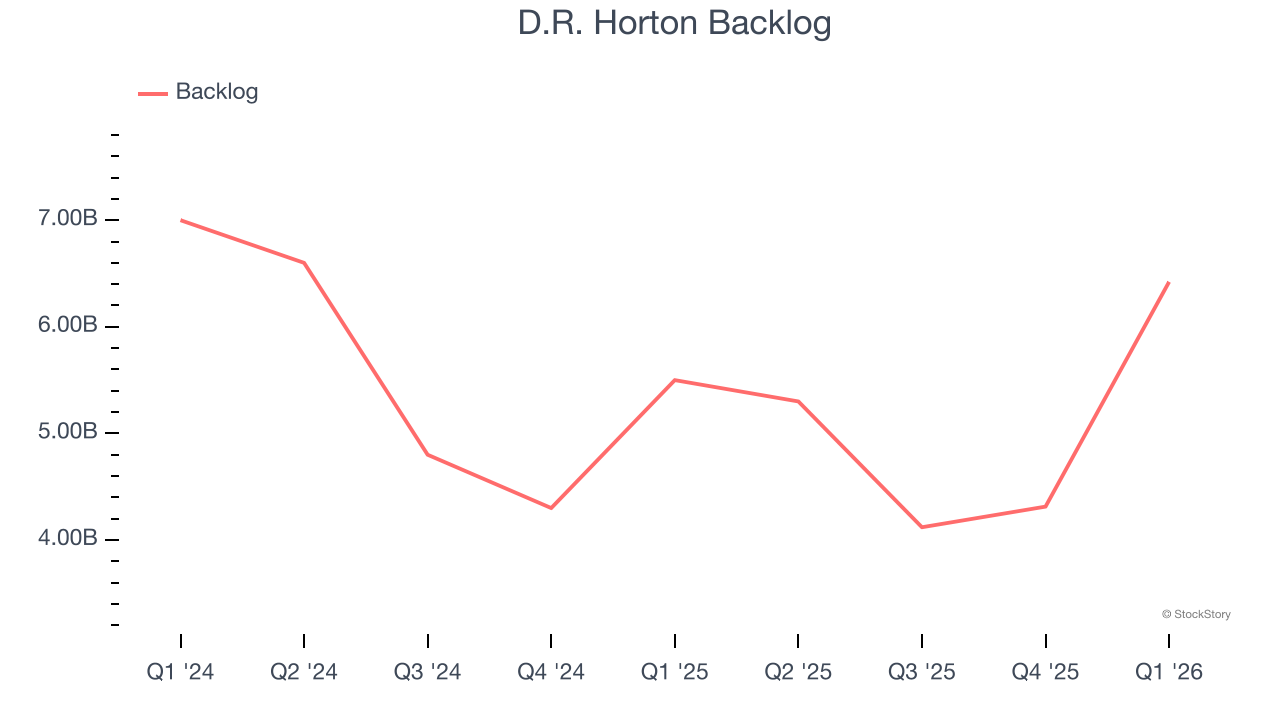
This quarter, D.R. Horton missed Wall Street’s estimates and reported a rather uninspiring 2.3% year-on-year revenue decline, generating $7.56 billion of revenue.
Looking ahead, sell-side analysts expect revenue to grow 2.2% over the next 12 months. Although this projection indicates its newer products and services will catalyze better top-line performance, it is still below the sector average.
WHILE YOU’RE HERE: The Next Palantir? One satellite company captures images of every point on Earth. Every single day. The Pentagon wants it. Hedge funds are using it to beat earnings. You’ve probably never heard of it.
This is what the early days of Palantir looked like before it became a $437 billion giant. Same playbook. Different technology. If you missed Palantir, you need to see this. Claim The Stock Ticker for Free HERE.
Operating Margin
D.R. Horton has been a well-oiled machine over the last five years. It demonstrated elite profitability for an industrials business, boasting an average operating margin of 16.9%. This result was particularly impressive because of its low gross margin, which is mostly a factor of what it sells and takes huge shifts to move meaningfully. Companies have more control over their operating margins, and it’s a show of well-managed operations if they’re high when gross margins are low.
Analyzing the trend in its profitability, D.R. Horton’s operating margin decreased by 9.5 percentage points over the last five years. This raises questions about the company’s expense base because its revenue growth should have given it leverage on its fixed costs, resulting in better economies of scale and profitability.
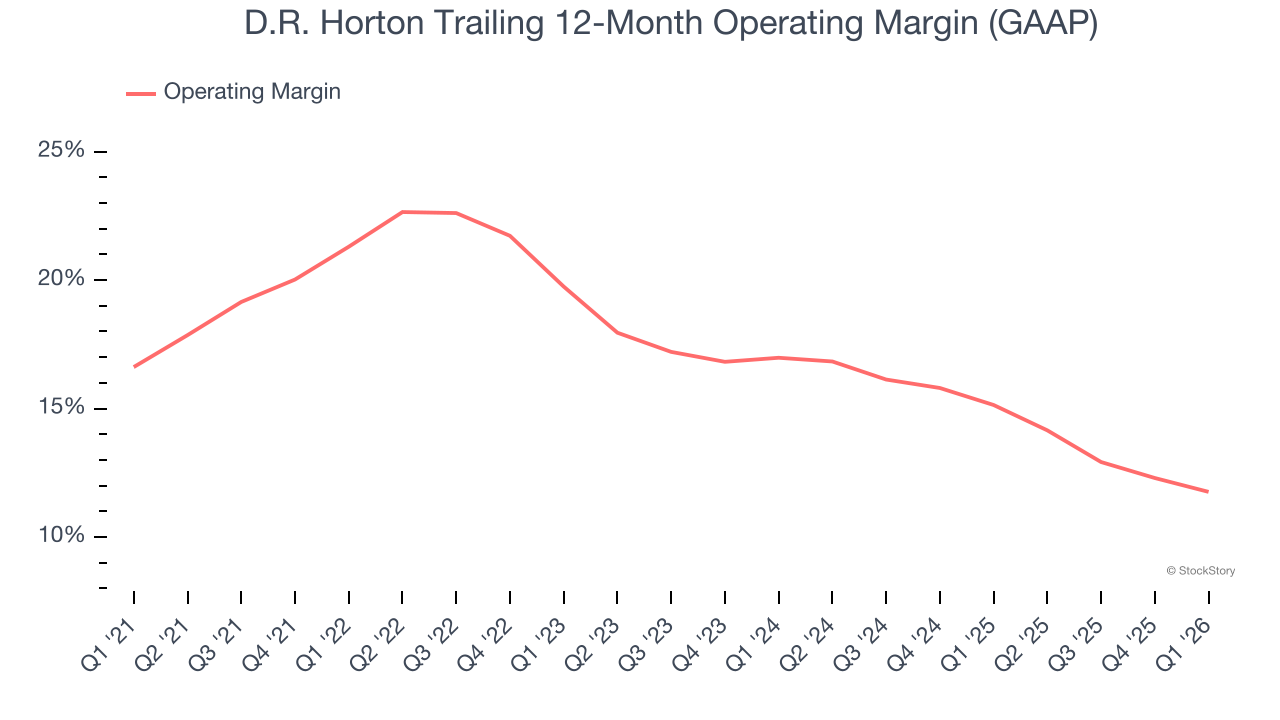
This quarter, D.R. Horton generated an operating margin profit margin of 10.6%, down 2.4 percentage points year on year. Since D.R. Horton’s operating margin decreased more than its gross margin, we can assume it was less efficient because expenses such as marketing, R&D, and administrative overhead increased.
Earnings Per Share
Revenue trends explain a company’s historical growth, but the long-term change in earnings per share (EPS) points to the profitability of that growth – for example, a company could inflate its sales through excessive spending on advertising and promotions.
D.R. Horton’s EPS grew at an unimpressive 4.3% compounded annual growth rate over the last five years, lower than its 6.6% annualized revenue growth. This tells us the company became less profitable on a per-share basis as it expanded due to non-fundamental factors such as interest expenses and taxes.
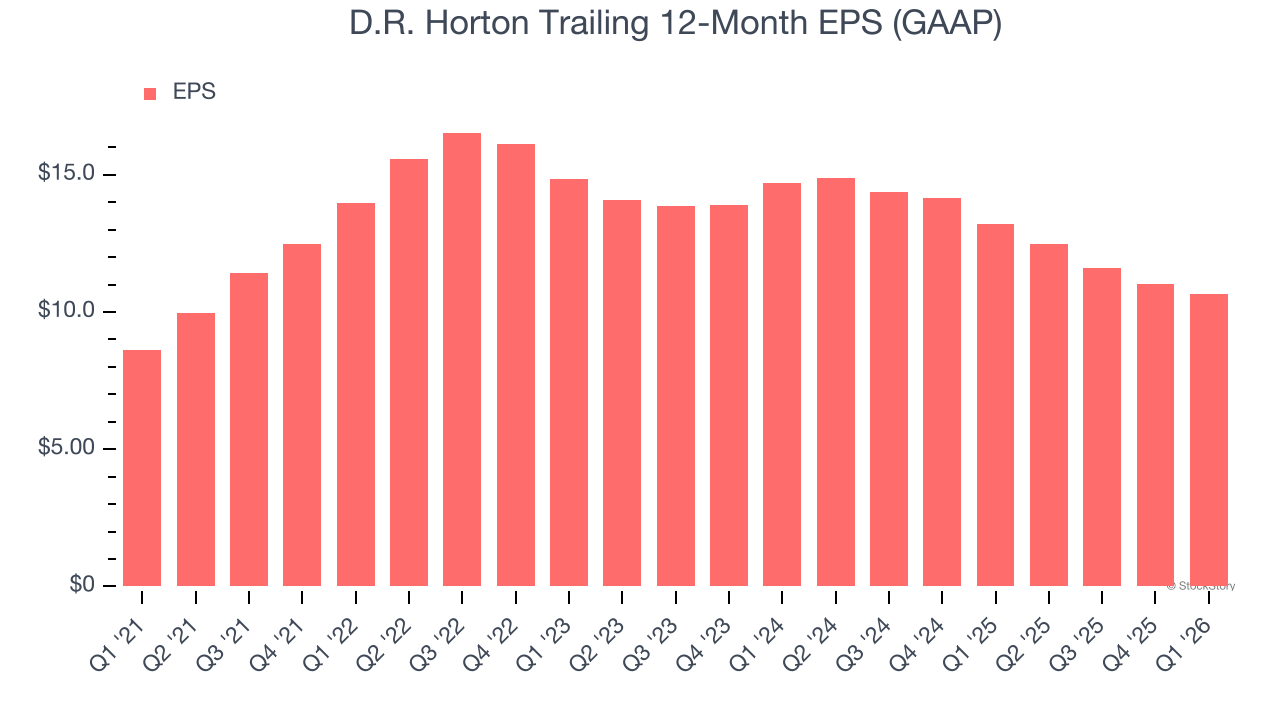
We can take a deeper look into D.R. Horton’s earnings to better understand the drivers of its performance. As we mentioned earlier, D.R. Horton’s operating margin declined by 9.5 percentage points over the last five years. This was the most relevant factor (aside from the revenue impact) behind its lower earnings; interest expenses and taxes can also affect EPS but don’t tell us as much about a company’s fundamentals.
Like with revenue, we analyze EPS over a shorter period to see if we are missing a change in the business.
For D.R. Horton, its two-year annual EPS declines of 14.8% show it’s continued to underperform. These results were bad no matter how you slice the data.
In Q1, D.R. Horton reported EPS of $2.24, down from $2.58 in the same quarter last year. Despite falling year on year, this print beat analysts’ estimates by 4.7%. Over the next 12 months, Wall Street expects D.R. Horton’s full-year EPS of $10.67 to shrink by 1.1%.
Key Takeaways from D.R. Horton’s Q1 Results
We were impressed by how significantly D.R. Horton blew past analysts’ adjusted operating income expectations this quarter. We were also glad its full-year revenue guidance slightly exceeded Wall Street’s estimates. On the other hand, its EBITDA missed and its revenue fell slightly short of Wall Street’s estimates. Overall, this print was mixed but still had some key positives. The stock traded up 2.5% to $157.21 immediately after reporting.
So do we think D.R. Horton is an attractive buy at the current price? What happened in the latest quarter matters, but not as much as longer-term business quality and valuation, when deciding whether to invest in this stock. We cover that in our actionable full research report which you can read here (it’s free).