

Oilfield services company Halliburton (NYSE: HAL) reported Q1 CY2026 results topping the market’s revenue expectations, but sales were flat year on year at $5.40 billion. Its non-GAAP profit of $0.55 per share was 10.6% above analysts’ consensus estimates.
Is now the time to buy Halliburton? Find out by accessing our full research report, it’s free.
Halliburton (HAL) Q1 CY2026 Highlights:
- Revenue: $5.40 billion vs analyst estimates of $5.3 billion (flat year on year, 1.9% beat)
- Adjusted EPS: $0.55 vs analyst estimates of $0.50 (10.6% beat)
- Adjusted EBITDA: $974 million vs analyst estimates of $944.7 million (18% margin, 3.1% beat)
- Operating Margin: 12.6%, up from 8% in the same quarter last year
- Free Cash Flow Margin: 2.3%, similar to the same quarter last year
- Market Capitalization: $30.63 billion
Company Overview
Behind nearly every oil and gas well drilled worldwide, Halliburton (NYSE: HAL) provides drilling, completion, and production services that help oil and gas companies extract hydrocarbons from underground reservoirs.
Revenue Growth
A company’s long-term performance can give signals about its business quality. Even a bad business, especially in a cyclical industry, can shine for a year or so, but a top-tier one should exhibit resilience through cycles. Over the last five years, Halliburton grew its sales at a decent 11.5% compounded annual growth rate. Its growth was slightly above the average energy upstream and integrated energy company and shows its offerings resonate with customers.
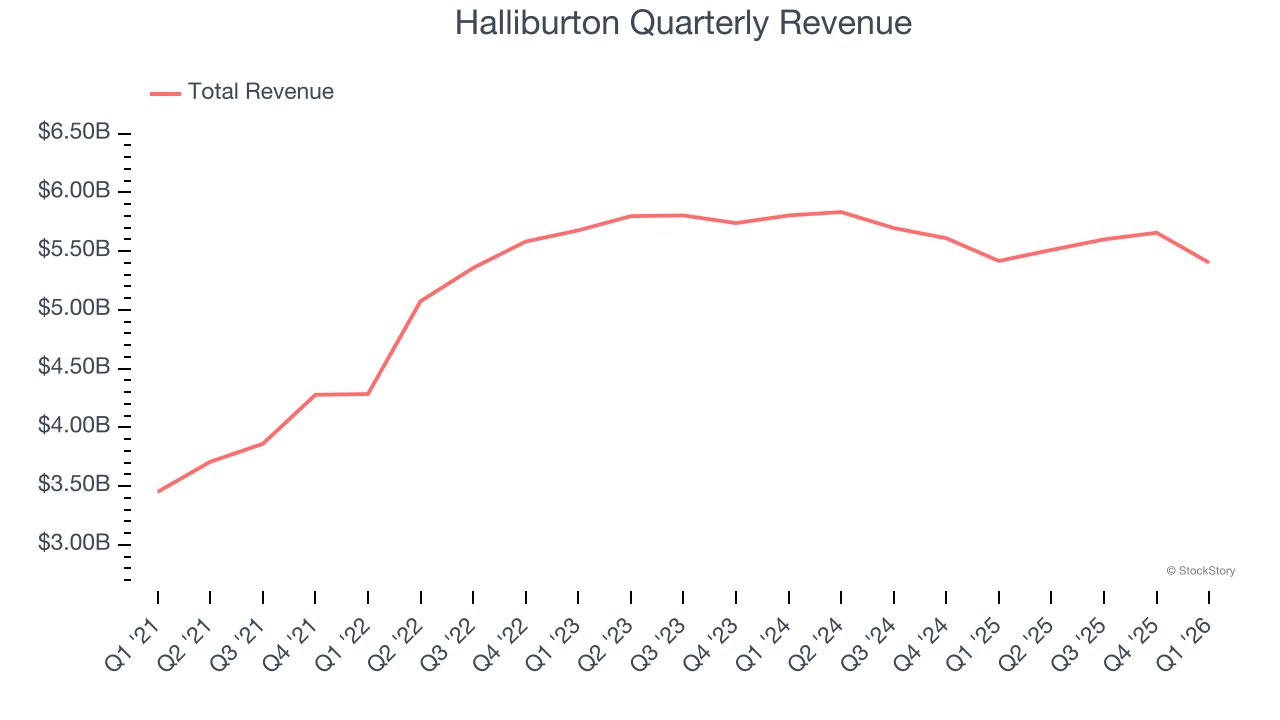
Energy cycles can be long enough that a single five-year period can still reflect one price environment, which is why an additional, decade-long view can help capture through-cycle performance. Halliburton’s annualized revenue growth of 0.6% over the last ten years is below its five-year trend, but we still think the results were respectable.
This quarter, Halliburton’s $5.40 billion of revenue was flat year on year but beat Wall Street’s estimates by 1.9%.
WHILE YOU’RE HERE: The Next Palantir? One satellite company captures images of every point on Earth. Every single day. The Pentagon wants it. Hedge funds are using it to beat earnings. You’ve probably never heard of it.
This is what the early days of Palantir looked like before it became a $437 billion giant. Same playbook. Different technology. If you missed Palantir, you need to see this. Claim The Stock Ticker for Free HERE.
Adjusted EBITDA Margin
Halliburton was profitable over the last five years but held back by its large cost base. Its average EBITDA margin of 20.3% was weak for an upstream and integrated energy business.
Looking at the trend in its profitability, Halliburton’s EBITDA margin might fluctuated slightly but has generally stayed the same over the last year, which doesn’t help its cause.
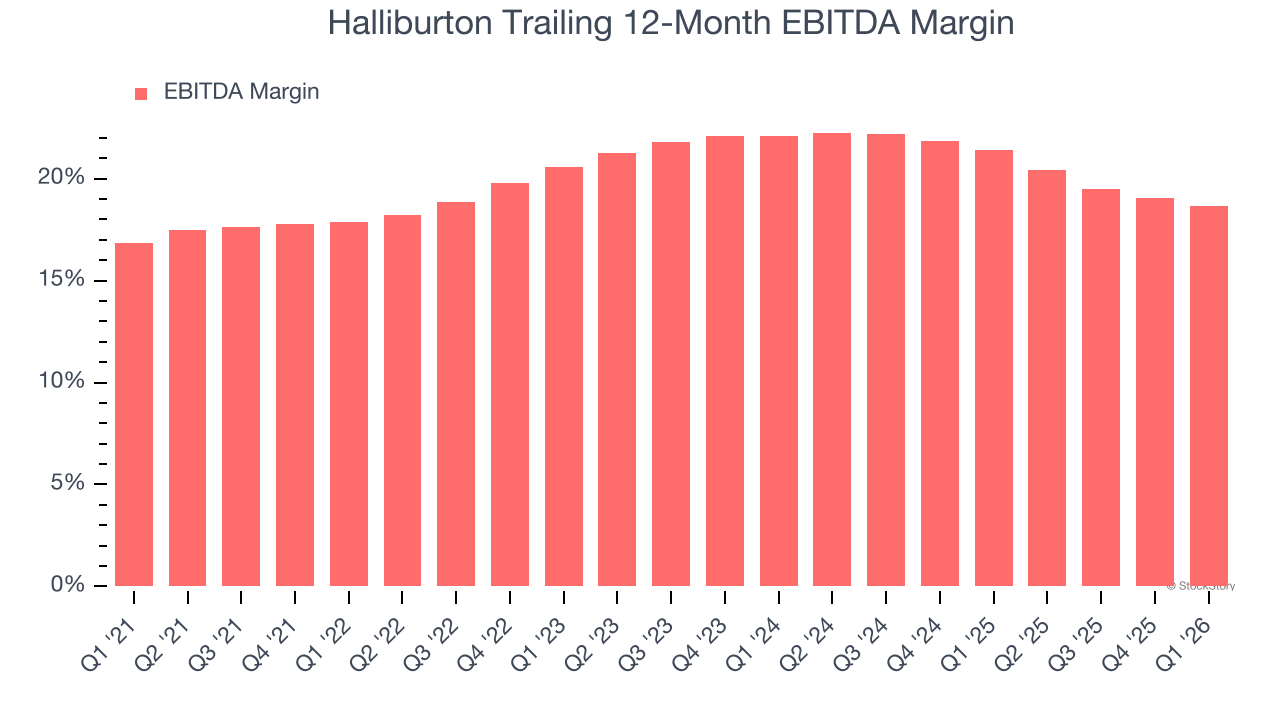
In Q1, Halliburton generated an EBITDA margin profit margin of 18%, down 1.6 percentage points year on year. This reduction is quite minuscule and indicates the company’s overall cost structure has been relatively stable. This adjusted EBITDA beat Wall Street’s estimates by 3.1%.
Cash Is King
Adjusted EBITDA shows how profitable a company’s existing “rock” is before financing and reinvestment, while free cash flow shows how much value remains after paying to replace those wells. Because production declines over time, strong EBITDA can coexist with weak FCF if drilling is expensive or declines are steep. FCF therefore captures both operating efficiency and the cost of sustaining production.
Halliburton has shown decent cash profitability, giving it some flexibility to reinvest or return capital to investors. The company’s free cash flow margin averaged 8.1% over the last five years, slightly better than the broader energy upstream and integrated energy sector.
Absolute FCF margin levels matter but so does stability of free cash flow. All else equal, we’d prefer a 25.0% average free cash flow margin that is quite steady no matter how commodity prices behave rather than extremely high margins when times are good and negative ones when they’re tough.
Halliburton’s ratio of quarterly free cash flow volatility to WTI crude price volatility over the past five years was 5.6 (lower is better), indicating excellent insulation from commodity swings. This stability supports capital access in downturns and positions Halliburton to act as a consolidator when weaker peers are forced to retrench.
You may be asking why we wait until the free cash flow line to perform this stability analysis versus commodity prices. Why not compare revenue or EBITDA to WTI in the case of Halliburton? Because what ultimately matters is not how much revenue or profit you earn when prices are high but how much cash you can generate when prices are low. Free cash flow is the superior metric because it includes everything from hedging prowess to growth and maintenance capex to management behavior during good times and bad.
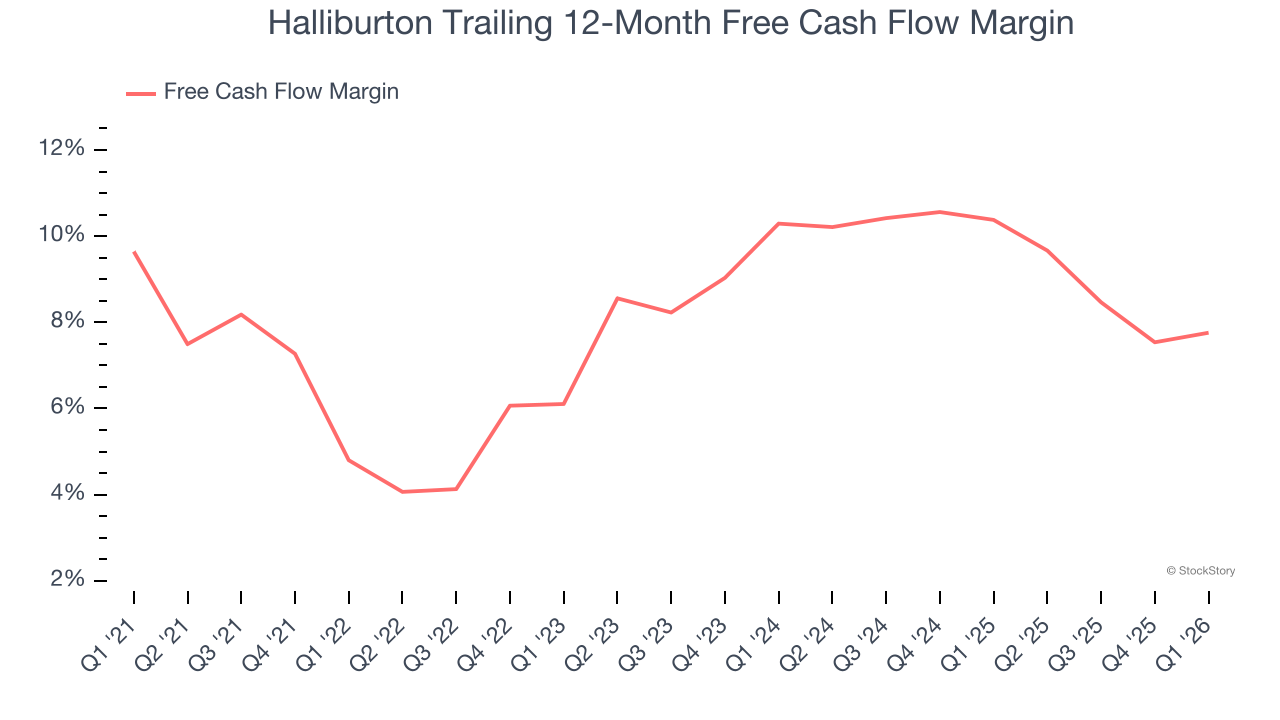
Halliburton’s free cash flow clocked in at $123 million in Q1, equivalent to a 2.3% margin. This cash profitability was in line with the comparable period last year but below its five-year average. In a silo, this isn’t a big deal because investment needs can be seasonal, but we’ll be watching to see if the trend extrapolates into future quarters.
Key Takeaways from Halliburton’s Q1 Results
It was good to see Halliburton beat analysts’ EPS expectations this quarter. We were also happy its revenue outperformed Wall Street’s estimates. Overall, we think this was a decent quarter with some key metrics above expectations. The stock traded up 1.7% to $37.29 immediately following the results.
Halliburton may have had a good quarter, but does that mean you should invest right now? The latest quarter does matter, but not nearly as much as longer-term fundamentals and valuation, when deciding if the stock is a buy. We cover that in our actionable full research report which you can read here (it’s free).


