

Commercial lighting and retail display solutions provider LSI (NASDAQ: LYTS) reported revenue ahead of Wall Street’s expectations in Q1 CY2026, with sales up 13.6% year on year to $150.5 million. Its non-GAAP profit of $0.28 per share was 33.3% above analysts’ consensus estimates.
Is now the time to buy LSI? Find out by accessing our full research report, it’s free.
LSI (LYTS) Q1 CY2026 Highlights:
- Revenue: $150.5 million vs analyst estimates of $138.1 million (13.6% year-on-year growth, 9% beat)
- Adjusted EPS: $0.28 vs analyst estimates of $0.21 (33.3% beat)
- Adjusted EBITDA: $15.05 million vs analyst estimates of $11.27 million (10% margin, 33.6% beat)
- Operating Margin: 2.7%, down from 4.7% in the same quarter last year
- Free Cash Flow Margin: 4.2%, similar to the same quarter last year
- Market Capitalization: $731.8 million
“The sustained high level of customer project activity in key vertical markets enabled LSI to deliver solid third quarter performance,” stated James A. Clark, President and CEO of LSI.
Company Overview
Enhancing commercial environments, LSI (NASDAQ: LYTS) provides lighting and display solutions for businesses and retailers.
Revenue Growth
Reviewing a company’s long-term sales performance reveals insights into its quality. Even a bad business can shine for one or two quarters, but a top-tier one grows for years. Luckily, LSI’s sales grew at an incredible 16.7% compounded annual growth rate over the last five years. Its growth surpassed the average industrials company and shows its offerings resonate with customers, a great starting point for our analysis.
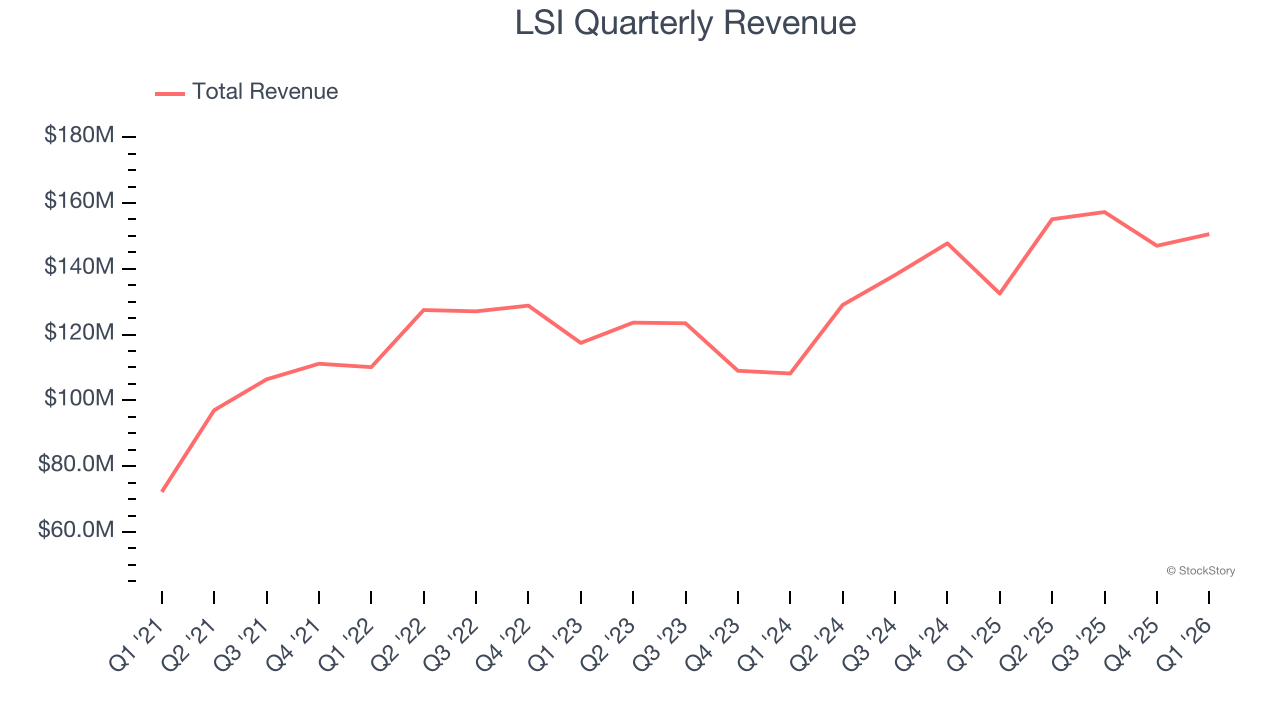
Long-term growth is the most important, but within industrials, a half-decade historical view may miss new industry trends or demand cycles. LSI’s annualized revenue growth of 14.6% over the last two years is below its five-year trend, but we still think the results suggest healthy demand. 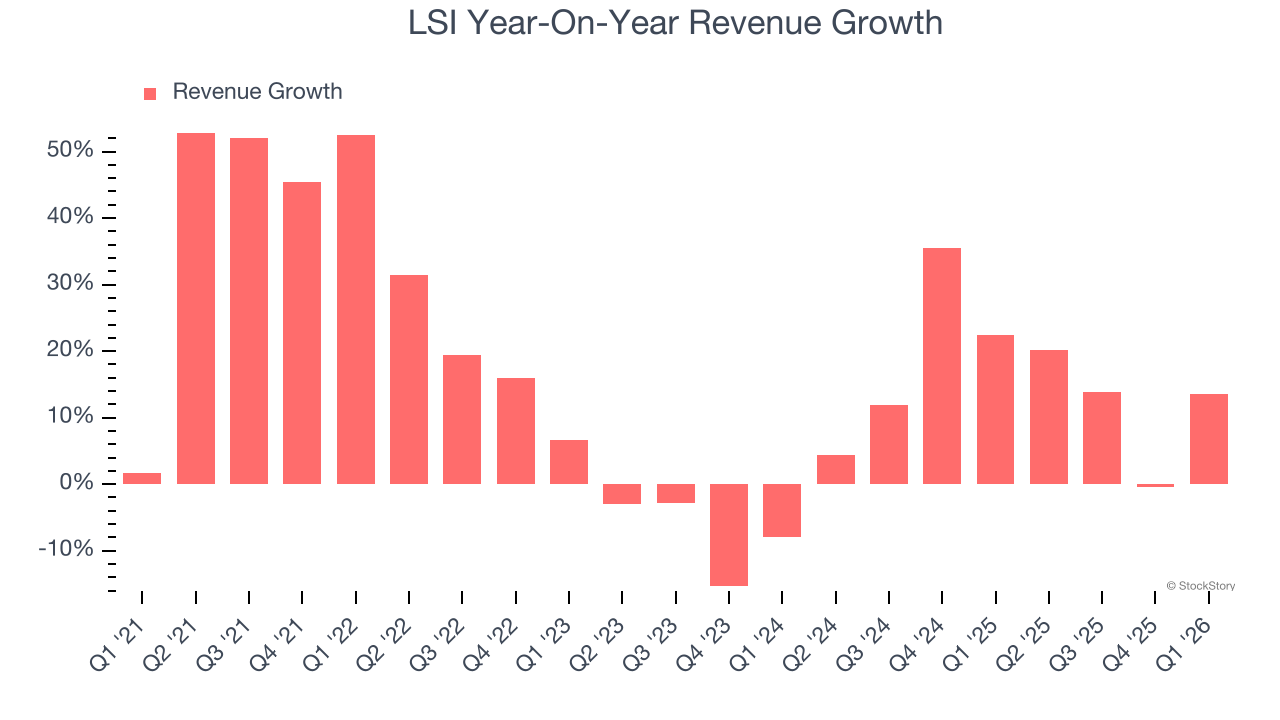
This quarter, LSI reported year-on-year revenue growth of 13.6%, and its $150.5 million of revenue exceeded Wall Street’s estimates by 9%.
Looking ahead, sell-side analysts expect revenue to grow 46.3% over the next 12 months, an improvement versus the last two years. This projection is eye-popping and indicates its newer products and services will fuel better top-line performance.
ONE MORE THING: The $21 AI Application Stock Wall Street Forgot. While Wall Street obsesses over who’s building AI, one company is already using it to print money. And nobody’s paying attention.
AI chip stocks trade at ridiculous valuations. This company processes a trillion consumer signals monthly using AI and trades at a third of the price. The gap won’t last. The institutions will figure it out. You need to see this first. Read the FREE Report Before They Notice.
Operating Margin
LSI was profitable over the last five years but held back by its large cost base. Its average operating margin of 6.3% was weak for an industrials business. This result isn’t too surprising given its low gross margin as a starting point.
On the plus side, LSI’s operating margin rose by 1.9 percentage points over the last five years, as its sales growth gave it operating leverage.
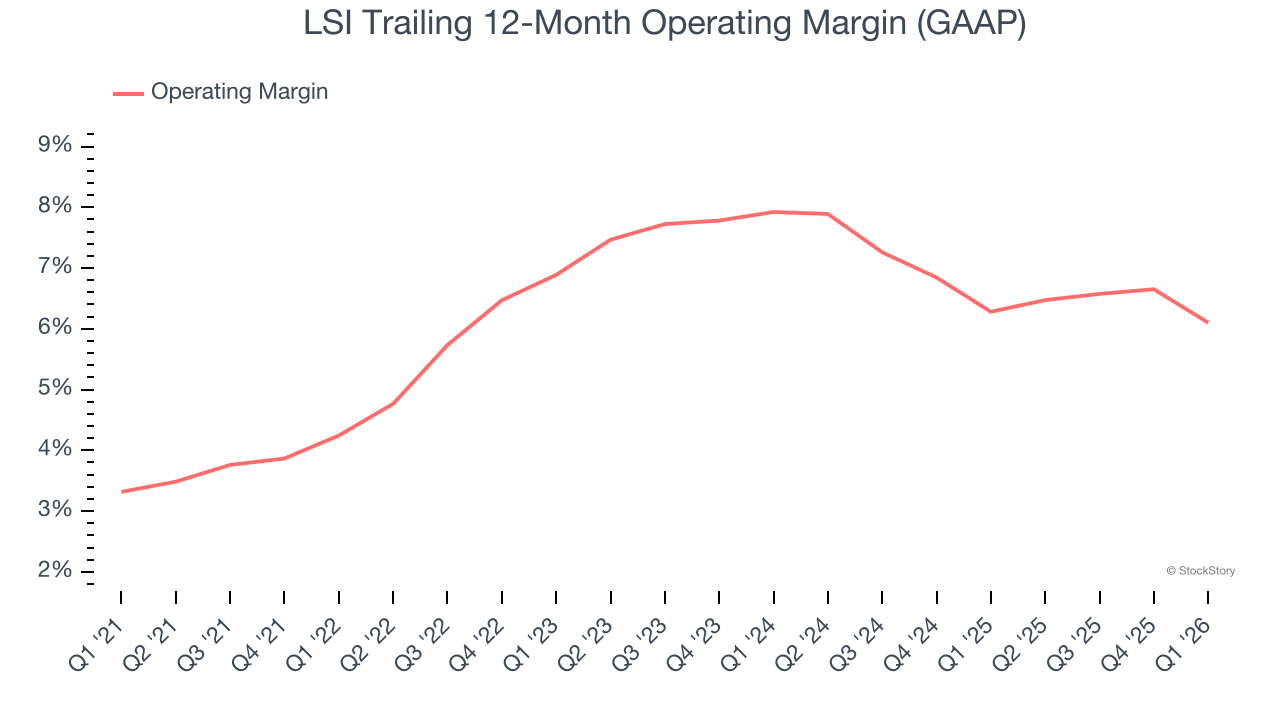
This quarter, LSI generated an operating margin profit margin of 2.7%, down 2 percentage points year on year. Since LSI’s operating margin decreased more than its gross margin, we can assume it was less efficient because expenses such as marketing, R&D, and administrative overhead increased.
Earnings Per Share
Revenue trends explain a company’s historical growth, but the long-term change in earnings per share (EPS) points to the profitability of that growth – for example, a company could inflate its sales through excessive spending on advertising and promotions.
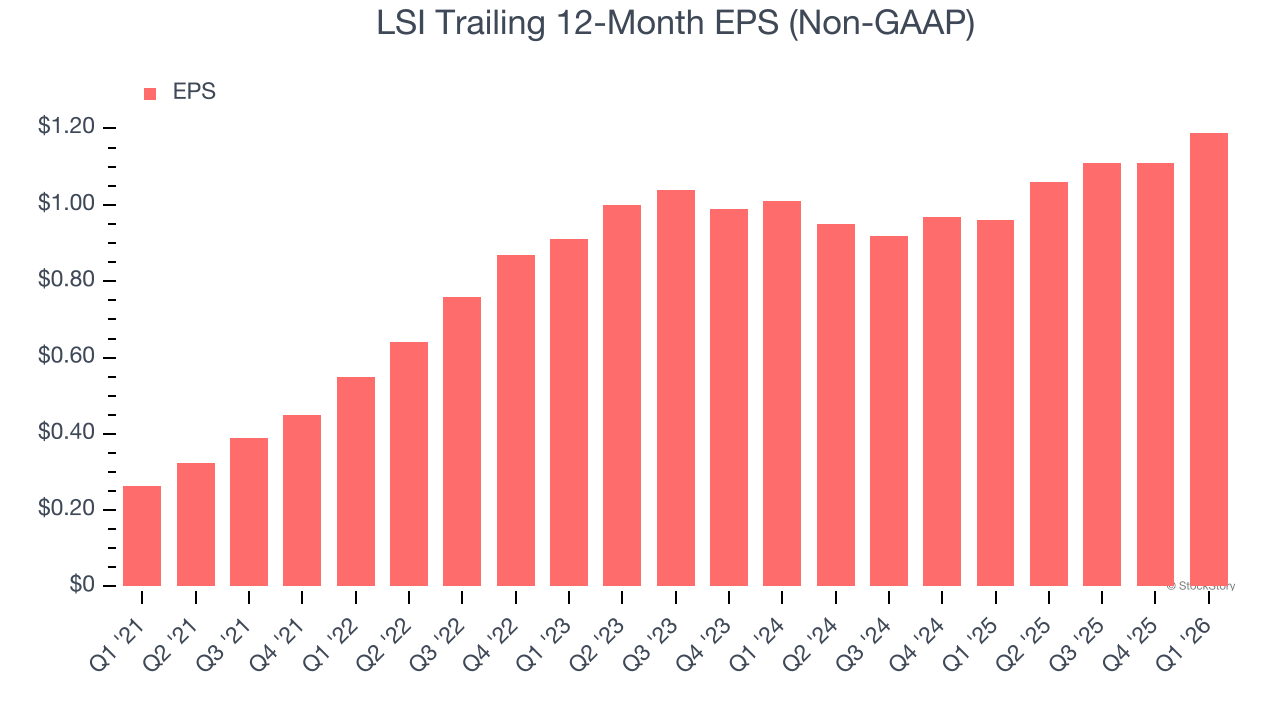
LSI’s EPS grew at 35.2% compounded annual growth rate over the last five years, higher than its 16.7% annualized revenue growth. This tells us the company became more profitable on a per-share basis as it expanded.
Diving into the nuances of LSI’s earnings can give us a better understanding of its performance. As we mentioned earlier, LSI’s operating margin declined this quarter but expanded by 1.9 percentage points over the last five years. This was the most relevant factor (aside from the revenue impact) behind its higher earnings; interest expenses and taxes can also affect EPS but don’t tell us as much about a company’s fundamentals.
Like with revenue, we analyze EPS over a shorter period to see if we are missing a change in the business.
For LSI, its two-year annual EPS growth of 8.5% was lower than its five-year trend. This wasn’t great, but at least the company was successful in other measures of financial health.
In Q1, LSI reported adjusted EPS of $0.28, up from $0.20 in the same quarter last year. This print easily cleared analysts’ estimates, and shareholders should be content with the results. Over the next 12 months, Wall Street expects LSI’s full-year EPS of $1.19 to grow 16.8%.
Key Takeaways from LSI’s Q1 Results
It was good to see LSI beat analysts’ EPS expectations this quarter. We were also excited its EBITDA outperformed Wall Street’s estimates by a wide margin. On the other hand, its adjusted operating income missed. Overall, we think this was a solid quarter with some key areas of upside. The stock traded up 10.3% to $22.86 immediately after reporting.
Sure, LSI had a solid quarter, but if we look at the bigger picture, is this stock a buy? What happened in the latest quarter matters, but not as much as longer-term business quality and valuation, when deciding whether to invest in this stock. We cover that in our actionable full research report which you can read here (it’s free).


