

Health insurance company Cigna (NYSE: CI) reported revenue ahead of Wall Street’s expectations in Q1 CY2026, with sales up 4.6% year on year to $68.49 billion. Its non-GAAP profit of $7.79 per share was 2.4% above analysts’ consensus estimates.
Is now the time to buy Cigna? Find out by accessing our full research report, it’s free.
Cigna (CI) Q1 CY2026 Highlights:
- Revenue: $68.49 billion vs analyst estimates of $66.5 billion (4.6% year-on-year growth, 3% beat)
- Adjusted EPS: $7.79 vs analyst estimates of $7.61 (2.4% beat)
- Management slightly raised its full-year Adjusted EPS guidance to $30.35 at the midpoint
- Operating Margin: 3%, in line with the same quarter last year
- Customers: 16.62 million, up from 16.42 million in the previous quarter
- Market Capitalization: $77.07 billion
Company Overview
With roots dating back to 1792 and serving millions of customers across the globe, The Cigna Group (NYSE: CI) provides healthcare services through its Evernorth Health Services and Cigna Healthcare segments, offering pharmacy benefits, specialty care, and medical plans.
Revenue Growth
Examining a company’s long-term performance can provide clues about its quality. Any business can put up a good quarter or two, but the best consistently grow over the long haul. Over the last five years, Cigna grew its sales at a decent 11.3% compounded annual growth rate. Its growth was slightly above the average healthcare company and shows its offerings resonate with customers.
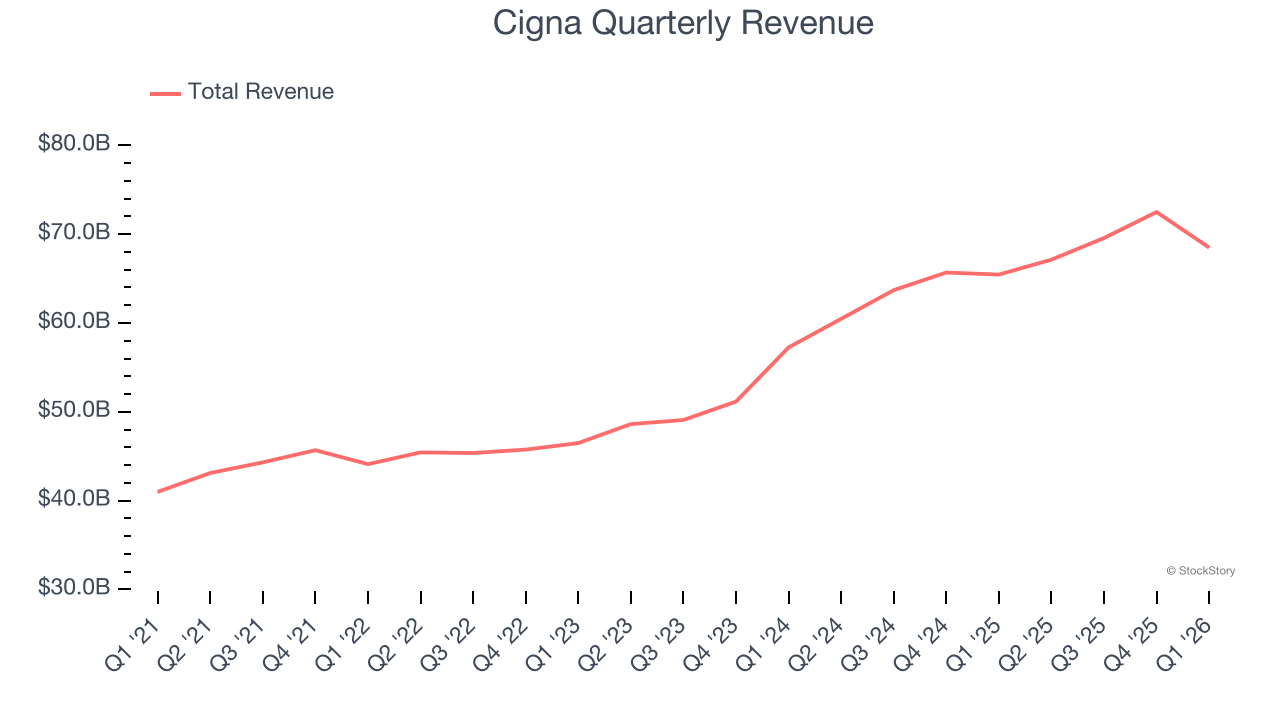
Long-term growth is the most important, but within healthcare, a half-decade historical view may miss new innovations or demand cycles. Cigna’s annualized revenue growth of 16.1% over the last two years is above its five-year trend, suggesting its demand recently accelerated. 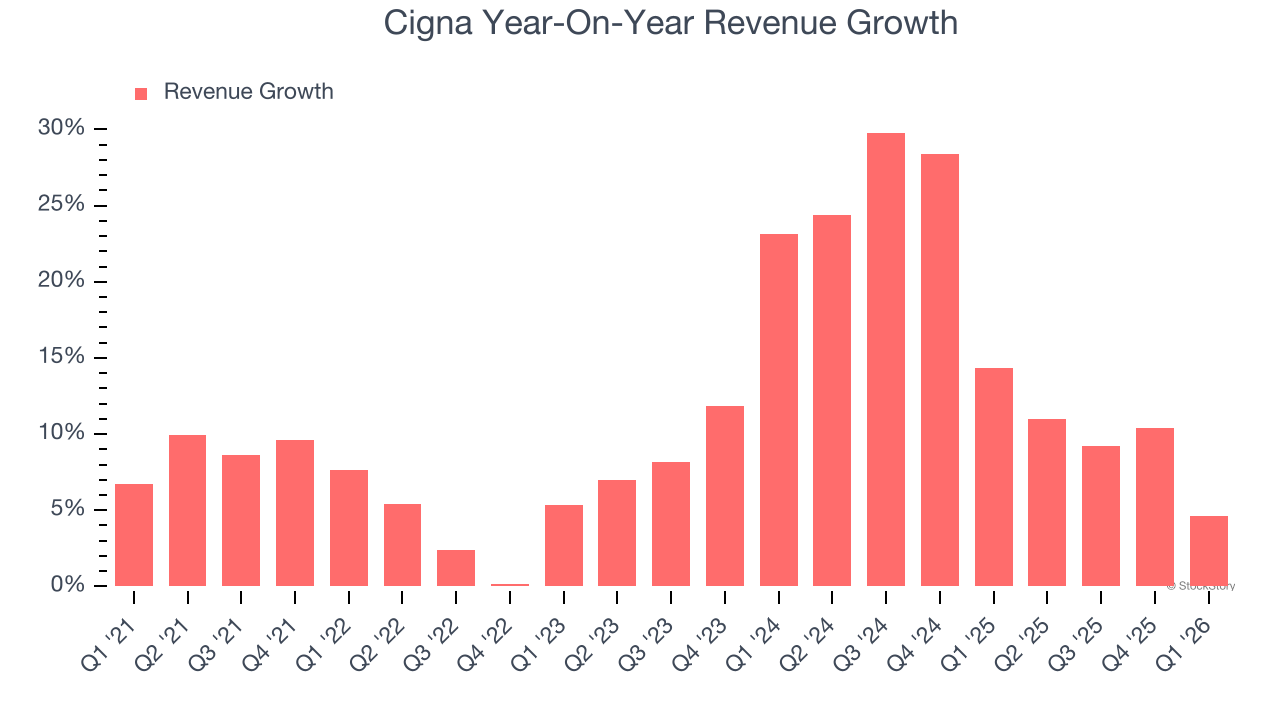
We can dig further into the company’s revenue dynamics by analyzing its number of customers, which reached 16.62 million in the latest quarter. Over the last two years, Cigna’s customer base averaged 9.8% year-on-year declines. Because this number is lower than its revenue growth, we can see the average customer spent more money each year on the company’s products and services. 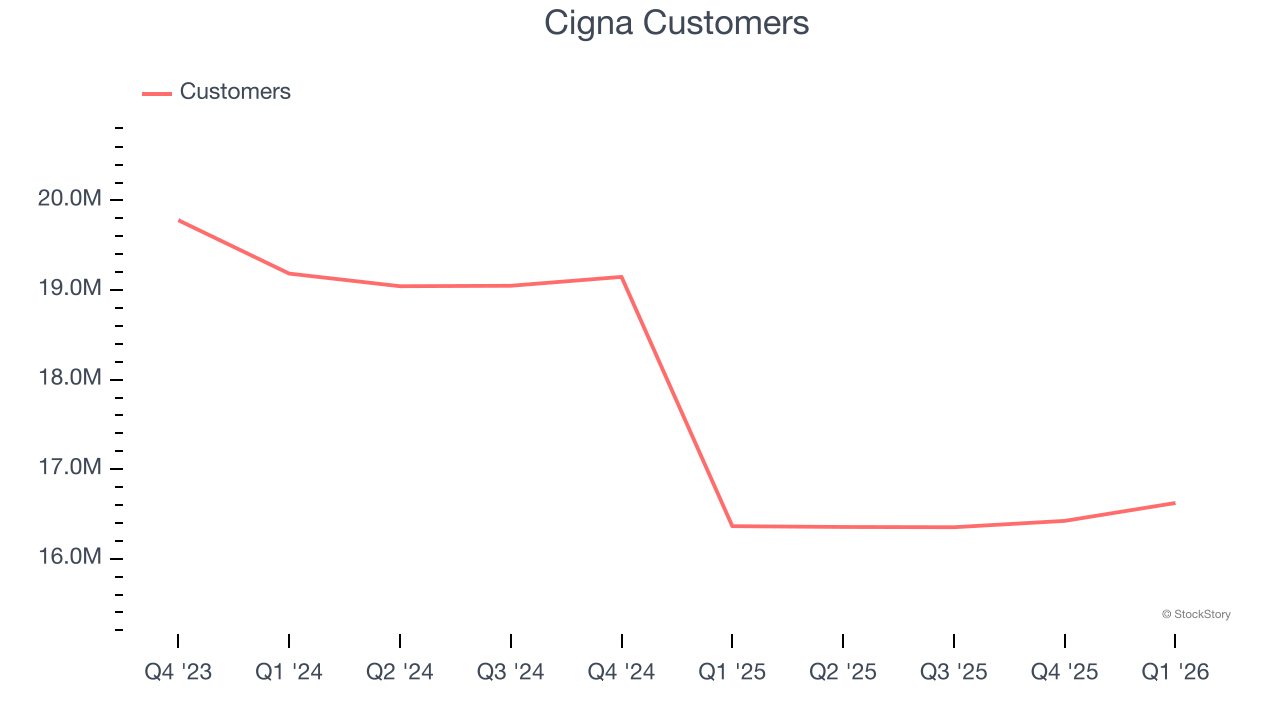
This quarter, Cigna reported modest year-on-year revenue growth of 4.6% but beat Wall Street’s estimates by 3%.
Looking ahead, sell-side analysts expect revenue to grow 3.3% over the next 12 months, a deceleration versus the last two years. This projection doesn't excite us and indicates its products and services will face some demand challenges. At least the company is tracking well in other measures of financial health.
ONE MORE THING: 3 Hidden Platforms Growing 3X Faster than Amazon, Google, and PayPal. Amazon, Google, and Meta all followed the same playbook: Dominate an ignored market. Build an unbeatable moat. Scale until you’re unstoppable.
These three platforms are running that exact playbook right now. The early investors in Amazon made fortunes. The early investors in these could do the same. Get All 3 Stocks Here for FREE.
Adjusted Operating Margin
Adjusted operating margin is a key measure of profitability. Think of it as net income (the bottom line) excluding the impact of non-recurring expenses, taxes, and interest on debt - metrics less connected to business fundamentals.
Cigna was profitable over the last five years but held back by its large cost base. Its average adjusted operating margin of 4.9% was weak for a healthcare business.
Analyzing the trend in its profitability, Cigna’s adjusted operating margin decreased by 2 percentage points over the last five years. The company’s two-year trajectory also shows it failed to get its profitability back to the peak as its margin fell by 1.5 percentage points. We still like Cigna but would like to see some improvement in the future.
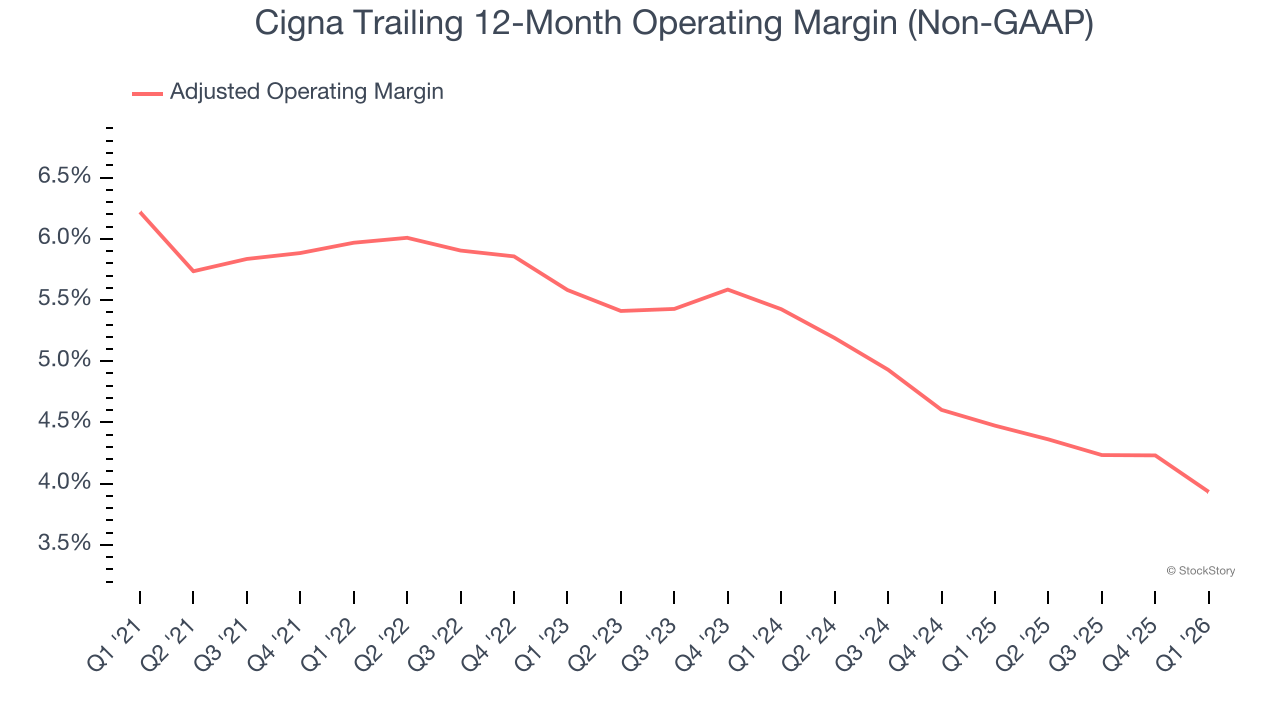
In Q1, Cigna generated an adjusted operating margin profit margin of 3%, down 1.2 percentage points year on year. This reduction is quite minuscule and indicates the company’s overall cost structure has been relatively stable.
Earnings Per Share
Revenue trends explain a company’s historical growth, but the long-term change in earnings per share (EPS) points to the profitability of that growth – for example, a company could inflate its sales through excessive spending on advertising and promotions.
Cigna’s remarkable 10.9% annual EPS growth over the last five years aligns with its revenue performance. This tells us it maintained its per-share profitability as it expanded.
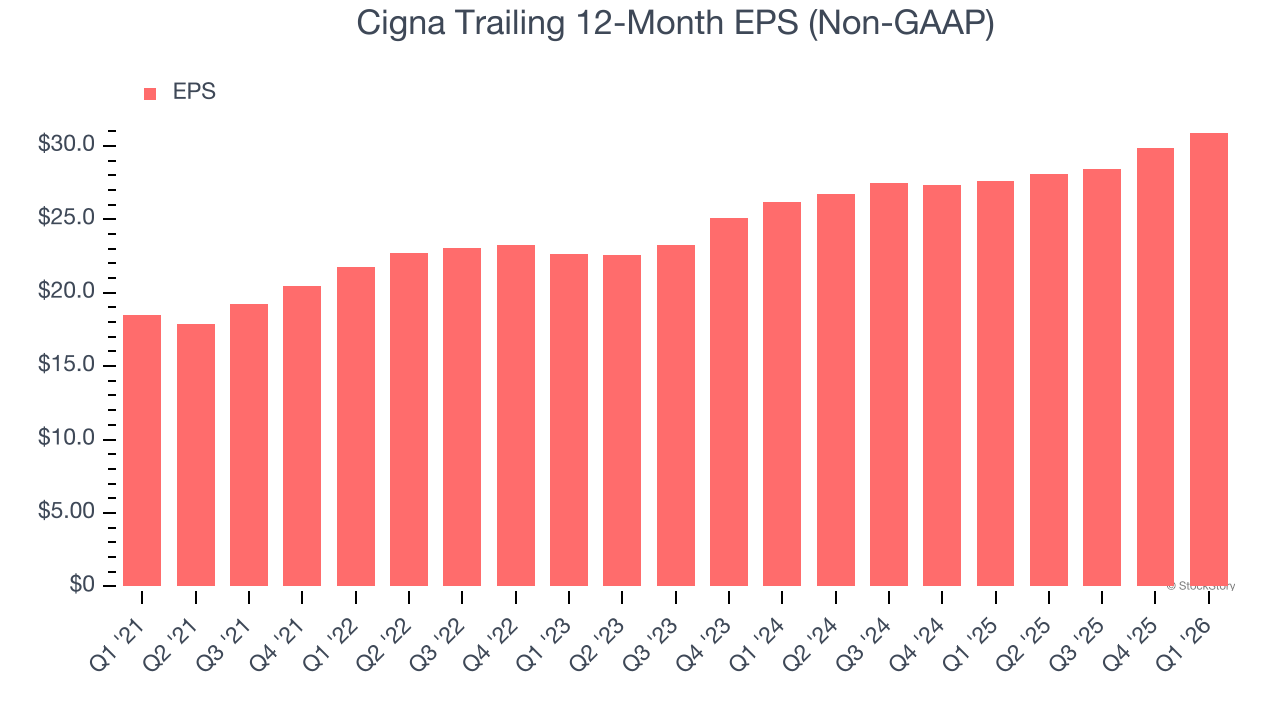
In Q1, Cigna reported adjusted EPS of $7.79, up from $6.74 in the same quarter last year. This print beat analysts’ estimates by 2.4%. Over the next 12 months, Wall Street expects Cigna’s full-year EPS of $30.90 to stay about the same.
Key Takeaways from Cigna’s Q1 Results
We enjoyed seeing Cigna beat analysts’ revenue and EPS expectations this quarter. The company also slightly raised full-year guidance for revenue and EPS. Overall, this print had some key positives. The stock remained flat at $292.56 immediately after reporting.
Indeed, Cigna had a rock-solid quarterly earnings result, but is this stock a good investment here? When making that decision, it’s important to consider its valuation, business qualities, as well as what has happened in the latest quarter. We cover that in our actionable full research report which you can read here (it’s free).


