

Cruise vacation company Royal Caribbean (NYSE: RCL) met Wall Street’s revenue expectations in Q1 CY2026, with sales up 11.3% year on year to $4.45 billion. Its non-GAAP profit of $3.60 per share was 12.6% above analysts’ consensus estimates.
Is now the time to buy Royal Caribbean? Find out by accessing our full research report, it’s free.
Royal Caribbean (RCL) Q1 CY2026 Highlights:
- Revenue: $4.45 billion vs analyst estimates of $4.46 billion (11.3% year-on-year growth, in line)
- Adjusted EPS: $3.60 vs analyst estimates of $3.20 (12.6% beat)
- Adjusted EBITDA: $1.70 billion vs analyst estimates of $1.60 billion (38.2% margin, 6.7% beat)
- Management lowered its full-year Adjusted EPS guidance to $17.30 at the midpoint, a 3.4% decrease
- Operating Margin: 26.1%, up from 23.7% in the same quarter last year
- Free Cash Flow Margin: 30%, similar to the same quarter last year
- Passenger Cruise Days: up 1.1 million year on year
- Market Capitalization: $68.12 billion
"Our strong first quarter results and record WAVE season demonstrate the exceptional appeal and compelling value proposition of our trusted brands, industry-leading ships, and destinations," said Jason Liberty, Chairman and CEO, Royal Caribbean Group.
Company Overview
Established in 1968, Royal Caribbean Cruises (NYSE: RCL) is a global cruise vacation company renowned for its innovative and exciting cruise experiences.
Revenue Growth
A company’s long-term sales performance can indicate its overall quality. Any business can have short-term success, but a top-tier one grows for years. Thankfully, Royal Caribbean’s 143% annualized revenue growth over the last five years was incredible. Its growth beat the average consumer discretionary company and shows its offerings resonate with customers.
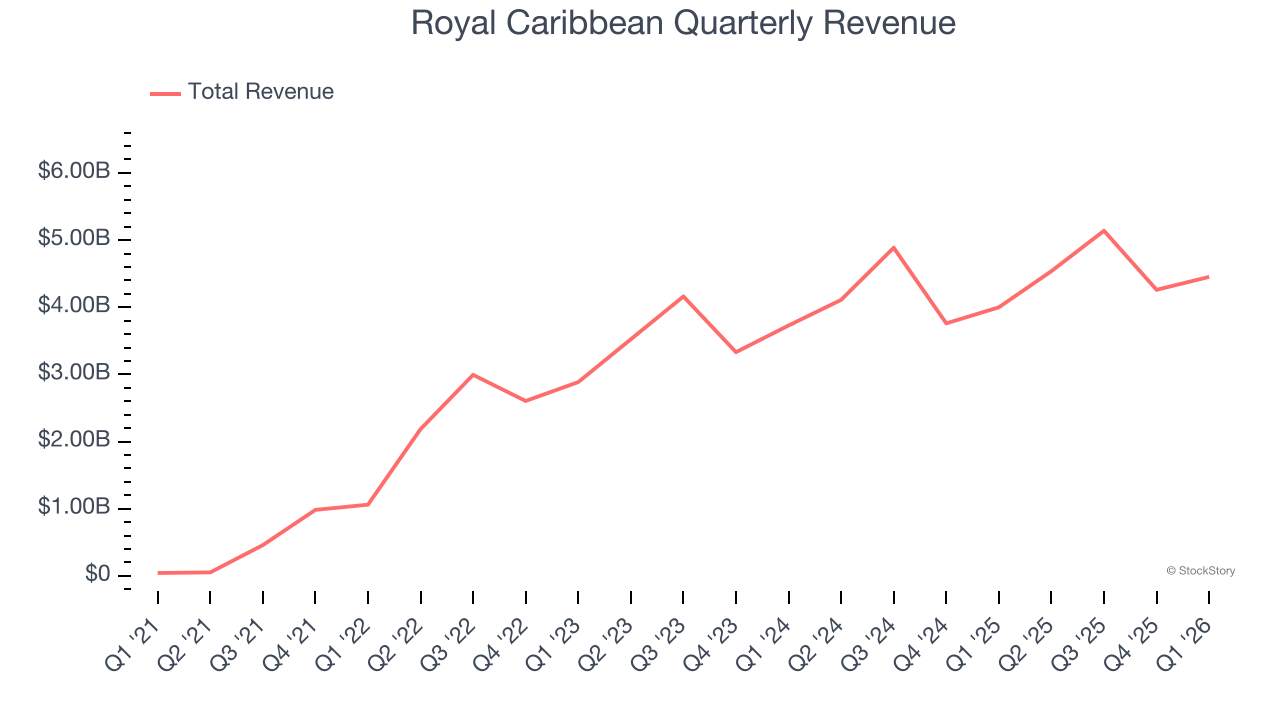
We at StockStory place the most emphasis on long-term growth, but within consumer discretionary, a stretched historical view may miss a company riding a successful new property or trend. Royal Caribbean’s recent performance shows its demand has slowed significantly as its annualized revenue growth of 11.7% over the last two years was well below its five-year trend. 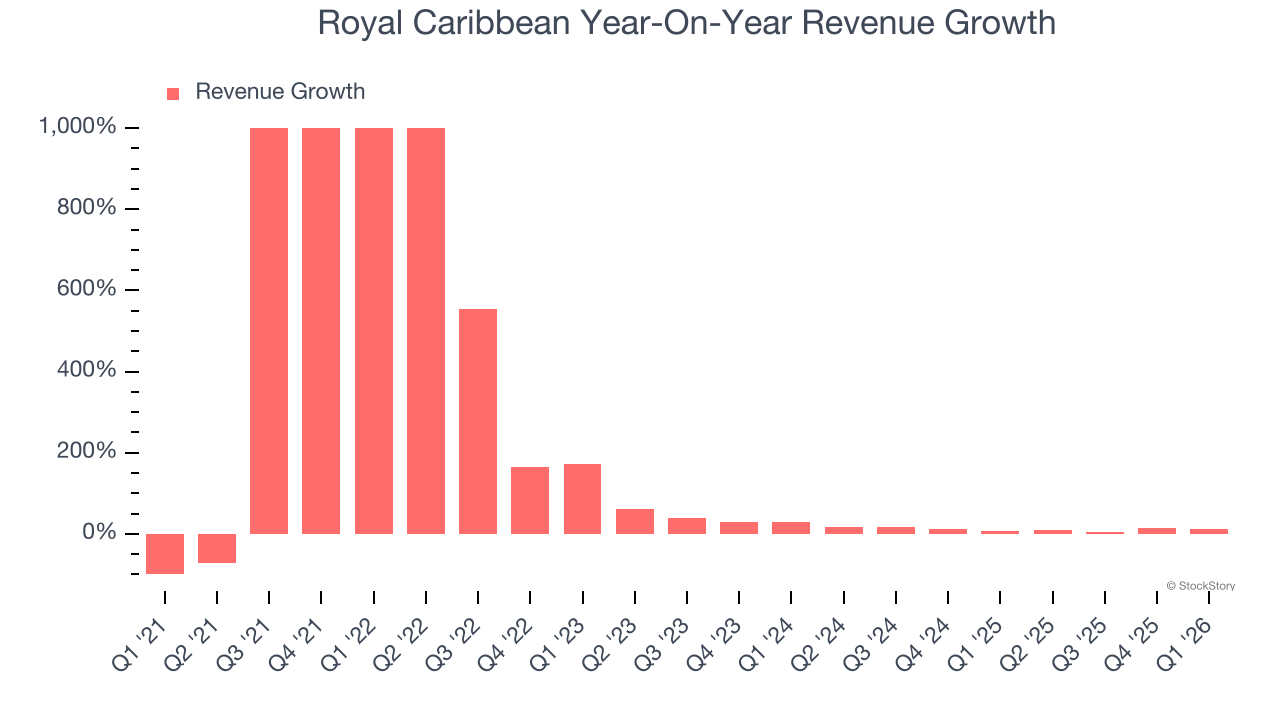
We can better understand the company’s revenue dynamics by analyzing its number of passenger cruise days, which reached 14.87 million in the latest quarter. Over the last two years, Royal Caribbean’s passenger cruise days averaged 7% year-on-year growth. Because this number is lower than its revenue growth during the same period, we can see the company’s monetization has risen. 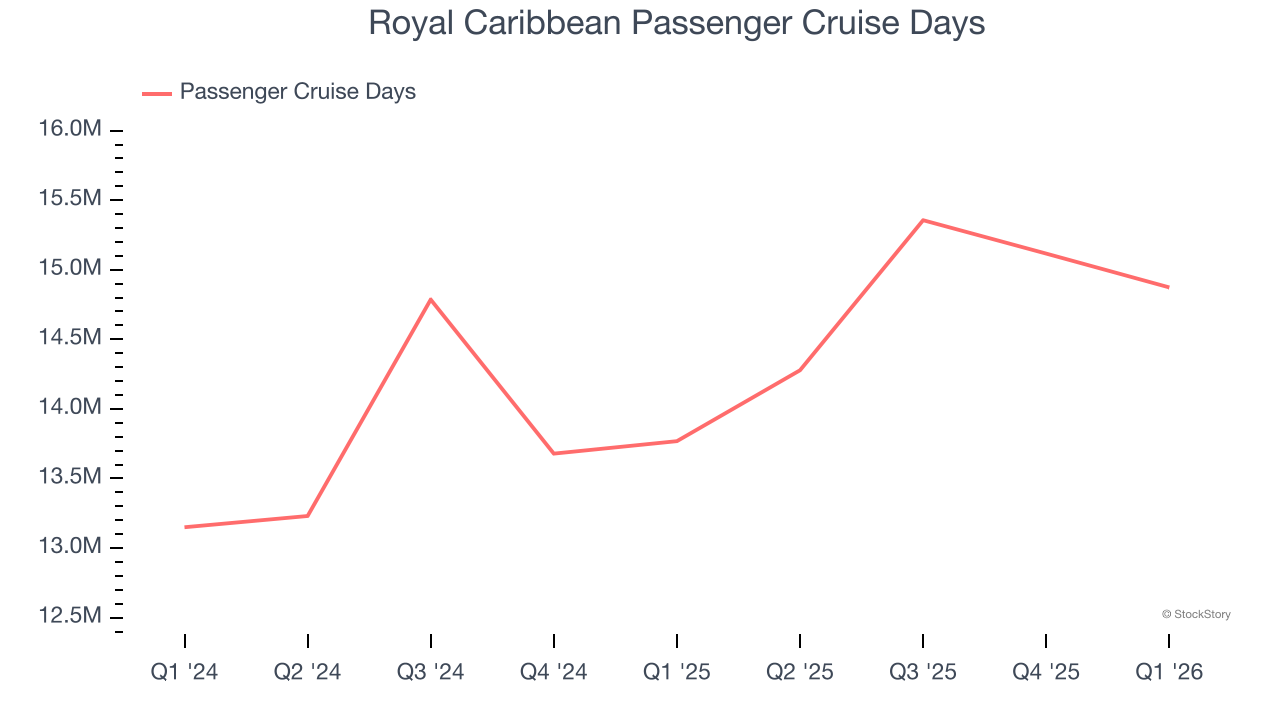
This quarter, Royal Caribbean’s year-on-year revenue growth was 11.3%, and its $4.45 billion of revenue was in line with Wall Street’s estimates.
Looking ahead, sell-side analysts expect revenue to grow 8.3% over the next 12 months, a deceleration versus the last two years. This projection doesn't excite us and indicates its products and services will face some demand challenges.
ONE MORE THING: The $21 AI Application Stock Wall Street Forgot. While Wall Street obsesses over who’s building AI, one company is already using it to print money. And nobody’s paying attention.
AI chip stocks trade at ridiculous valuations. This company processes a trillion consumer signals monthly using AI and trades at a third of the price. The gap won’t last. The institutions will figure it out. You need to see this first. Read the FREE Report Before They Notice.
Operating Margin
Royal Caribbean’s operating margin has been trending up over the last 12 months and averaged 26.8% over the last two years. The company’s higher efficiency is a breath of fresh air, but its suboptimal cost structure means it still sports lousy profitability for a consumer discretionary business.
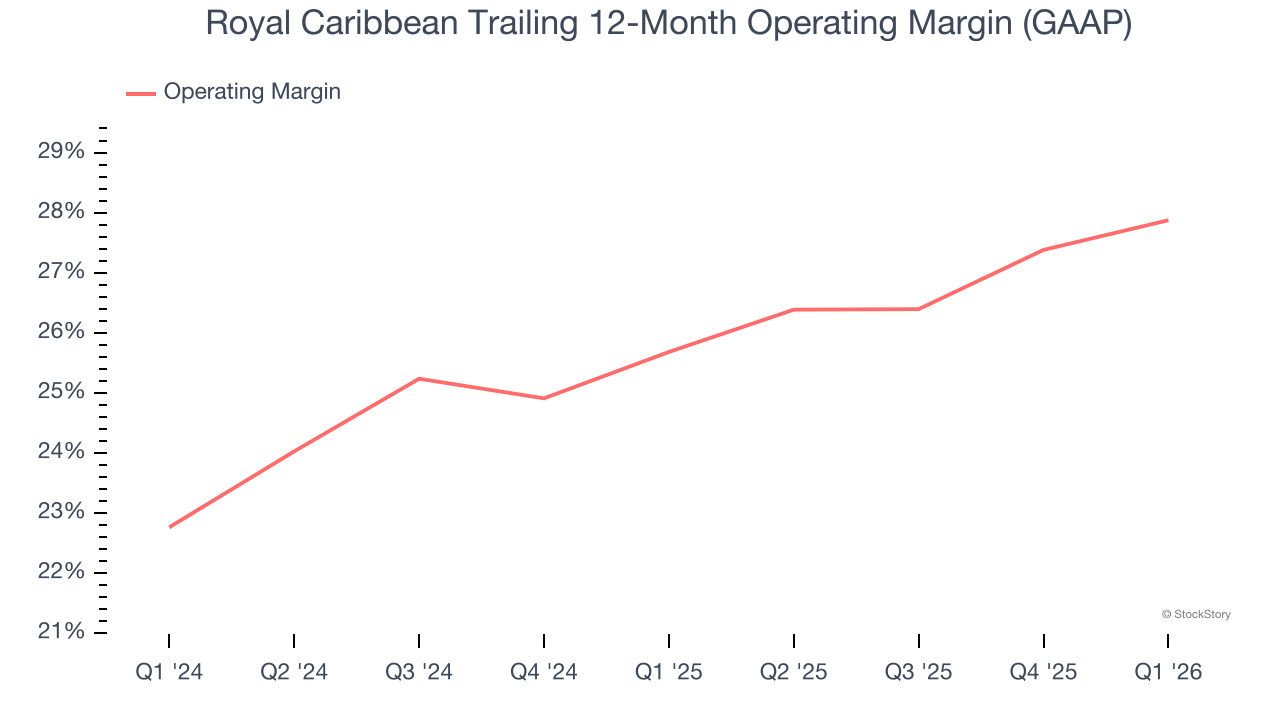
In Q1, Royal Caribbean generated an operating margin profit margin of 26.1%, up 2.4 percentage points year on year. This increase was a welcome development and shows it was more efficient.
Earnings Per Share
Revenue trends explain a company’s historical growth, but the long-term change in earnings per share (EPS) points to the profitability of that growth – for example, a company could inflate its sales through excessive spending on advertising and promotions.
Royal Caribbean’s full-year EPS flipped from negative to positive over the last five years. This is encouraging and shows it’s at a critical moment in its life.
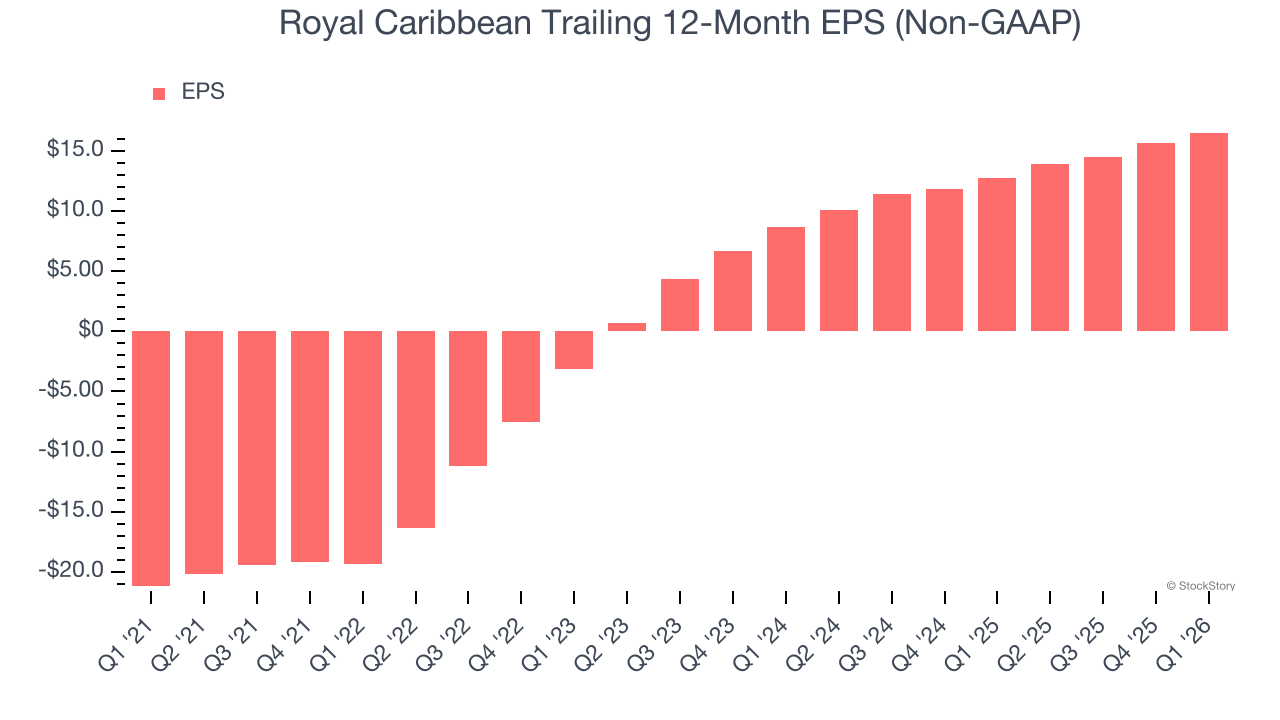
In Q1, Royal Caribbean reported adjusted EPS of $3.60, up from $2.71 in the same quarter last year. This print easily cleared analysts’ estimates, and shareholders should be content with the results. Over the next 12 months, Wall Street expects Royal Caribbean’s full-year EPS of $16.53 to grow 5.6%.
Key Takeaways from Royal Caribbean’s Q1 Results
It was good to see Royal Caribbean beat analysts’ EPS expectations this quarter. We were also happy its adjusted operating income outperformed Wall Street’s estimates. On the other hand, its EPS guidance for next quarter missed. Overall, this print was mixed. Still, it seems that this print cleared expectations, and the stock traded up 5.3% to $267.50 immediately after reporting.
Big picture, is Royal Caribbean a buy here and now? When making that decision, it’s important to consider its valuation, business qualities, as well as what has happened in the latest quarter. We cover that in our actionable full research report which you can read here (it’s free).


