Railcar products and services provider Trinity (NYSE: TRN) fell short of the market’s revenue expectations in Q1 CY2026, with sales falling 16% year on year to $492 million. Its GAAP profit of $0.30 per share was 11.8% below analysts’ consensus estimates.
Is now the time to buy Trinity? Find out by accessing our full research report, it’s free.
Trinity (TRN) Q1 CY2026 Highlights:
- Revenue: $492 million vs analyst estimates of $538.9 million (16% year-on-year decline, 8.7% miss)
- EPS (GAAP): $0.30 vs analyst expectations of $0.34 (11.8% miss)
- Adjusted EBITDA: $175.9 million vs analyst estimates of $174.1 million (35.8% margin, 1% beat)
- EPS (GAAP) guidance for the full year is $2.30 at the midpoint, beating analyst estimates by 15%
- Operating Margin: 20.5%, up from 15.7% in the same quarter last year
- Free Cash Flow was -$59.5 million compared to -$52.9 million in the same quarter last year
- Backlog: $1.6 billion at quarter end, down 15.8% year on year
- Market Capitalization: $2.45 billion
"We're pleased to raise our full-year EPS guidance to a range of $2.20 to $2.40, representing a 16% increase at the midpoint," said Trinity's Chief Executive Officer and President, Jean Savage.
Company Overview
Operating under the trade name TrinityRail, Trinity (NYSE: TRN) is a provider of railcar products and services in North America.
Revenue Growth
A company’s long-term sales performance can indicate its overall quality. Even a bad business can shine for one or two quarters, but a top-tier one grows for years. Over the last five years, Trinity grew its sales at a mediocre 7.1% compounded annual growth rate. This was below our standard for the industrials sector and is a poor baseline for our analysis.
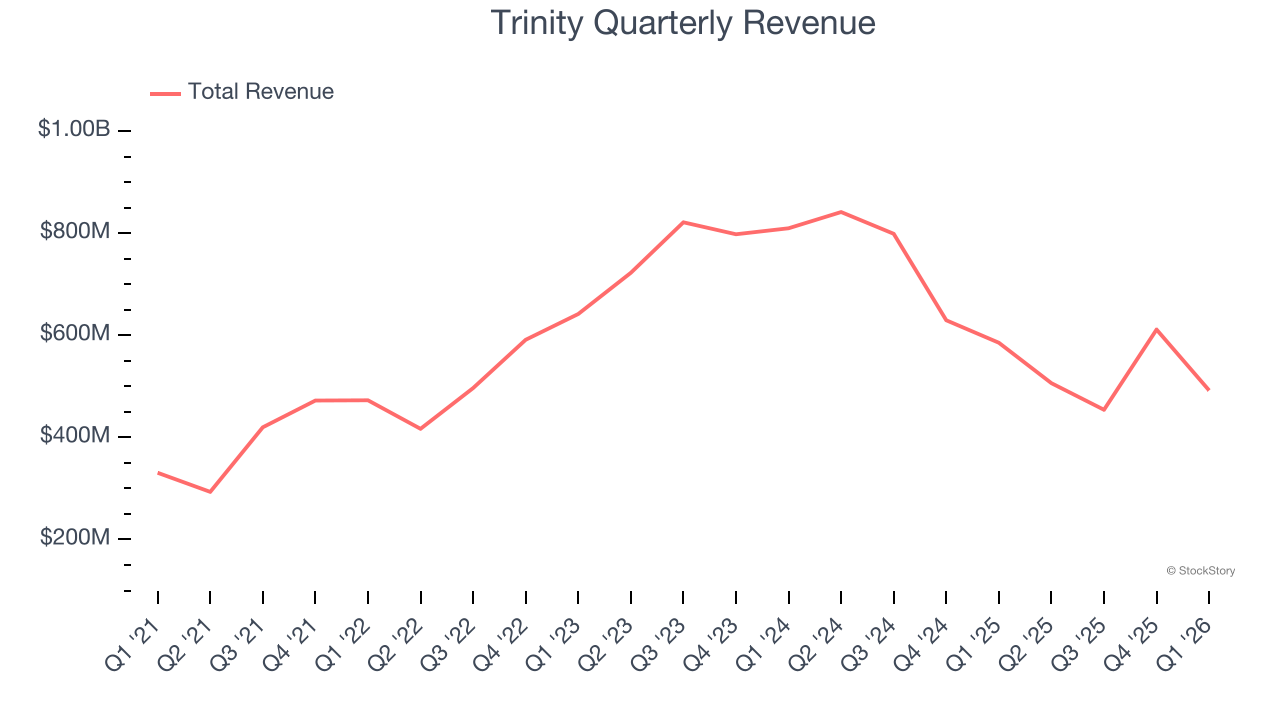
We at StockStory place the most emphasis on long-term growth, but within industrials, a half-decade historical view may miss cycles, industry trends, or a company capitalizing on catalysts such as a new contract win or a successful product line. Trinity’s performance shows it grew in the past but relinquished its gains over the last two years, as its revenue fell by 19.1% annually. 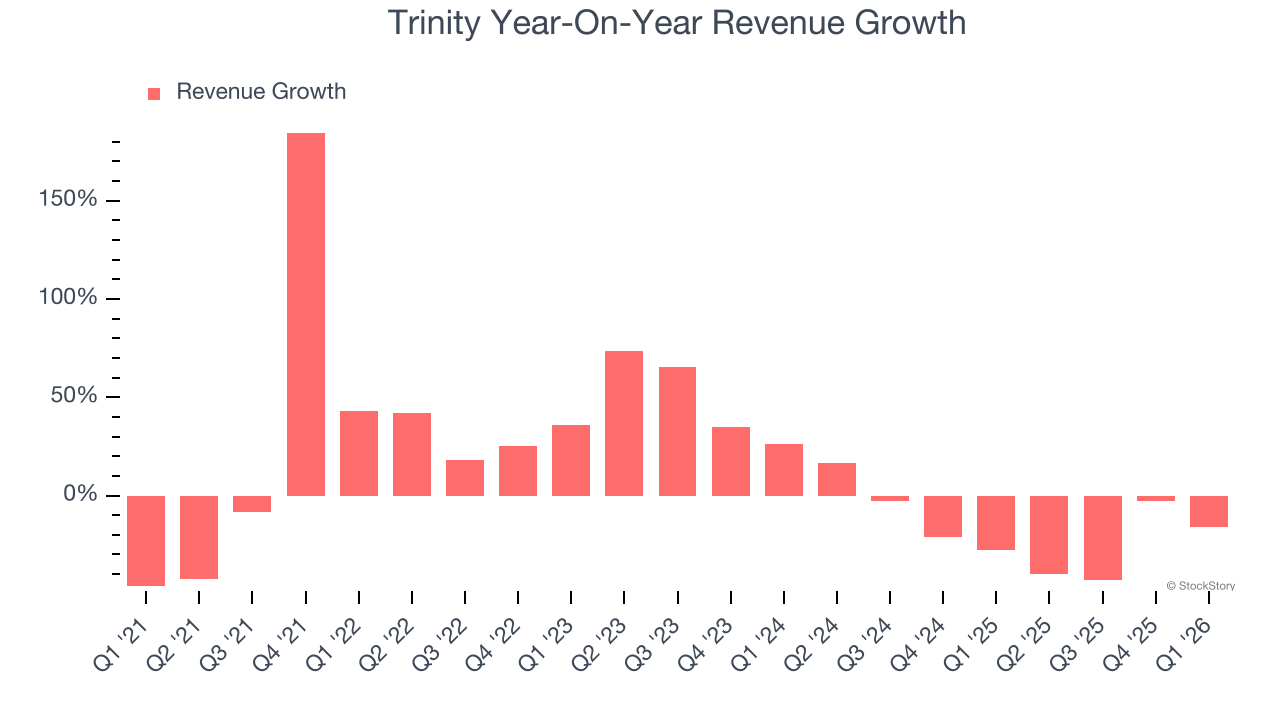
Trinity also reports its backlog, or the value of its outstanding orders that have not yet been executed or delivered. Trinity’s backlog reached $1.6 billion in the latest quarter and averaged 25.8% year-on-year declines over the last two years. Because this number is lower than its revenue growth, we can see the company hasn’t secured enough new orders to maintain its growth rate in the future. 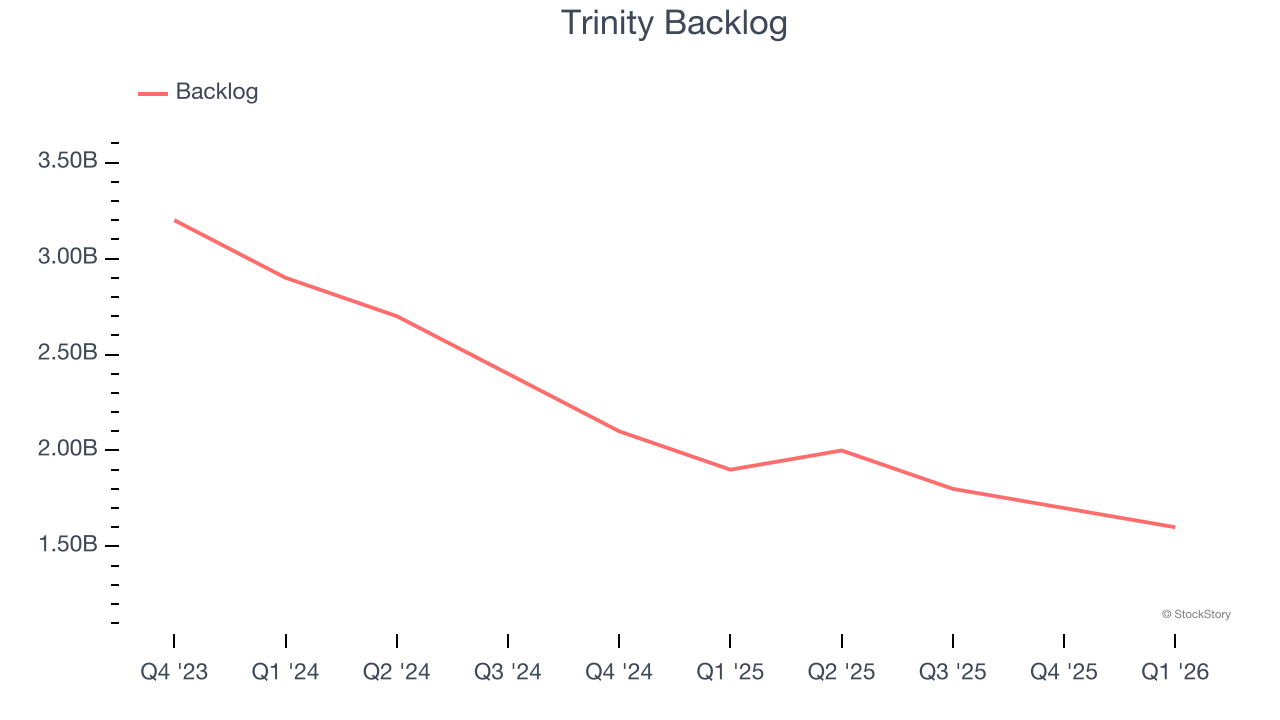
This quarter, Trinity missed Wall Street’s estimates and reported a rather uninspiring 16% year-on-year revenue decline, generating $492 million of revenue.
Looking ahead, sell-side analysts expect revenue to grow 6.7% over the next 12 months. While this projection implies its newer products and services will fuel better top-line performance, it is still below average for the sector.
ONE MORE THING: 3 Hidden Platforms Growing 3X Faster than Amazon, Google, and PayPal. Amazon, Google, and Meta all followed the same playbook: Dominate an ignored market. Build an unbeatable moat. Scale until you’re unstoppable.
These three platforms are running that exact playbook right now. The early investors in Amazon made fortunes. The early investors in these could do the same. Get All 3 Stocks Here for FREE.
Operating Margin
Trinity has been an efficient company over the last five years. It was one of the more profitable businesses in the industrials sector, boasting an average operating margin of 12.9%. This result was particularly impressive because of its low gross margin, which is mostly a factor of what it sells and takes huge shifts to move meaningfully. Companies have more control over their operating margins, and it’s a show of well-managed operations if they’re high when gross margins are low.
Analyzing the trend in its profitability, Trinity’s operating margin rose by 7.9 percentage points over the last five years, as its sales growth gave it operating leverage.
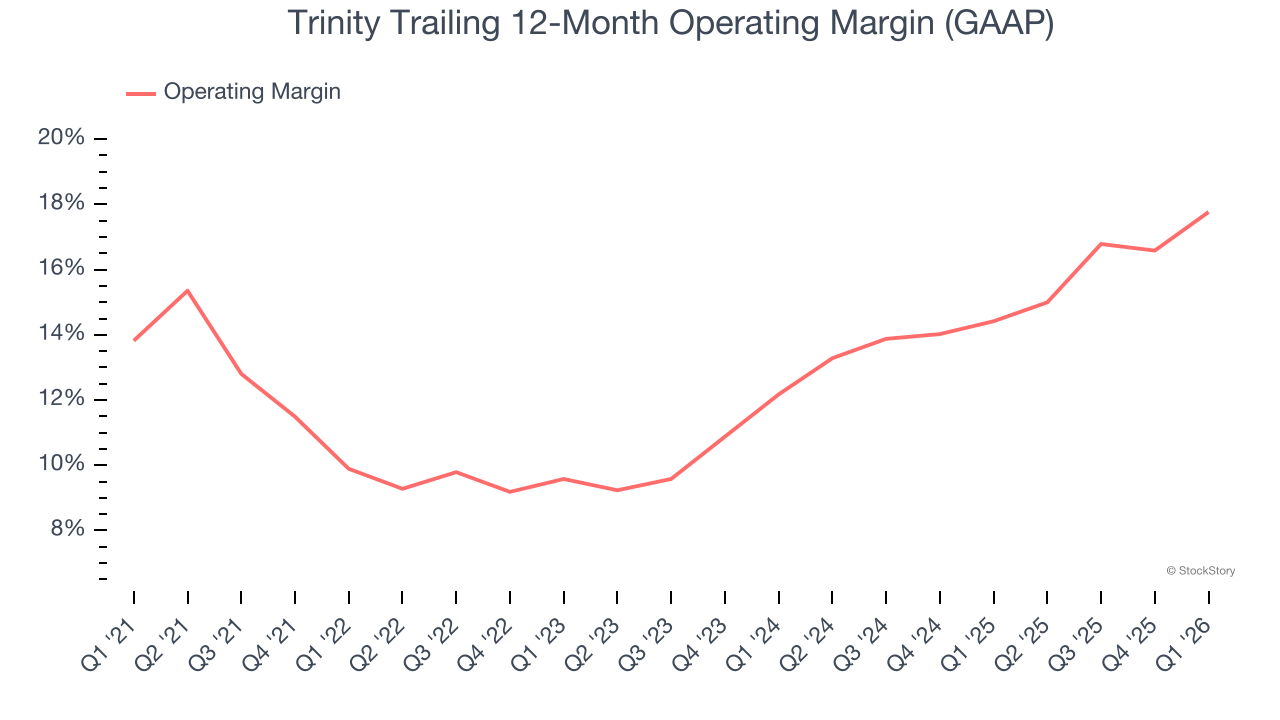
In Q1, Trinity generated an operating margin profit margin of 20.5%, up 4.8 percentage points year on year. The increase was encouraging, and because its operating margin rose more than its gross margin, we can infer it was more efficient with expenses such as marketing, R&D, and administrative overhead.
Earnings Per Share
We track the long-term change in earnings per share (EPS) for the same reason as long-term revenue growth. Compared to revenue, however, EPS highlights whether a company’s growth is profitable.
Trinity’s full-year EPS flipped from negative to positive over the last five years. This is encouraging and shows it’s at a critical moment in its life.
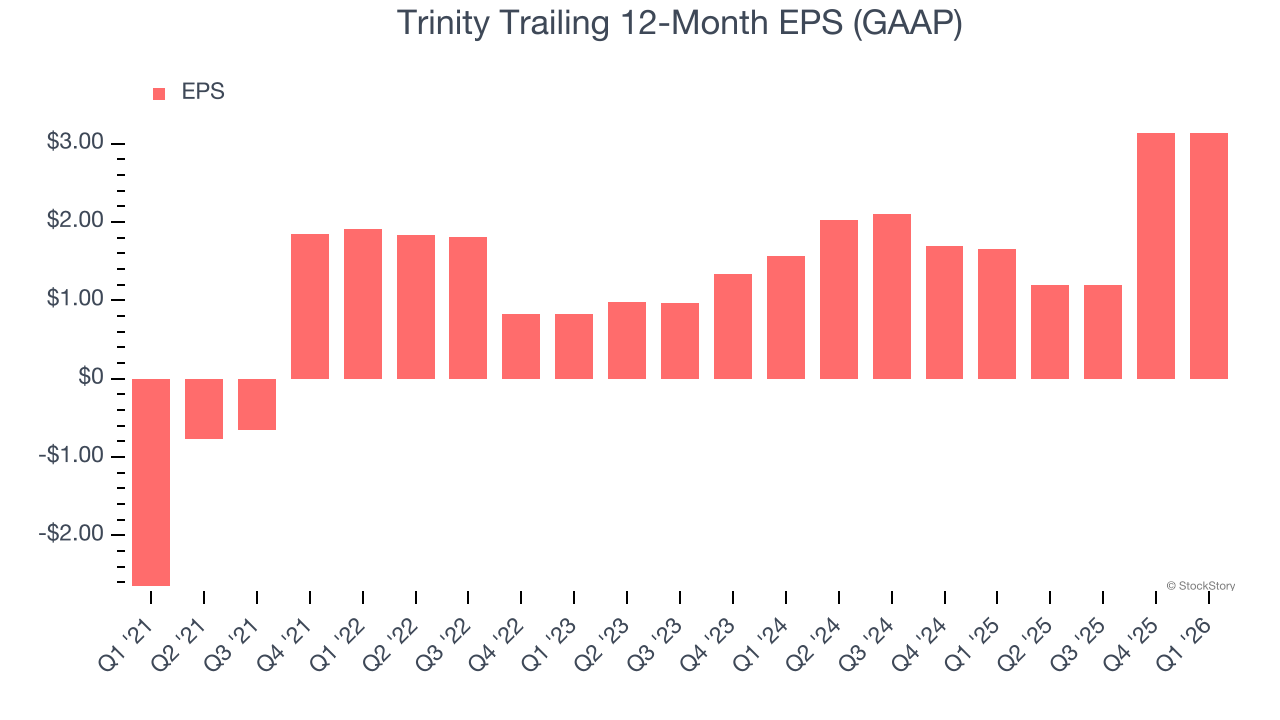
Like with revenue, we analyze EPS over a shorter period to see if we are missing a change in the business.
Trinity’s EPS grew at an astounding 41.4% compounded annual growth rate over the last two years, higher than its 19.1% annualized revenue declines. This tells us management adapted its cost structure in response to a challenging demand environment.
Diving into the nuances of Trinity’s earnings can give us a better understanding of its performance. Trinity’s operating margin has expanded over the last two yearswhile its share count has shrunk 1.9%. Improving profitability and share buybacks are positive signs for shareholders as they juice EPS growth relative to revenue growth. 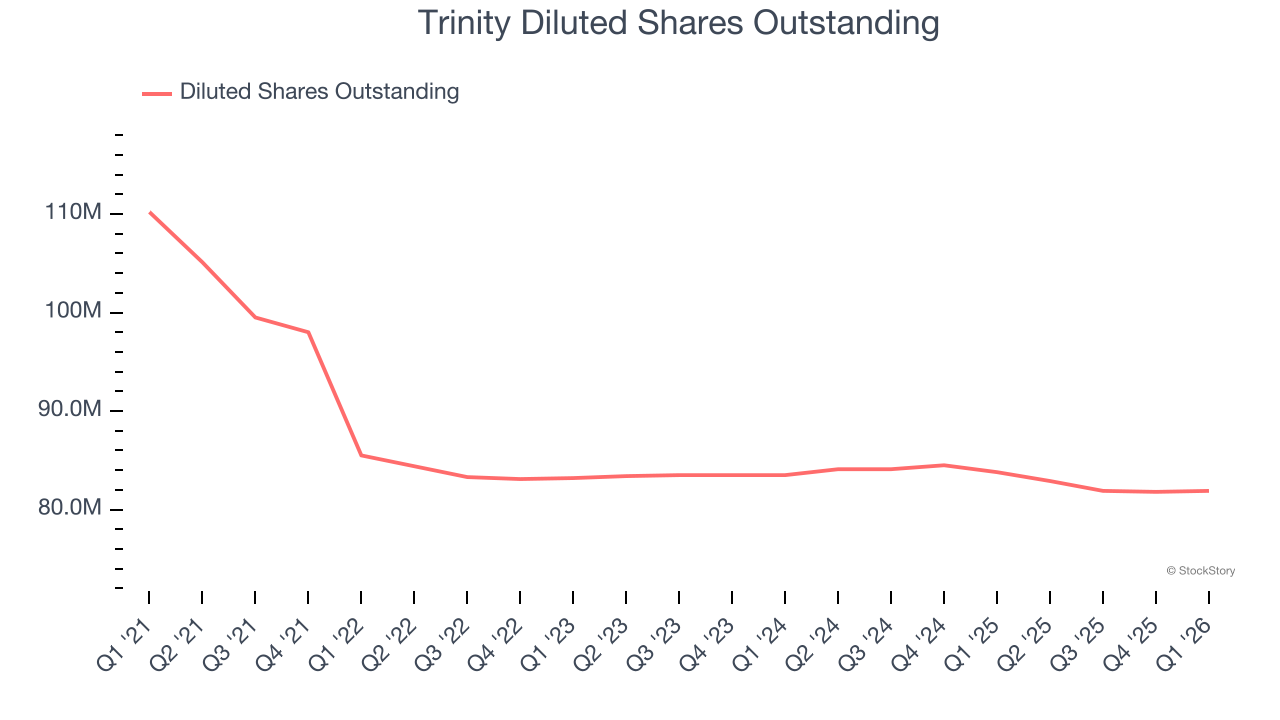
In Q1, Trinity reported EPS of $0.30, up from $0.29 in the same quarter last year. Despite growing year on year, this print missed analysts’ estimates, but we care more about long-term EPS growth than short-term movements. We also like to analyze expected EPS growth based on Wall Street analysts’ consensus projections, but there is insufficient data.
Key Takeaways from Trinity’s Q1 Results
We were impressed by Trinity’s optimistic full-year EPS guidance, which beat analysts’ expectations. On the other hand, its revenue missed and its EPS fell short of Wall Street’s estimates. Overall, this was a mixed quarter. The stock remained flat at $31.00 immediately following the results.
Big picture, is Trinity a buy here and now? When making that decision, it’s important to consider its valuation, business qualities, as well as what has happened in the latest quarter. We cover that in our actionable full research report which you can read here (it’s free).