Document technology company Xerox (NASDAQ: XRX) beat Wall Street’s revenue expectations in Q1 CY2026, with sales up 26.7% year on year to $1.85 billion. On the other hand, the company’s full-year revenue guidance of $7.5 billion at the midpoint came in 1% below analysts’ estimates. Its non-GAAP loss of $0.43 per share was 56.4% below analysts’ consensus estimates.
Is now the time to buy Xerox? Find out by accessing our full research report, it’s free.
Xerox (XRX) Q1 CY2026 Highlights:
- Revenue: $1.85 billion vs analyst estimates of $1.73 billion (26.7% year-on-year growth, 6.6% beat)
- Adjusted EPS: -$0.43 vs analyst expectations of -$0.27 (56.4% miss)
- Adjusted EBITDA: $36 million vs analyst estimates of $68.48 million (2% margin, 47.4% miss)
- The company reconfirmed its revenue guidance for the full year of $7.5 billion at the midpoint
- Operating Margin: -4%, down from 0.1% in the same quarter last year
- Free Cash Flow was -$165 million compared to -$109 million in the same quarter last year
- Market Capitalization: $205.3 million
“This quarter’s results demonstrated tangible progress as revenue and profit trajectory improved, adjusted1 operating margin expanded, and we further enhanced our liquidity,” said Louie Pastor, chief executive officer at Xerox.
Company Overview
Pioneering the modern office copier and inventing technologies like Ethernet and the laser printer, Xerox (NASDAQ: XRX) provides document management systems, printing technology, and workplace solutions to businesses of all sizes across the globe.
Revenue Growth
A company’s long-term sales performance is one signal of its overall quality. Any business can put up a good quarter or two, but many enduring ones grow for years.
With $7.41 billion in revenue over the past 12 months, Xerox is one of the larger companies in the business services industry and benefits from a well-known brand that influences purchasing decisions. However, its scale is a double-edged sword because finding new avenues for growth becomes difficult when you already have a substantial market presence. For Xerox to boost its sales, it likely needs to adjust its prices, launch new offerings, or lean into foreign markets.
As you can see below, Xerox’s sales grew at a sluggish 1.5% compounded annual growth rate over the last five years. This shows it failed to generate demand in any major way and is a rough starting point for our analysis.
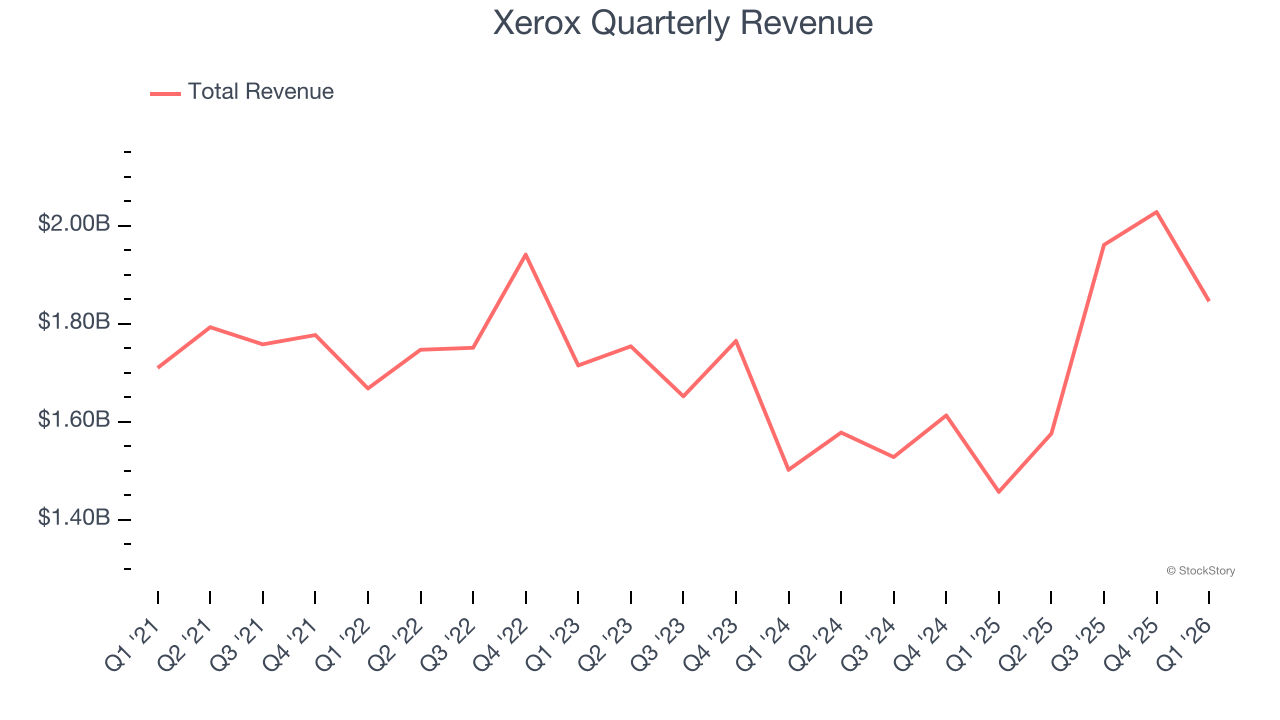
Long-term growth is the most important, but within business services, a half-decade historical view may miss new innovations or demand cycles. Xerox’s annualized revenue growth of 5.4% over the last two years is above its five-year trend, suggesting some bright spots. 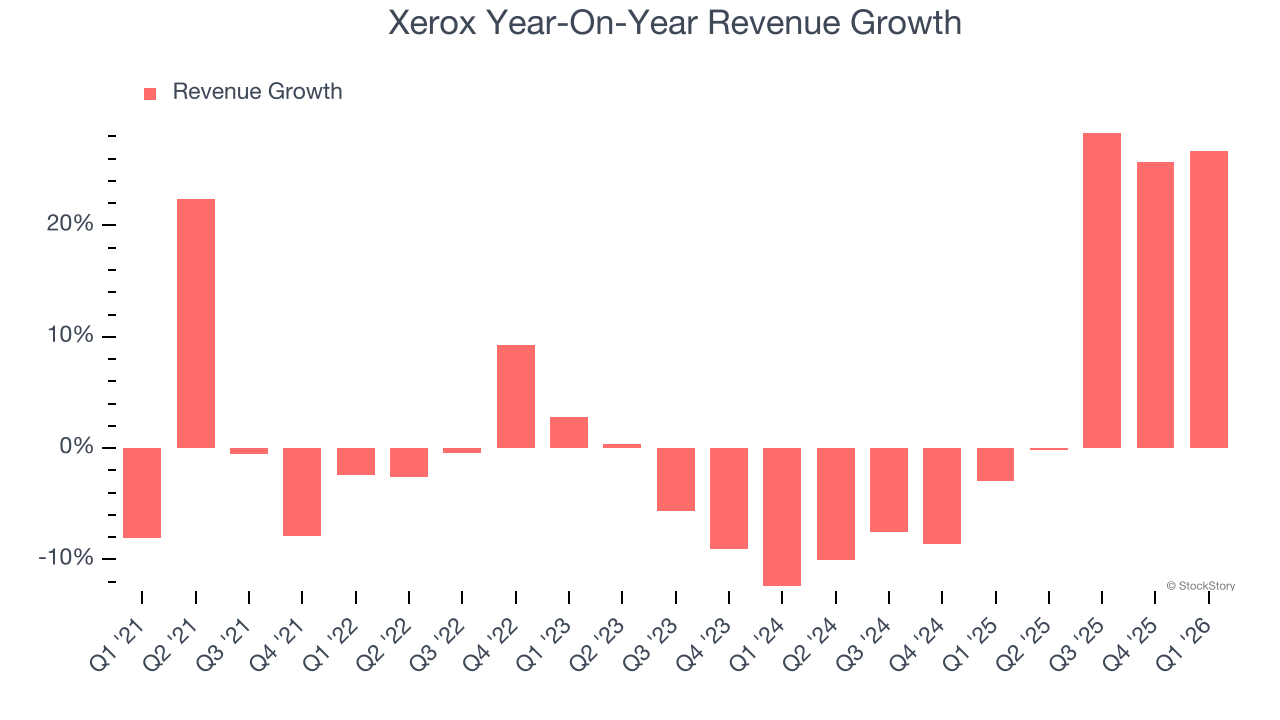
Xerox also breaks out the revenue for its most important segment, Services, Maintenance, Rental Revenue. Over the last two years, Xerox’s Services, Maintenance, Rental Revenue revenue averaged 18.7% year-on-year growth. This segment has outperformed its total sales during the same period, lifting the company’s performance. 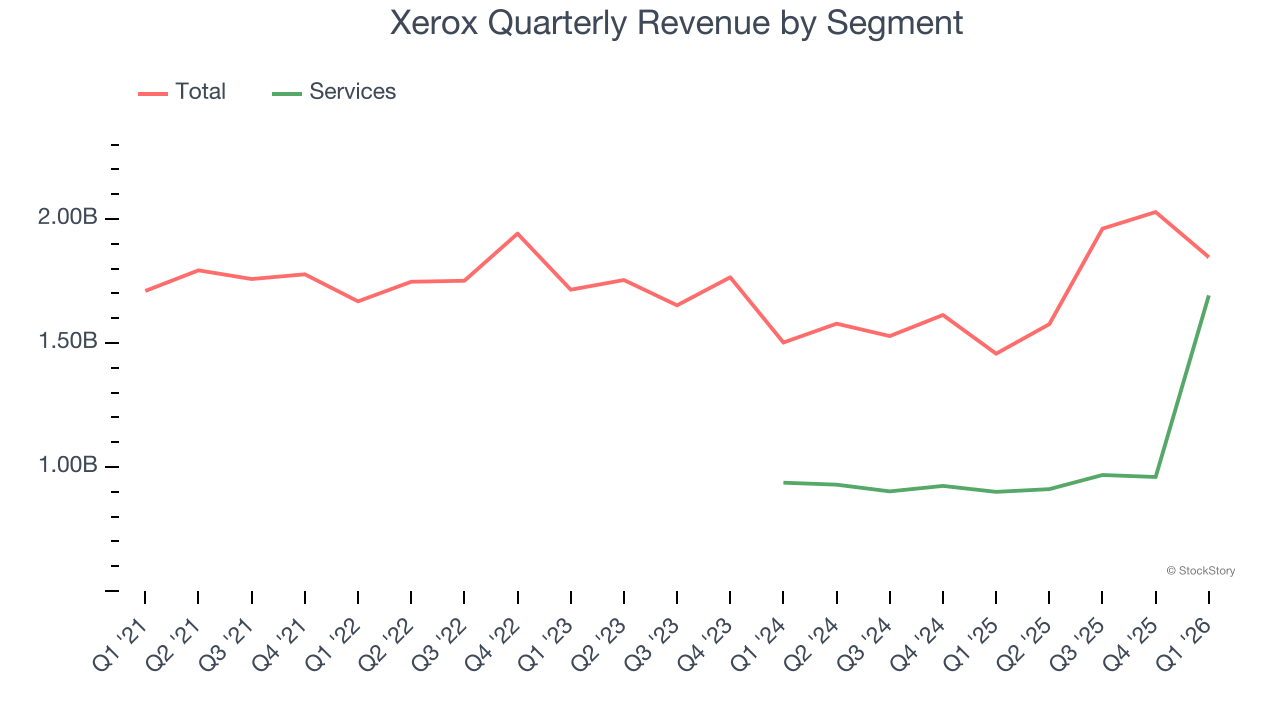
This quarter, Xerox reported robust year-on-year revenue growth of 26.7%, and its $1.85 billion of revenue topped Wall Street estimates by 6.6%.
Looking ahead, sell-side analysts expect revenue to grow 2.1% over the next 12 months, a deceleration versus the last two years. This projection doesn't excite us and implies its products and services will face some demand challenges.
ONE MORE THING: The $21 AI Application Stock Wall Street Forgot. While Wall Street obsesses over who’s building AI, one company is already using it to print money. And nobody’s paying attention.
AI chip stocks trade at ridiculous valuations. This company processes a trillion consumer signals monthly using AI and trades at a third of the price. The gap won’t last. The institutions will figure it out. You need to see this first. Read the FREE Report Before They Notice.
Adjusted Operating Margin
Adjusted operating margin is one of the best measures of profitability because it tells us how much money a company takes home after subtracting all core expenses, like marketing and R&D. It also removes various one-time costs to paint a better picture of normalized profits.
Xerox was profitable over the last five years but held back by its large cost base. Its average adjusted operating margin of 4.2% was weak for a business services business.
Analyzing the trend in its profitability, Xerox’s adjusted operating margin decreased by 1.9 percentage points over the last five years. This raises questions about the company’s expense base because its revenue growth should have given it leverage on its fixed costs, resulting in better economies of scale and profitability. Xerox’s performance was poor no matter how you look at it - it shows that costs were rising and it couldn’t pass them onto its customers.
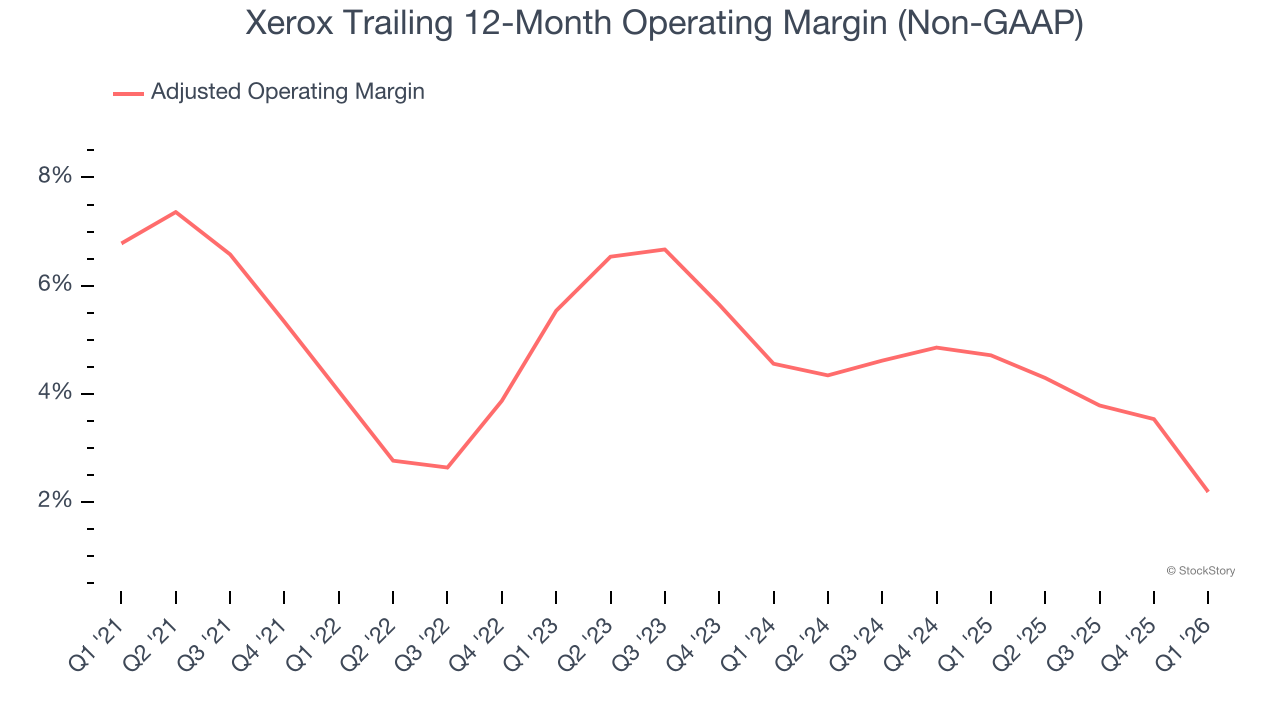
This quarter, Xerox generated an adjusted operating margin profit margin of negative 3.5%, down 5 percentage points year on year. This contraction shows it was less efficient because its expenses grew faster than its revenue.
Earnings Per Share
Revenue trends explain a company’s historical growth, but the long-term change in earnings per share (EPS) points to the profitability of that growth – for example, a company could inflate its sales through excessive spending on advertising and promotions.
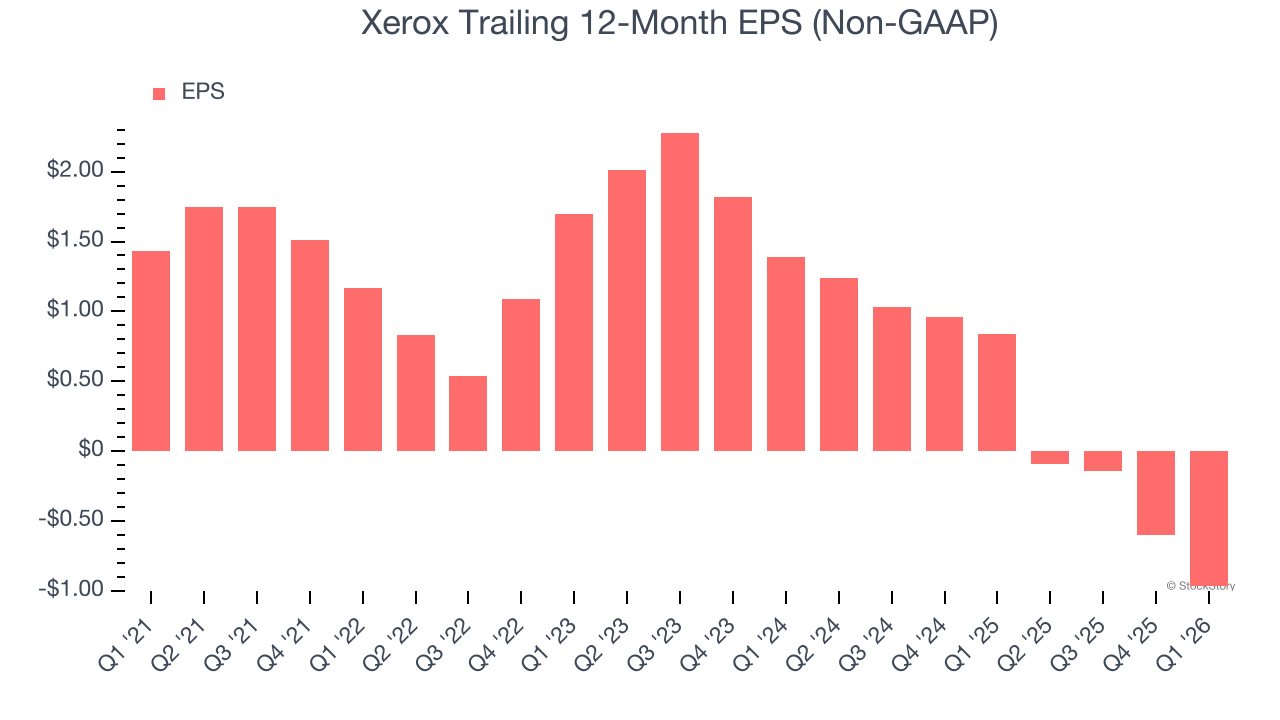
Sadly for Xerox, its EPS declined by 21.8% annually over the last five years while its revenue grew by 1.5%. This tells us the company became less profitable on a per-share basis as it expanded due to non-fundamental factors such as interest expenses and taxes.
We can take a deeper look into Xerox’s earnings to better understand the drivers of its performance. As we mentioned earlier, Xerox’s adjusted operating margin declined by 1.9 percentage points over the last five years. This was the most relevant factor (aside from the revenue impact) behind its lower earnings; interest expenses and taxes can also affect EPS but don’t tell us as much about a company’s fundamentals.
Like with revenue, we analyze EPS over a shorter period to see if we are missing a change in the business.
For Xerox, its two-year annual EPS declines of 64.3% show it’s continued to underperform. These results were bad no matter how you slice the data.
In Q1, Xerox reported adjusted EPS of negative $0.43, down from negative $0.06 in the same quarter last year. This print missed analysts’ estimates. We also like to analyze expected EPS growth based on Wall Street analysts’ consensus projections, but there is insufficient data.
Key Takeaways from Xerox’s Q1 Results
We were impressed by how significantly Xerox blew past analysts’ revenue expectations this quarter. On the other hand, its EPS missed and its full-year revenue guidance fell slightly short of Wall Street’s estimates. Overall, this quarter could have been better. Still, the stock traded up 5.9% to $1.67 immediately after reporting.
Should you buy the stock or not? If you’re making that decision, you should consider the bigger picture of valuation, business qualities, as well as the latest earnings. We cover that in our actionable full research report which you can read here (it’s free).