

Lifting and material handling equipment company Terex (NYSE: TEX) reported Q1 CY2026 results exceeding the market’s revenue expectations, with sales up 41.1% year on year to $1.73 billion. On the other hand, the company’s full-year revenue guidance of $7.8 billion at the midpoint came in 1.5% below analysts’ estimates. Its GAAP loss of $0.93 per share was significantly below analysts’ consensus estimates.
Is now the time to buy Terex? Find out by accessing our full research report, it’s free.
Terex (TEX) Q1 CY2026 Highlights:
- Revenue: $1.73 billion vs analyst estimates of $1.69 billion (41.1% year-on-year growth, 2.6% beat)
- EPS (GAAP): -$0.93 vs analyst estimates of $0.73 (significant miss)
- Adjusted EBITDA: $173 million vs analyst estimates of $172.8 million (10% margin, in line)
- The company reconfirmed its revenue guidance for the full year of $7.8 billion at the midpoint
- EPS (GAAP) guidance for the full year is $4.75 at the midpoint, beating analyst estimates by 4.2%
- EBITDA guidance for the full year is $965 million at the midpoint, below analyst estimates of $983.4 million
- Operating Margin: -4.7%, down from 5.6% in the same quarter last year
- Free Cash Flow was -$57 million compared to -$57 million in the same quarter last year
- Market Capitalization: $7.07 billion
Company Overview
With humble beginnings as a dump truck company, Terex (NYSE: TEX) today manufactures lifting and material handling equipment designed to move and hoist heavy goods and materials.
Revenue Growth
A company’s long-term sales performance can indicate its overall quality. Any business can experience short-term success, but top-performing ones enjoy sustained growth for years. Thankfully, Terex’s 13.8% annualized revenue growth over the last five years was exceptional. Its growth beat the average industrials company and shows its offerings resonate with customers.
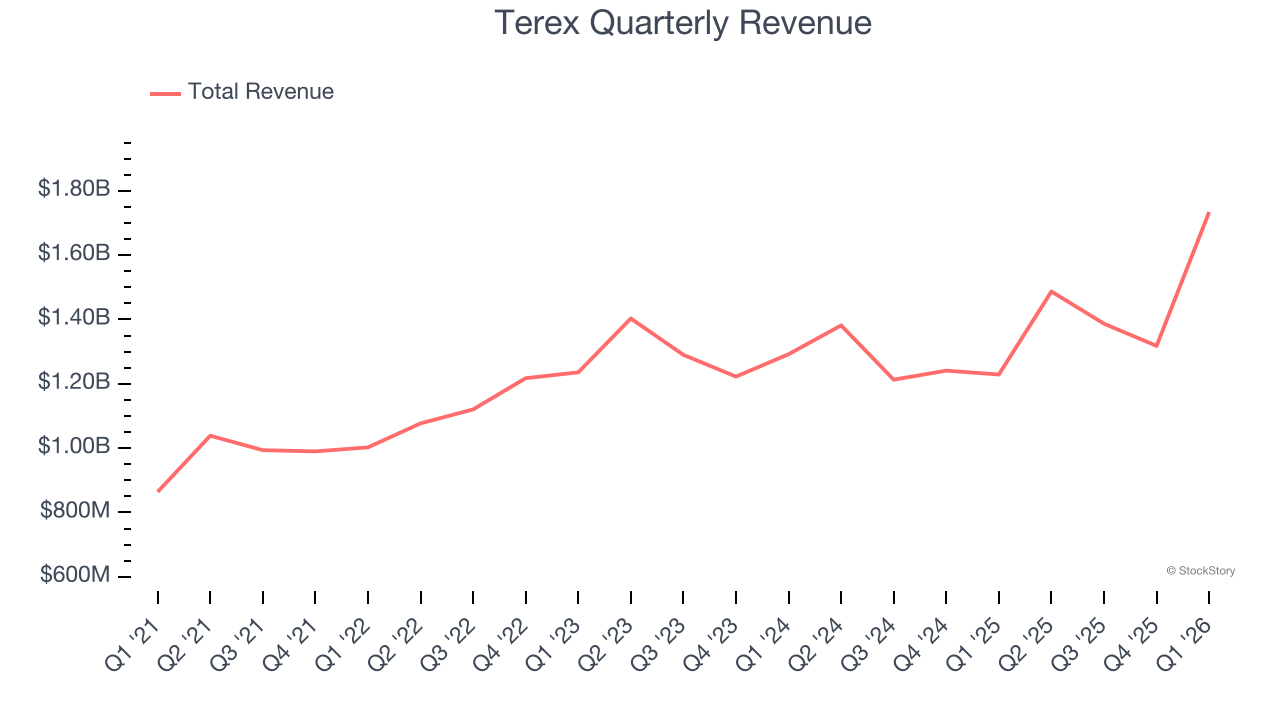
We at StockStory place the most emphasis on long-term growth, but within industrials, a half-decade historical view may miss cycles, industry trends, or a company capitalizing on catalysts such as a new contract win or a successful product line. Terex’s recent performance shows its demand has slowed significantly as its annualized revenue growth of 6.7% over the last two years was well below its five-year trend. 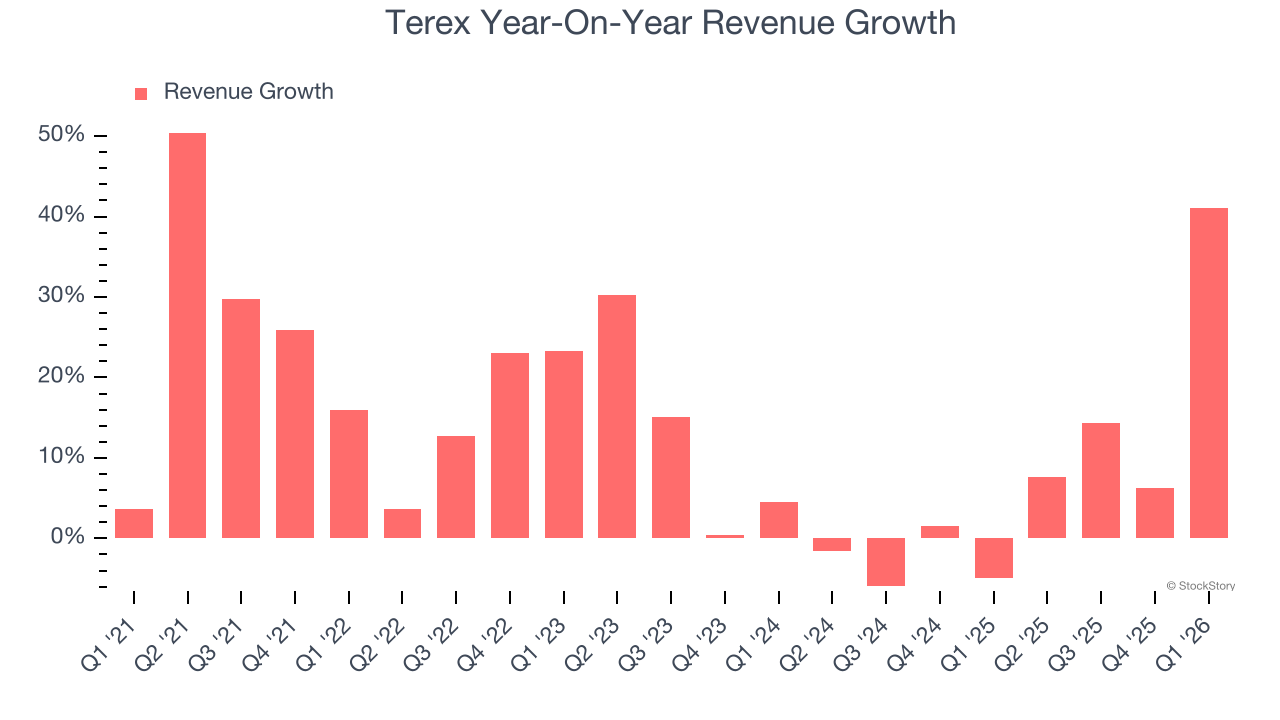
This quarter, Terex reported magnificent year-on-year revenue growth of 41.1%, and its $1.73 billion of revenue beat Wall Street’s estimates by 2.6%.
Looking ahead, sell-side analysts expect revenue to grow 38.9% over the next 12 months, an improvement versus the last two years. This projection is eye-popping and indicates its newer products and services will catalyze better top-line performance.
WHILE YOU’RE HERE: The Next Palantir? One satellite company captures images of every point on Earth. Every single day. The Pentagon wants it. Hedge funds are using it to beat earnings. You’ve probably never heard of it.
This is what the early days of Palantir looked like before it became a $437 billion giant. Same playbook. Different technology. If you missed Palantir, you need to see this. Claim The Stock Ticker for Free HERE.
Operating Margin
Terex has managed its cost base well over the last five years. It demonstrated solid profitability for an industrials business, producing an average operating margin of 10%. This result was particularly impressive because of its low gross margin, which is mostly a factor of what it sells and takes huge shifts to move meaningfully. Companies have more control over their operating margins, and it’s a show of well-managed operations if they’re high when gross margins are low.
Analyzing the trend in its profitability, Terex’s operating margin decreased by 3.5 percentage points over the last five years. This raises questions about the company’s expense base because its revenue growth should have given it leverage on its fixed costs, resulting in better economies of scale and profitability.
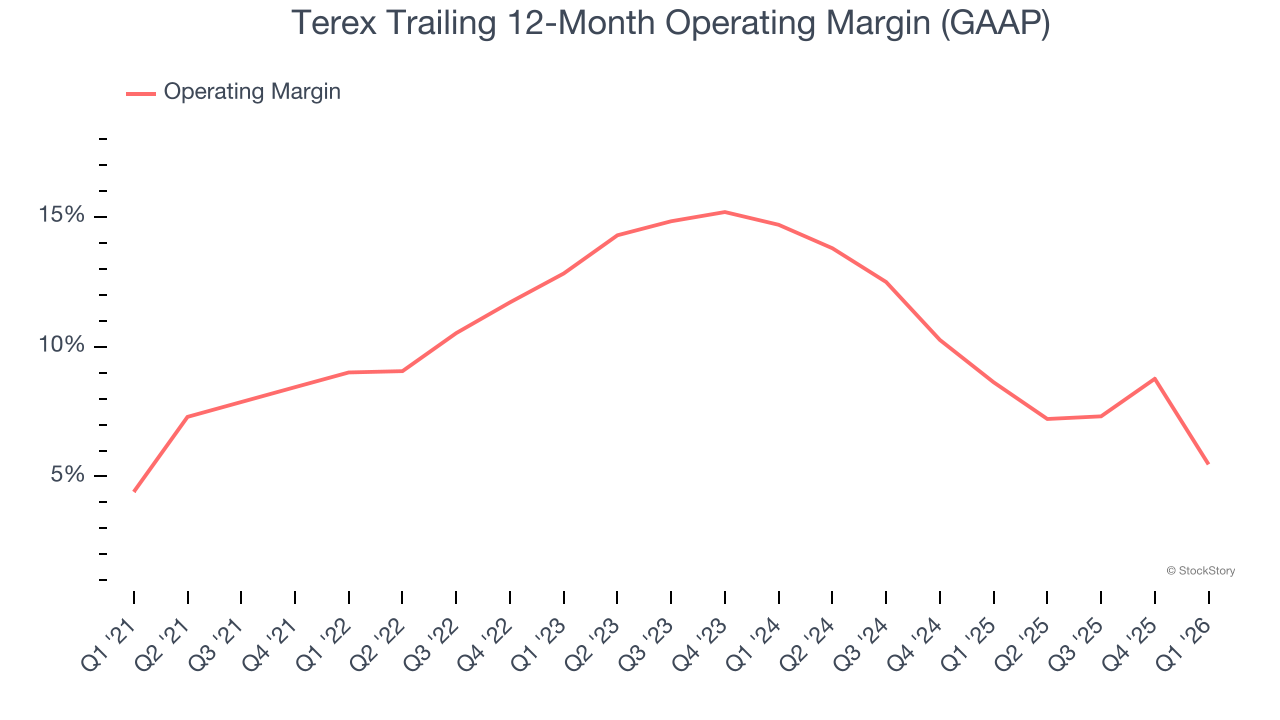
In Q1, Terex generated an operating margin profit margin of negative 4.7%, down 10.3 percentage points year on year. Since Terex’s operating margin decreased more than its gross margin, we can assume it was less efficient because expenses such as marketing, R&D, and administrative overhead increased.
Earnings Per Share
Revenue trends explain a company’s historical growth, but the long-term change in earnings per share (EPS) points to the profitability of that growth – for example, a company could inflate its sales through excessive spending on advertising and promotions.
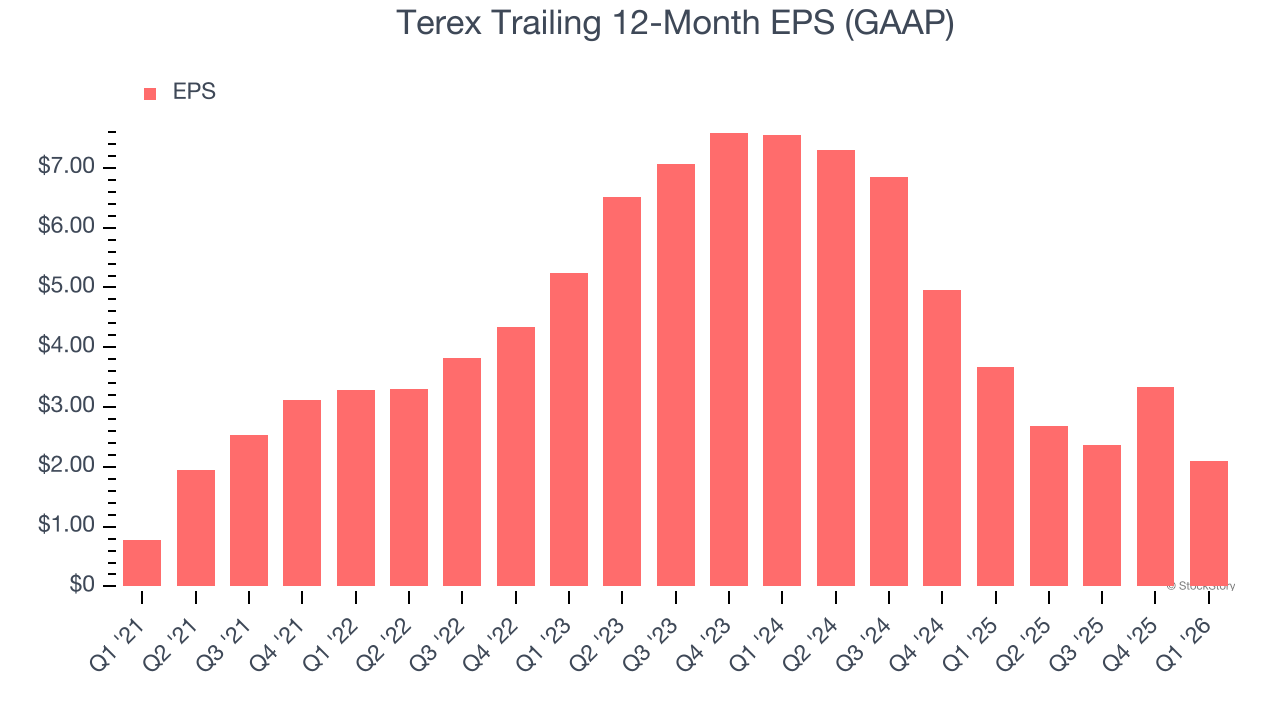
Terex’s EPS grew at 22.2% compounded annual growth rate over the last five years, higher than its 13.8% annualized revenue growth. However, we take this with a grain of salt because its operating margin didn’t improve and it didn’t repurchase its shares, meaning the delta came from reduced interest expenses or taxes.
Like with revenue, we analyze EPS over a more recent period because it can provide insight into an emerging theme or development for the business.
Terex’s two-year annual EPS declines of 47.3% were bad and lower than its 6.7% two-year revenue growth.
Diving into the nuances of Terex’s earnings can give us a better understanding of its performance. Terex’s operating margin has declined over the last two yearswhile its share count has grown 41.5%. This means the company not only became less efficient with its operating expenses but also diluted its shareholders. 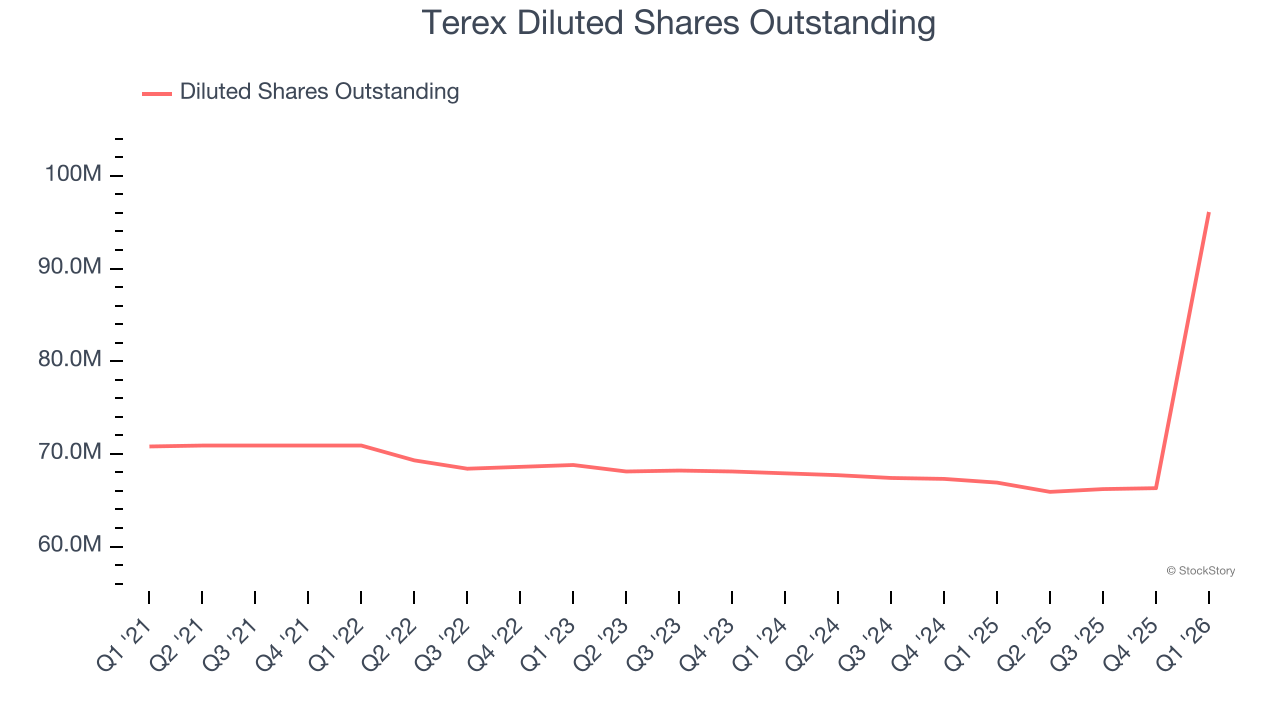
In Q1, Terex reported EPS of negative $0.93, down from $0.31 in the same quarter last year. This print missed analysts’ estimates, but we care more about long-term EPS growth than short-term movements. Over the next 12 months, Wall Street expects Terex’s full-year EPS of $2.09 to grow 134%.
Key Takeaways from Terex’s Q1 Results
We enjoyed seeing Terex beat analysts’ revenue expectations this quarter. On the other hand, its EPS fell short of Wall Street’s estimates. Looking ahead, full-year EBITDA and EPS guidance also fell below expectations. Overall, this was a softer quarter. The stock remained flat at $62.15 immediately after reporting.
Terex didn’t show it’s best hand this quarter, but does that create an opportunity to buy the stock right now? What happened in the latest quarter matters, but not as much as longer-term business quality and valuation, when deciding whether to invest in this stock. We cover that in our actionable full research report which you can read here (it’s free).


