

Semi trailers and liquid transportation container manufacturer Wabash (NYSE: WNC) missed Wall Street’s revenue expectations in Q1 CY2026, with sales falling 20.4% year on year to $303.2 million. On the other hand, the company expects next quarter’s revenue to be around $390 million, close to analysts’ estimates. Its non-GAAP loss of $1.17 per share was 15.9% below analysts’ consensus estimates.
Is now the time to buy Wabash? Find out by accessing our full research report, it’s free.
Wabash (WNC) Q1 CY2026 Highlights:
- Revenue: $303.2 million vs analyst estimates of $319 million (20.4% year-on-year decline, 5% miss)
- Adjusted EPS: -$1.17 vs analyst expectations of -$1.01 (15.9% miss)
- Adjusted EBITDA: -$38.03 million (-12.5% margin, 180% year-on-year decline)
- Revenue Guidance for Q2 CY2026 is $390 million at the midpoint, roughly in line with what analysts were expecting
- Adjusted EPS guidance for Q2 CY2026 is -$0.50 at the midpoint, below analyst estimates of -$0.31
- Adjusted EBITDA Margin: -12.5%, down from -3.6% in the same quarter last year
- Free Cash Flow was -$37.31 million compared to -$22.78 million in the same quarter last year
- Backlog: $837 million at quarter end, down 30.3% year on year
- Market Capitalization: $353.5 million
Company Overview
With its first trailer reportedly built on two sawhorses, Wabash (NYSE: WNC) offers semi trailers, liquid transportation containers, truck bodies, and equipment for moving goods.
Revenue Growth
Examining a company’s long-term performance can provide clues about its quality. Any business can have short-term success, but a top-tier one grows for years. Unfortunately, Wabash struggled to consistently increase demand as its $1.47 billion of sales for the trailing 12 months was close to its revenue five years ago. This wasn’t a great result and is a sign of poor business quality.
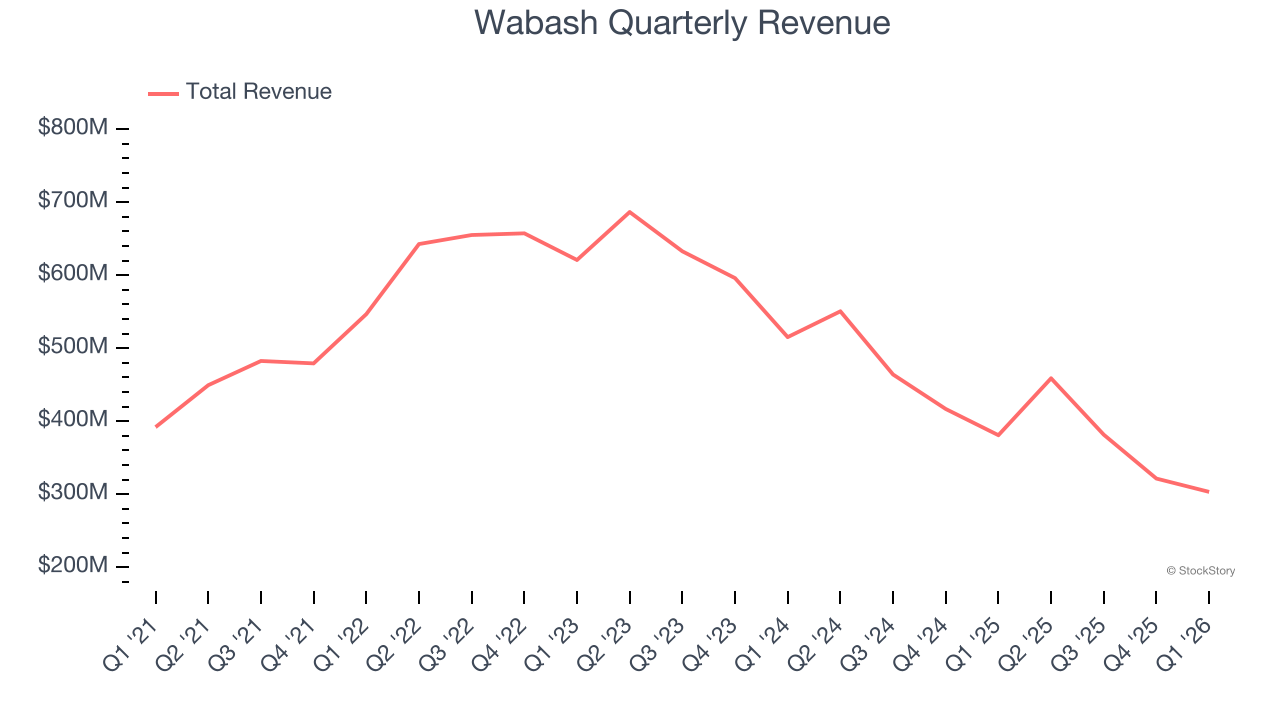
We at StockStory place the most emphasis on long-term growth, but within industrials, a half-decade historical view may miss cycles, industry trends, or a company capitalizing on catalysts such as a new contract win or a successful product line. Wabash’s recent performance shows its demand remained suppressed as its revenue has declined by 22.4% annually over the last two years. 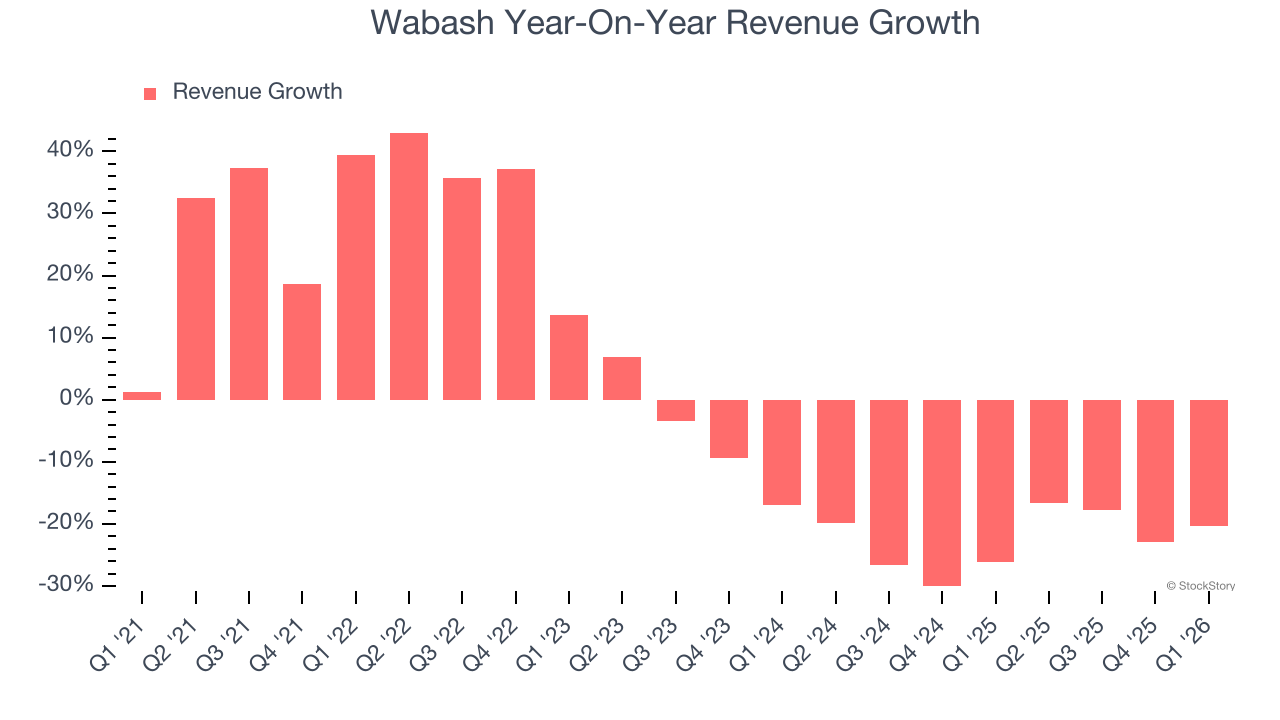
We can dig further into the company’s revenue dynamics by analyzing its backlog, or the value of its outstanding orders that have not yet been executed or delivered. Wabash’s backlog reached $837 million in the latest quarter and averaged 29% year-on-year declines over the last two years. Because this number is lower than its revenue growth, we can see the company hasn’t secured enough new orders to maintain its growth rate in the future. 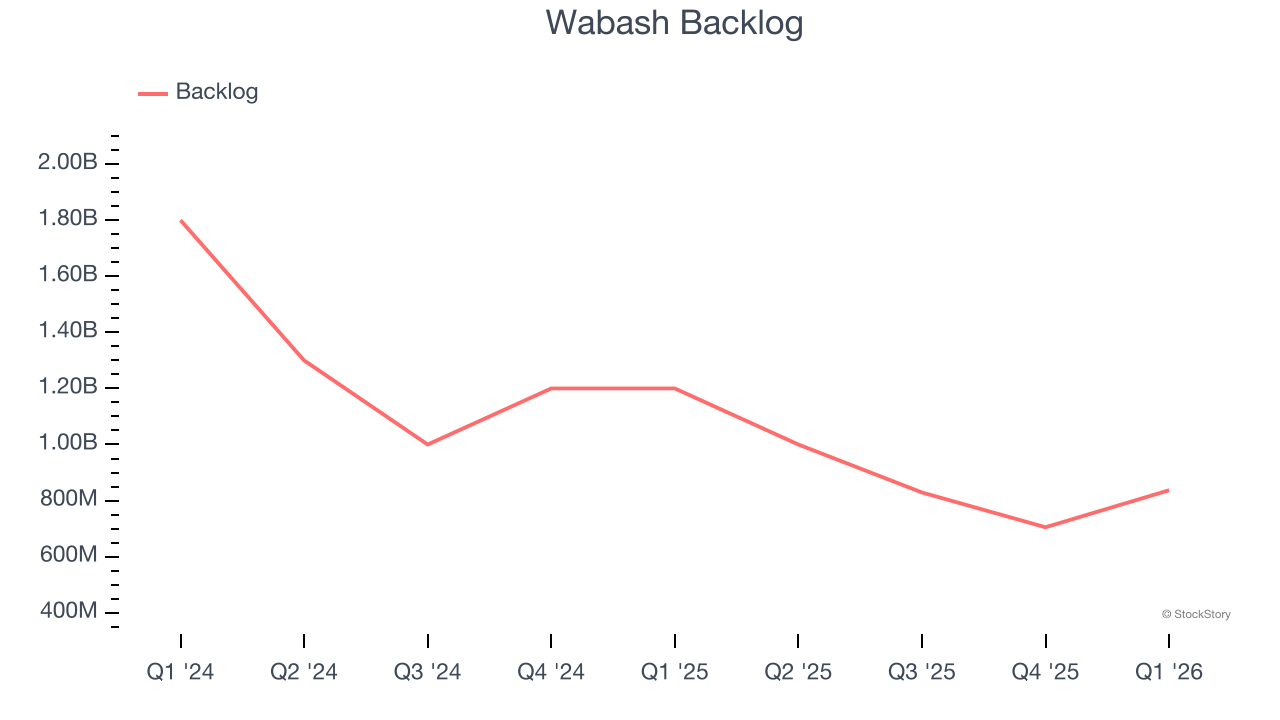
This quarter, Wabash missed Wall Street’s estimates and reported a rather uninspiring 20.4% year-on-year revenue decline, generating $303.2 million of revenue. Company management is currently guiding for a 15% year-on-year decline in sales next quarter.
Looking further ahead, sell-side analysts expect revenue to grow 12.6% over the next 12 months, an improvement versus the last two years. This projection is commendable and indicates its newer products and services will catalyze better top-line performance.
WHILE YOU’RE HERE: The Next Palantir? One satellite company captures images of every point on Earth. Every single day. The Pentagon wants it. Hedge funds are using it to beat earnings. You’ve probably never heard of it.
This is what the early days of Palantir looked like before it became a $437 billion giant. Same playbook. Different technology. If you missed Palantir, you need to see this. Claim The Stock Ticker for Free HERE.
Operating Margin
Operating margin is one of the best measures of profitability because it tells us how much money a company takes home after procuring and manufacturing its products, marketing and selling those products, and most importantly, keeping them relevant through research and development.
Wabash was profitable over the last five years but held back by its large cost base. Its average operating margin of 3.9% was weak for an industrials business. This result isn’t too surprising given its low gross margin as a starting point.
Analyzing the trend in its profitability, Wabash’s operating margin decreased by 6.2 percentage points over the last five years. Wabash’s performance was poor no matter how you look at it - it shows that costs were rising and it couldn’t pass them onto its customers.
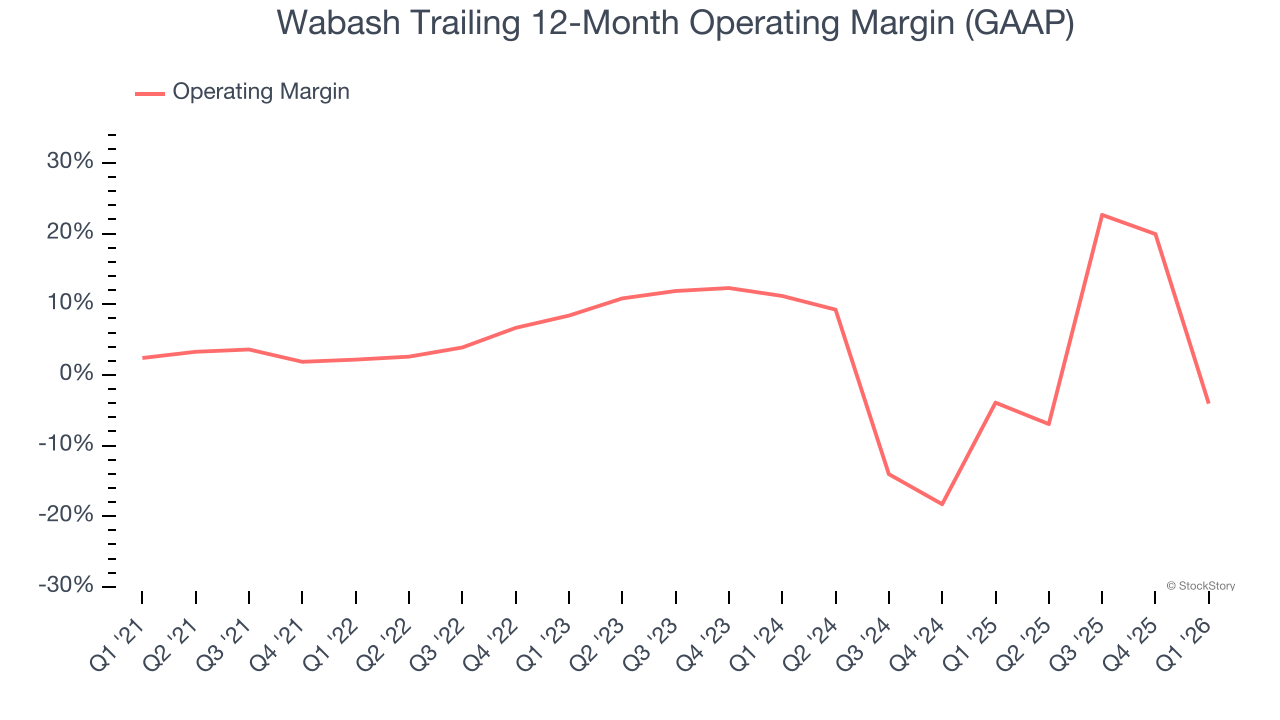
In Q1, Wabash generated an operating margin profit margin of negative 17.3%, down 99.9 percentage points year on year. Since Wabash’s operating margin decreased more than its gross margin, we can assume it was less efficient because expenses such as marketing, R&D, and administrative overhead increased.
Earnings Per Share
Revenue trends explain a company’s historical growth, but the long-term change in earnings per share (EPS) points to the profitability of that growth – for example, a company could inflate its sales through excessive spending on advertising and promotions.
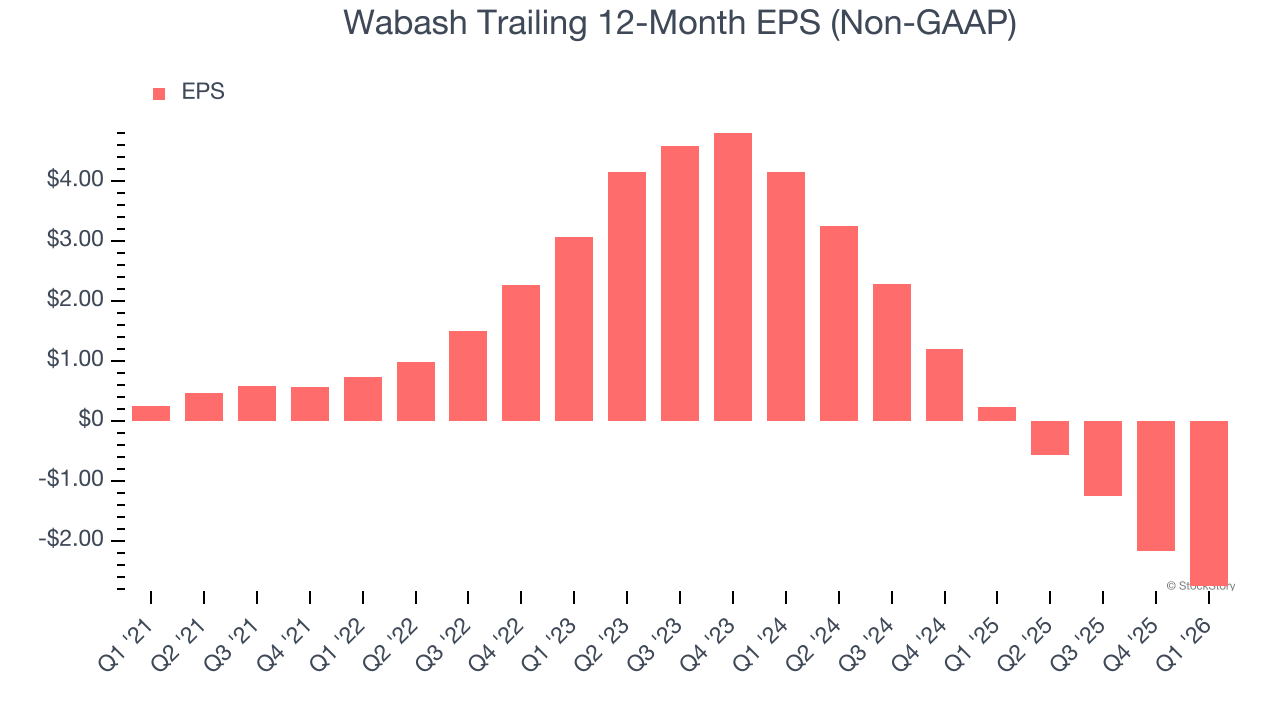
Sadly for Wabash, its EPS declined by 67.1% annually over the last five years while its revenue was flat. This tells us the company struggled because its fixed cost base made it difficult to adjust to choppy demand.
We can take a deeper look into Wabash’s earnings to better understand the drivers of its performance. As we mentioned earlier, Wabash’s operating margin declined by 6.2 percentage points over the last five years. This was the most relevant factor (aside from the revenue impact) behind its lower earnings; interest expenses and taxes can also affect EPS but don’t tell us as much about a company’s fundamentals.
Like with revenue, we analyze EPS over a more recent period because it can provide insight into an emerging theme or development for the business.
For Wabash, its two-year annual EPS declines of 63.2% show it’s still underperforming. These results were bad no matter how you slice the data.
In Q1, Wabash reported adjusted EPS of negative $1.17, down from negative $0.58 in the same quarter last year. This print missed analysts’ estimates. We also like to analyze expected EPS growth based on Wall Street analysts’ consensus projections, but there is insufficient data.
Key Takeaways from Wabash’s Q1 Results
It was good to see Wabash narrowly top analysts’ adjusted operating income expectations this quarter. On the other hand, its revenue missed and its EBITDA fell short of Wall Street’s estimates. Overall, this was a weaker quarter. The stock traded down 3.4% to $8.39 immediately after reporting.
Wabash’s latest earnings report disappointed. One quarter doesn’t define a company’s quality, so let’s explore whether the stock is a buy at the current price. The latest quarter does matter, but not nearly as much as longer-term fundamentals and valuation, when deciding if the stock is a buy. We cover that in our actionable full research report which you can read here (it’s free).


