

Medical lens company STAAR Surgical (NASDAQ: STAA) reported Q1 CY2026 results exceeding the market’s revenue expectations, with sales up 120% year on year to $93.52 million. Its GAAP profit of $0.10 per share was significantly above analysts’ consensus estimates.
Is now the time to buy STAAR Surgical? Find out by accessing our full research report, it’s free.
STAAR Surgical (STAA) Q1 CY2026 Highlights:
- Revenue: $93.52 million vs analyst estimates of $77.44 million (120% year-on-year growth, 20.8% beat)
- EPS (GAAP): $0.10 vs analyst estimates of $0.01 (significant beat)
- Adjusted EBITDA: $24.44 million vs analyst estimates of $9.02 million (26.1% margin, significant beat)
- Operating Margin: 8.5%, up from -135% in the same quarter last year
- Free Cash Flow was -$22.14 million compared to -$7.20 million in the same quarter last year
- Market Capitalization: $1.40 billion
Company Overview
With over 2.5 million implants performed worldwide, STAAR Surgical (NASDAQ: STAA) designs and manufactures implantable lenses that correct vision problems without removing the eye's natural lens.
Revenue Growth
Examining a company’s long-term performance can provide clues about its quality. Any business can have short-term success, but a top-tier one grows for years. Thankfully, STAAR Surgical’s 10.2% annualized revenue growth over the last five years was decent. Its growth was slightly above the average healthcare company and shows its offerings resonate with customers.
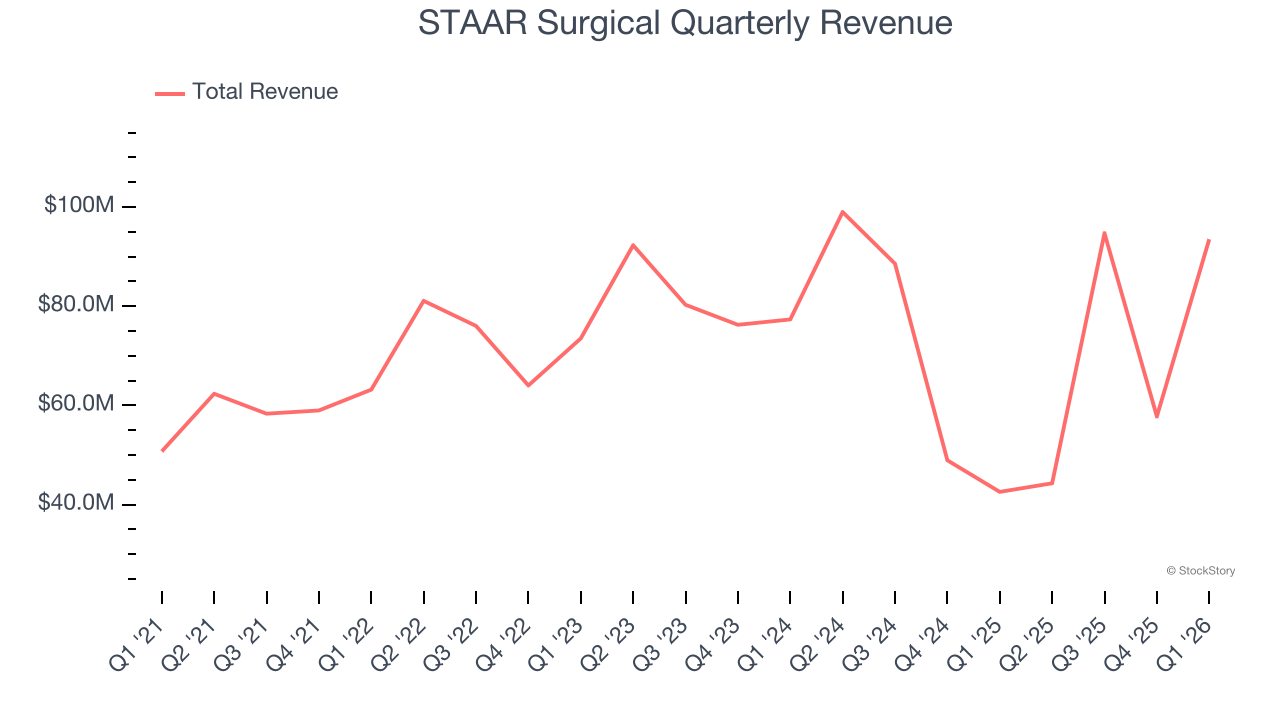
Long-term growth is the most important, but within healthcare, a half-decade historical view may miss new innovations or demand cycles. STAAR Surgical’s recent performance marks a sharp pivot from its five-year trend as its revenue has shown annualized declines of 5.7% over the last two years. 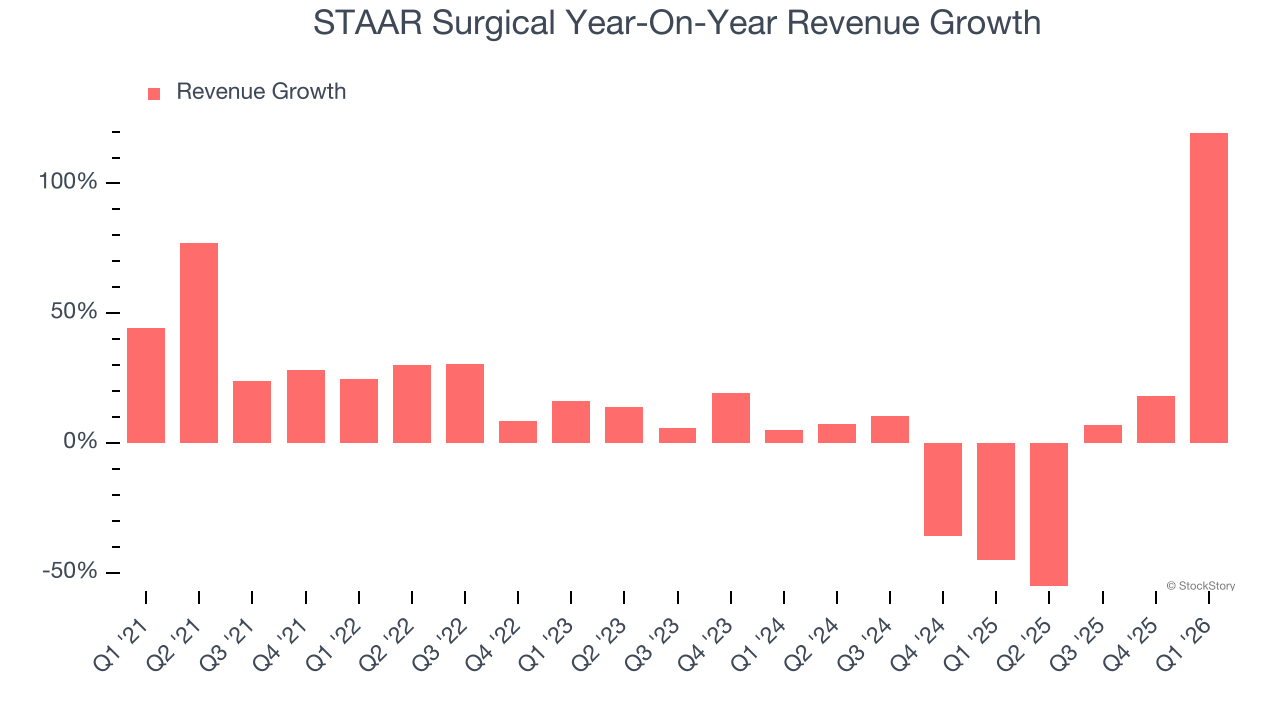
This quarter, STAAR Surgical reported magnificent year-on-year revenue growth of 120%, and its $93.52 million of revenue beat Wall Street’s estimates by 20.8%.
Looking ahead, sell-side analysts expect revenue to grow 7.1% over the next 12 months, an improvement versus the last two years. This projection is above the sector average and suggests its newer products and services will spur better top-line performance.
WHILE YOU’RE HERE: The Next Palantir? One satellite company captures images of every point on Earth. Every single day. The Pentagon wants it. Hedge funds are using it to beat earnings. You’ve probably never heard of it.
This is what the early days of Palantir looked like before it became a $437 billion giant. Same playbook. Different technology. If you missed Palantir, you need to see this. Claim The Stock Ticker for Free HERE.
Adjusted Operating Margin
Adjusted operating margin is one of the best measures of profitability because it tells us how much money a company takes home after subtracting all core expenses, like marketing and R&D. It also removes various one-time costs to paint a better picture of normalized profits.
STAAR Surgical was roughly breakeven when averaging the last five years of quarterly operating profits, lousy for a healthcare business.
Looking at the trend in its profitability, STAAR Surgical’s adjusted operating margin decreased by 23 percentage points over the last five years. The company’s two-year trajectory also shows it failed to get its profitability back to the peak as its margin fell by 14.5 percentage points. This performance was poor no matter how you look at it - it shows its expenses were rising and it couldn’t pass those costs onto its customers.
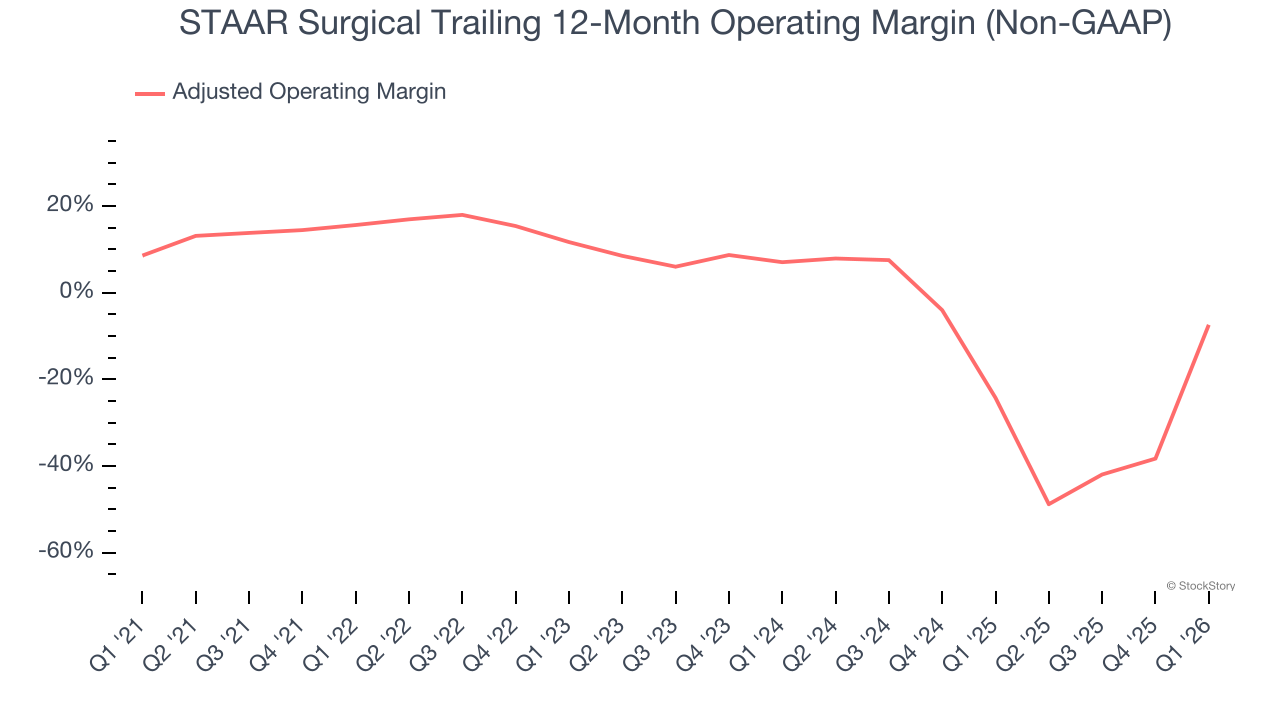
In Q1, STAAR Surgical generated an adjusted operating margin profit margin of 13.7%, up 148.5 percentage points year on year. This increase was a welcome development and shows it was more efficient.
Earnings Per Share
We track the long-term change in earnings per share (EPS) for the same reason as long-term revenue growth. Compared to revenue, however, EPS highlights whether a company’s growth is profitable.
Sadly for STAAR Surgical, its EPS declined by 31.4% annually over the last five years while its revenue grew by 10.2%. This tells us the company became less profitable on a per-share basis as it expanded.
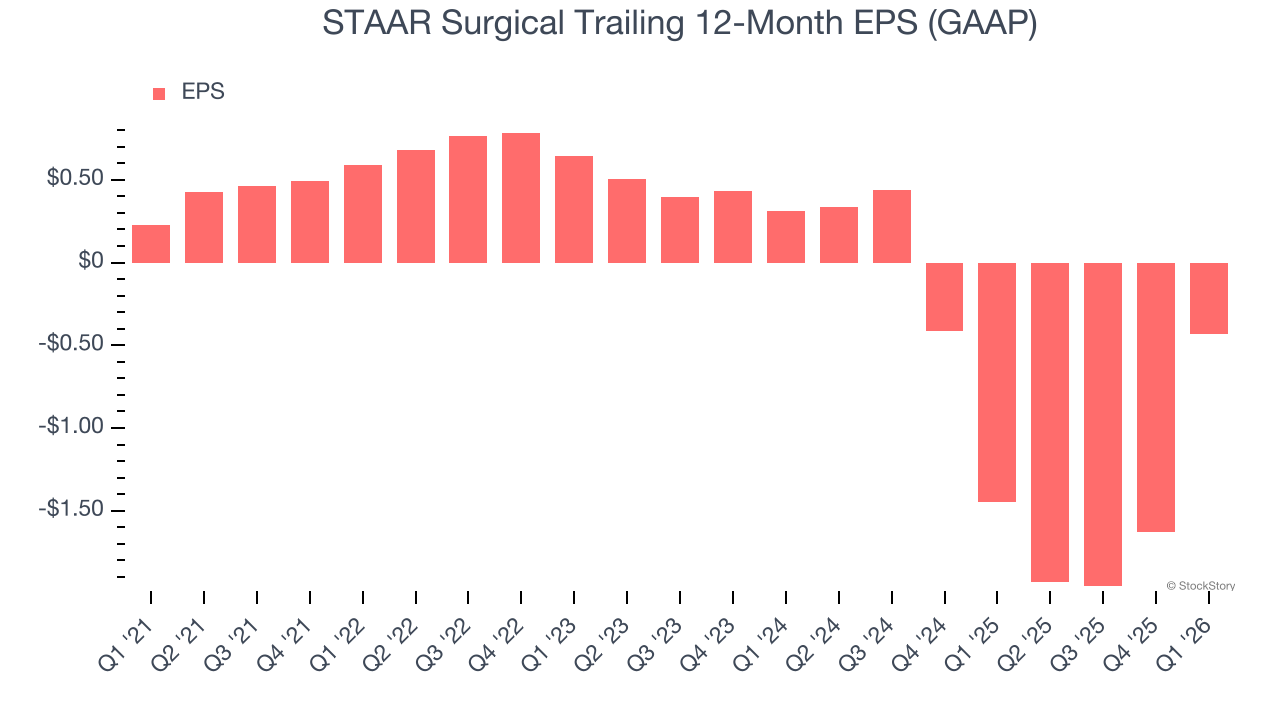
Diving into the nuances of STAAR Surgical’s earnings can give us a better understanding of its performance. As we mentioned earlier, STAAR Surgical’s adjusted operating margin expanded this quarter but declined by 23 percentage points over the last five years. Its share count also grew by 3.4%, meaning the company not only became less efficient with its operating expenses but also diluted its shareholders. 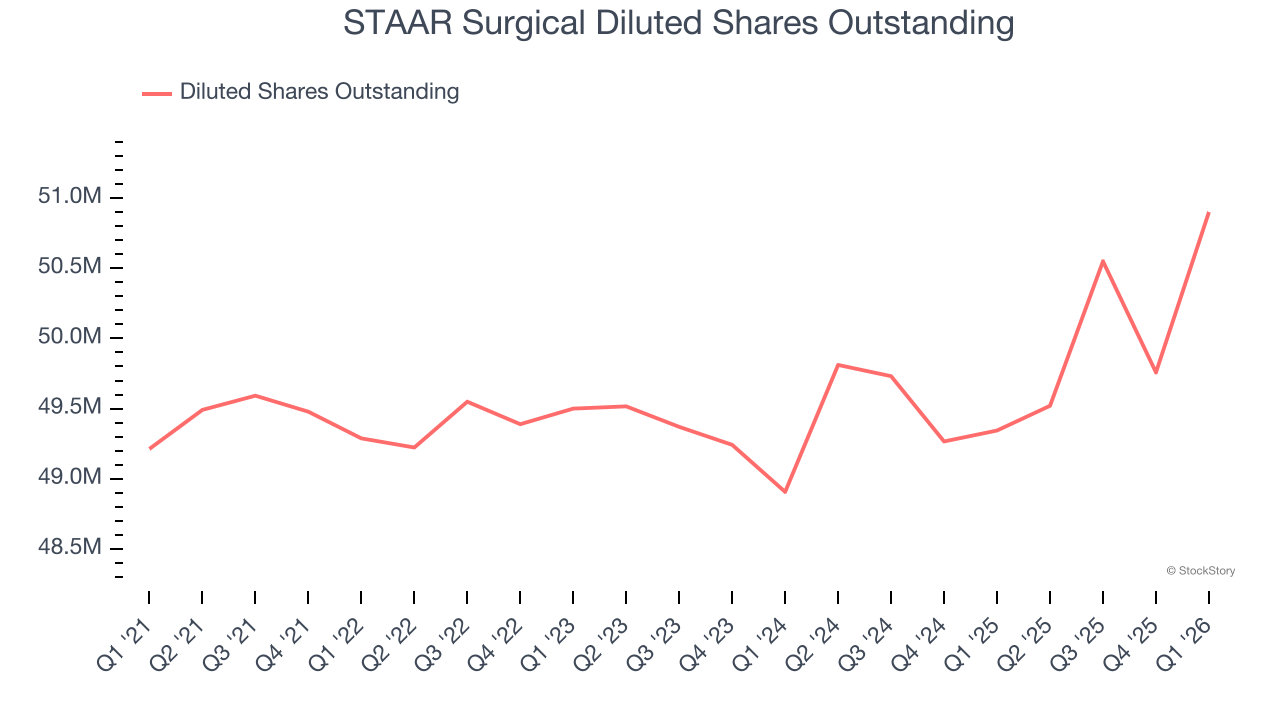
In Q1, STAAR Surgical reported EPS of $0.10, up from negative $1.10 in the same quarter last year. This print easily cleared analysts’ estimates, and shareholders should be content with the results. Over the next 12 months, Wall Street is optimistic. Analysts forecast STAAR Surgical’s full-year EPS of negative $0.43 will flip to positive $0.22.
Key Takeaways from STAAR Surgical’s Q1 Results
It was good to see STAAR Surgical beat analysts’ EPS expectations this quarter. We were also excited its revenue outperformed Wall Street’s estimates by a wide margin. Zooming out, we think this was a good print with some key areas of upside. The stock traded up 18.3% to $34.77 immediately after reporting.
STAAR Surgical may have had a good quarter, but does that mean you should invest right now? What happened in the latest quarter matters, but not as much as longer-term business quality and valuation, when deciding whether to invest in this stock. We cover that in our actionable full research report which you can read here (it’s free).


