
RV manufacturer Thor Industries (NYSE: THO) reported revenue ahead of Wall Street’s expectations in Q1 CY2026, but sales fell by 3.9% year on year to $2.78 billion. On the other hand, the company’s full-year revenue guidance of $9.25 billion at the midpoint came in 3% below analysts’ estimates. Its GAAP profit of $1.86 per share was 3.8% below analysts’ consensus estimates.
Is now the time to buy THOR Industries? Find out by accessing our full research report, it’s free.
THOR Industries (THO) Q1 CY2026 Highlights:
- Revenue: $2.78 billion vs analyst estimates of $2.65 billion (3.9% year-on-year decline, 4.8% beat)
- EPS (GAAP): $1.86 vs analyst expectations of $1.93 (3.8% miss)
- Adjusted EBITDA: $183.6 million vs analyst estimates of $217.9 million (6.6% margin, 15.8% miss)
- The company reconfirmed its revenue guidance for the full year of $9.25 billion at the midpoint
- EPS (GAAP) guidance for the full year is $3.55 at the midpoint, missing analyst estimates by 12.8%
- Operating Margin: 4.5%, down from 6.1% in the same quarter last year
- Market Capitalization: $4.08 billion
"At the end of our fiscal second quarter, we correctly identified the risk of geopolitical events having an adverse impact on the RV selling season. The consequences of this risk coming to fruition during our fiscal third quarter have exceeded the expectations of our industry due to the unforeseen duration of these macroeconomic influences and their impact on consumer sentiment and material costs. In particular, our North American Towable segment has confronted both suppressed volumes due to strained consumer sentiment and rising material costs brought on by tariff and inflationary pressures. Despite these challenges, we are focused on executing our strategy within any economic environment. Our fiscal third quarter results demonstrate the steadfastness of our teams as we navigate this challenging macroeconomic backdrop. Our North American Motorized and European segment results showed resilience and illustrate an enduring interest in the RV lifestyle, with fiscal 2026 third quarter Motorized net sales up 7.7% and European net sales up 3.6% on a constant currency basis compared to the prior-year period. We remain committed to diligently managing our business and better positioning it for the near-term RV landscape as we wait for resolutions to macroeconomic headwinds and an inflection in consumer confidence and the retail market. Our previously announced strategic realignment of our North American RV operations is well under way with management team assessments largely complete and initiatives ready to be implemented. Our operations in both North America and Europe continue to be streamlined while also delivering innovative and refreshed products. We have invested heavily in growing our owned supplier businesses to further diversify our revenue streams within the RV market and provide optionality as a trusted partner within the supplier landscape. Our future is bright, supported by the strong foundation we have built and the operational efficiencies we continue to pursue," stated Bob Martin, President and Chief Executive Officer of THOR Industries.
Company Overview
Created through the acquisition and merger of various RV manufacturers, THOR Industries manufactures and sells a range of recreational vehicles, including motorhomes and travel trailers, catering to consumers seeking the freedom and comfort of the RV lifestyle.
Revenue Growth
A company’s long-term performance is an indicator of its overall quality. Any business can experience short-term success, but top-performing ones enjoy sustained growth for years. Over the last five years, THOR Industries’s demand was weak and its revenue declined by 2.3% per year. This wasn’t a great result and is a sign of poor business quality.
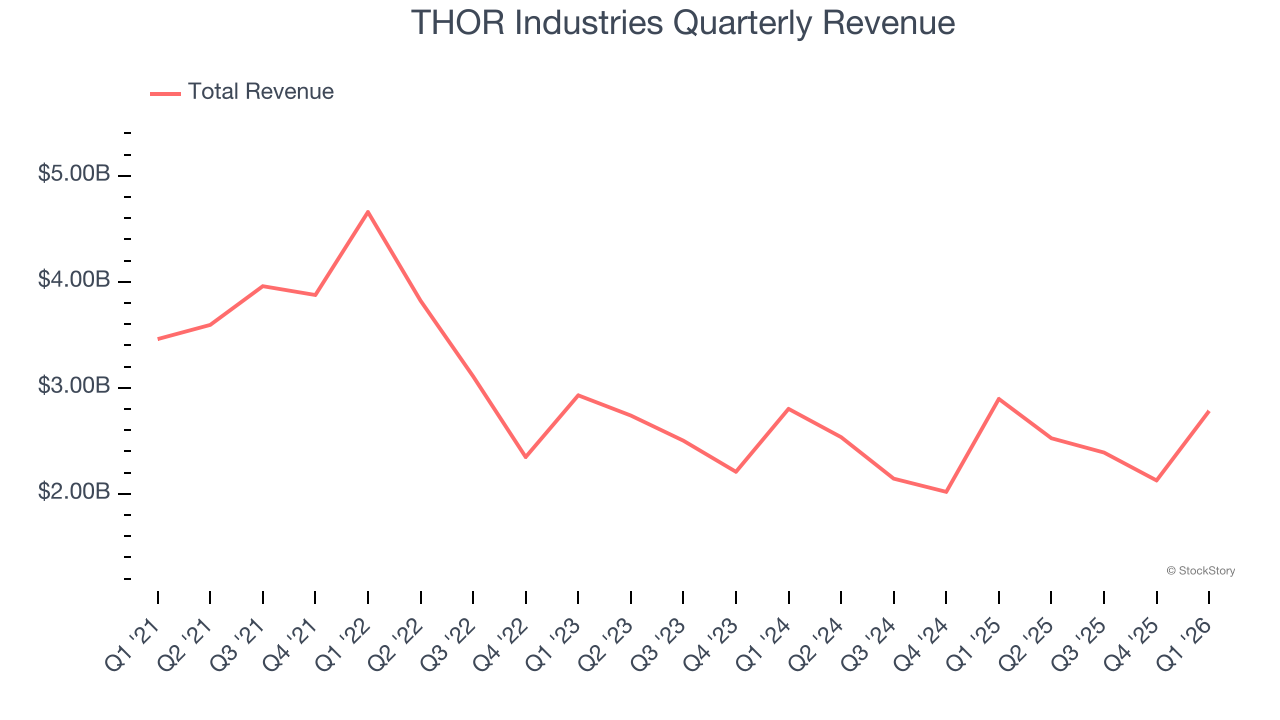
Long-term growth is the most important, but within industrials, a half-decade historical view may miss new industry trends or demand cycles. THOR Industries’s annualized revenue declines of 2.1% over the last two years align with its five-year trend, suggesting its demand has consistently shrunk. 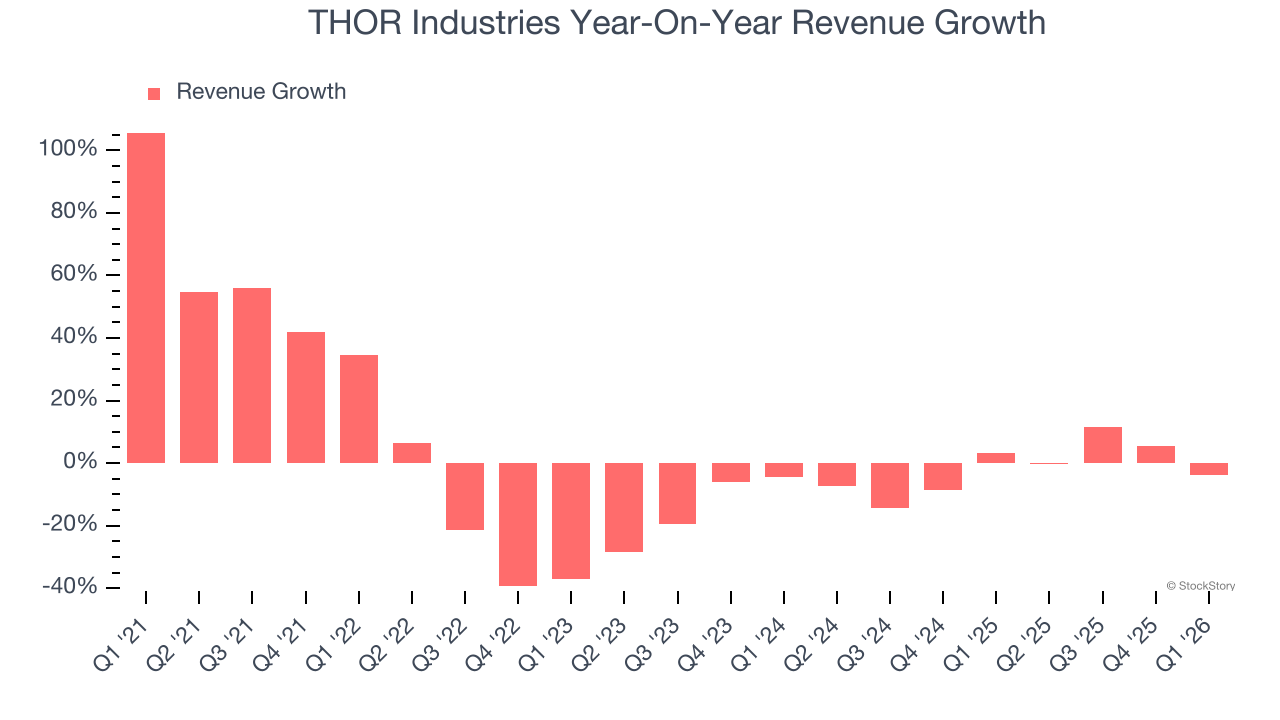
This quarter, THOR Industries’s revenue fell by 3.9% year on year to $2.78 billion but beat Wall Street’s estimates by 4.8%.
Looking ahead, sell-side analysts expect revenue to remain flat over the next 12 months. While this projection suggests its newer products and services will spur better top-line performance, it is still below average for the sector.
ONE MORE THING: 3 Hidden Platforms Growing 3X Faster than Amazon, Google, and PayPal. Amazon, Google, and Meta all followed the same playbook: Dominate an ignored market. Build an unbeatable moat. Scale until you’re unstoppable.
These three platforms are running that exact playbook right now. The early investors in Amazon made fortunes. The early investors in these could do the same. Get All 3 Stocks Here for FREE.
Operating Margin
Operating margin is a key measure of profitability. Think of it as net income - the bottom line - excluding the impact of taxes and interest on debt, which are less connected to business fundamentals.
THOR Industries was profitable over the last five years but held back by its large cost base. Its average operating margin of 5.7% was weak for an industrials business. This result isn’t too surprising given its low gross margin as a starting point.
Looking at the trend in its profitability, THOR Industries’s operating margin decreased by 6.5 percentage points over the last five years. THOR Industries’s performance was poor no matter how you look at it - it shows that costs were rising and it couldn’t pass them onto its customers.
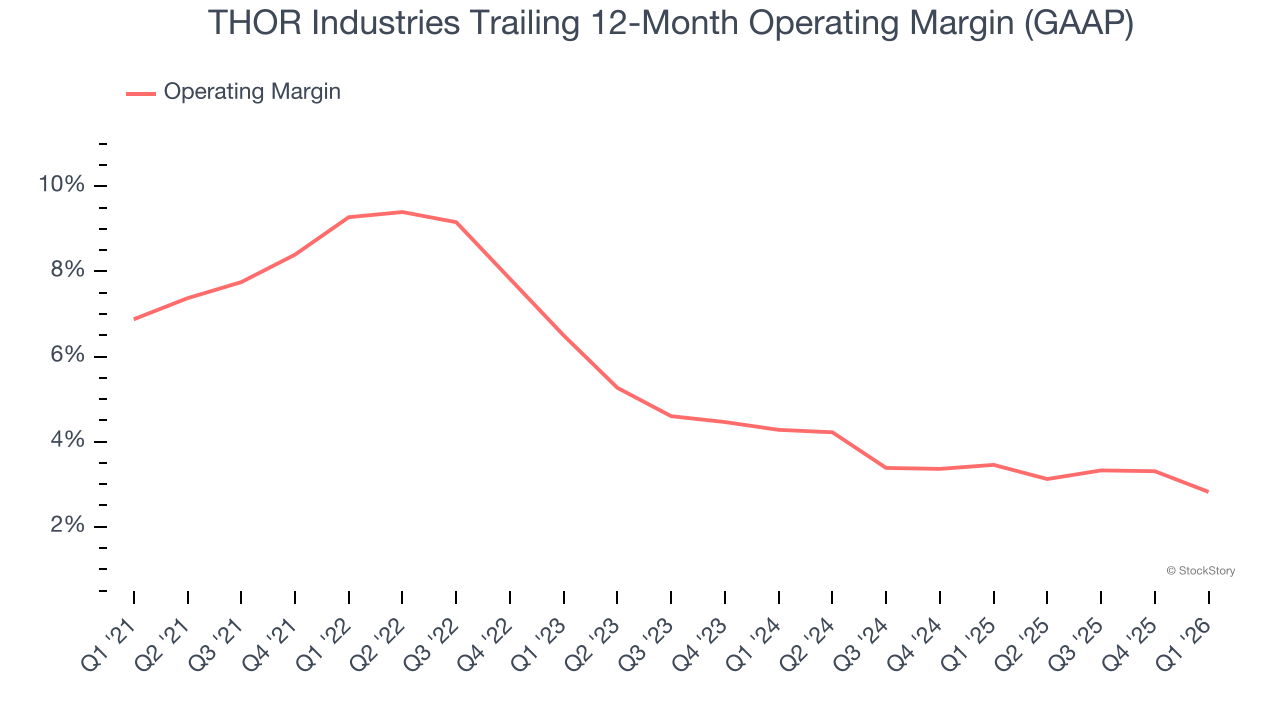
This quarter, THOR Industries generated an operating margin profit margin of 4.5%, down 1.6 percentage points year on year. Since THOR Industries’s gross margin decreased more than its operating margin, we can assume its recent inefficiencies were driven more by weaker leverage on its cost of sales rather than increased marketing, R&D, and administrative overhead expenses.
Earnings Per Share
We track the long-term change in earnings per share (EPS) for the same reason as long-term revenue growth. Compared to revenue, however, EPS highlights whether a company’s growth is profitable.
Sadly for THOR Industries, its EPS declined by 12.8% annually over the last five years, more than its revenue. This tells us the company struggled because its fixed cost base made it difficult to adjust to shrinking demand.
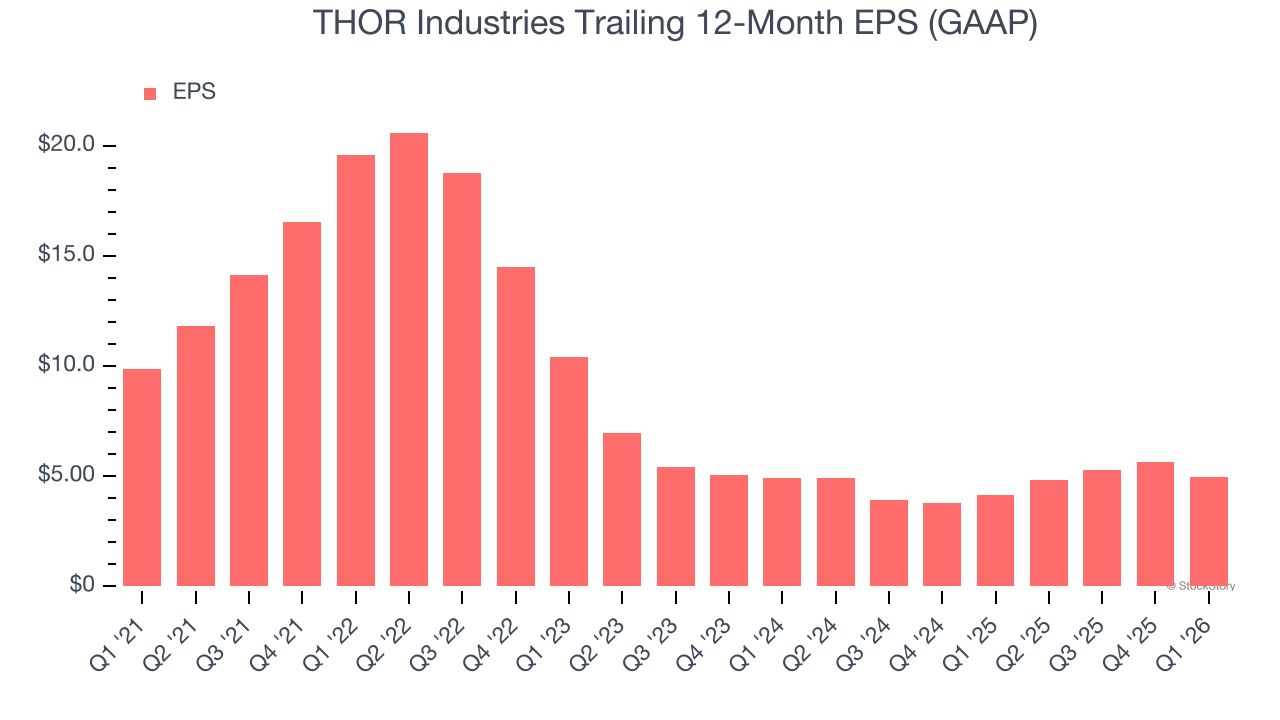
Diving into the nuances of THOR Industries’s earnings can give us a better understanding of its performance. As we mentioned earlier, THOR Industries’s operating margin declined by 6.5 percentage points over the last five years. This was the most relevant factor (aside from the revenue impact) behind its lower earnings; interest expenses and taxes can also affect EPS but don’t tell us as much about a company’s fundamentals.
Like with revenue, we analyze EPS over a shorter period to see if we are missing a change in the business.
For THOR Industries, EPS didn’t budge over the last two years, but at least that was better than its five-year trend. We hope its earnings can grow in the coming years.
In Q1, THOR Industries reported EPS of $1.86, down from $2.53 in the same quarter last year. This print missed analysts’ estimates. Over the next 12 months, Wall Street expects THOR Industries’s full-year EPS to stay about the same, moving from $4.97 to $5.00.
Key Takeaways from THOR Industries’s Q1 Results
We were impressed by how significantly THOR Industries blew past analysts’ revenue expectations this quarter. On the other hand, its full-year EPS guidance missed and its adjusted operating income fell short of Wall Street’s estimates. Overall, this quarter could have been better. The stock traded down 10% to $69.81 immediately after reporting.
THOR Industries underperformed this quarter, but does that create an opportunity to invest right now? What happened in the latest quarter matters, but not as much as longer-term business quality and valuation, when deciding whether to invest in this stock. We cover that in our actionable full research report which you can read here (it’s free).