
What a fantastic six months it’s been for Flex. Shares of the company have skyrocketed 97.8%, hitting $128.26. This was partly due to its solid quarterly results, and the run-up might have investors contemplating their next move.
Is there a buying opportunity in Flex, or does it present a risk to your portfolio? Dive into our full research report to see our analyst team’s opinion, it’s free.
Why Is Flex Not Exciting?
We’re happy investors have made money, but we’re sitting this one out for now. Here are three reasons why FLEX doesn’t excite us, plus one stock we’d rather own.
1. Long-Term Revenue Growth Disappoints
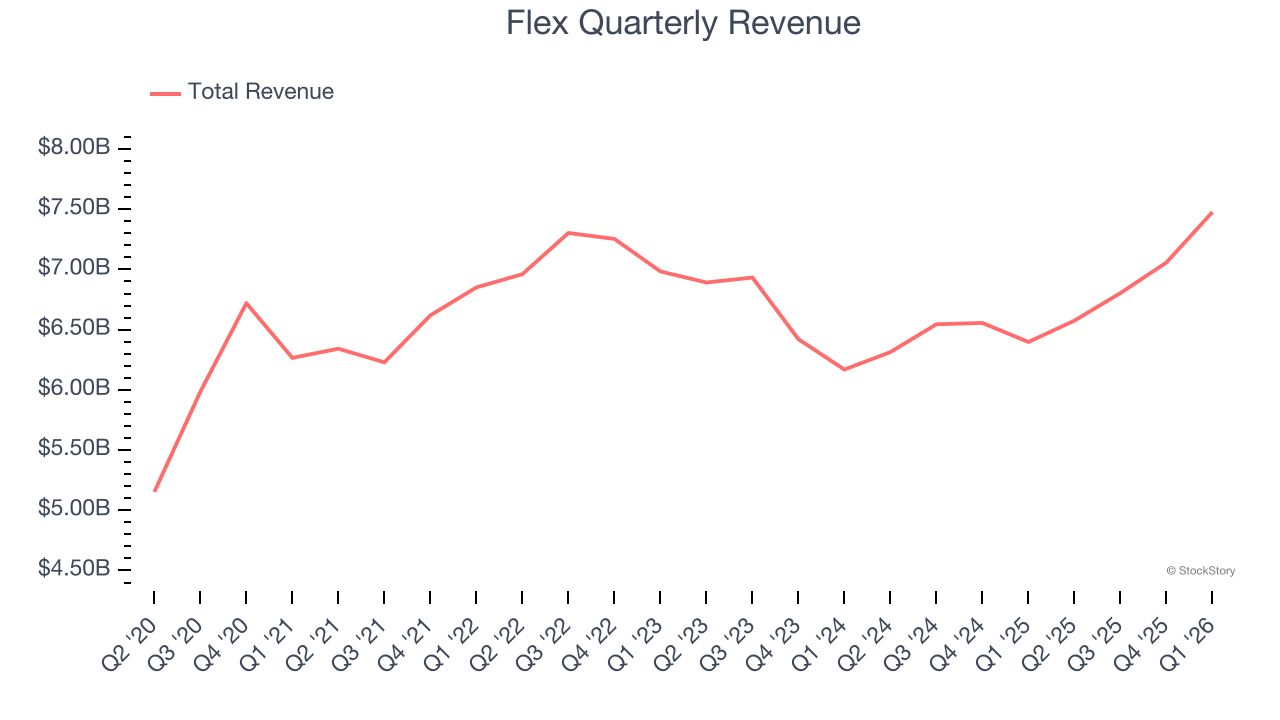
Examining a company’s long-term performance can provide clues about its quality. Any business can experience short-term success, but top-performing ones enjoy sustained growth for years. Regrettably, Flex’s sales grew at a sluggish 3% compounded annual growth rate over the last five years. This fell short of our benchmarks.
2. Mediocre Free Cash Flow Margin Limits Reinvestment Potential
Free cash flow isn’t a prominently featured metric in company financials and earnings releases, but we think it’s telling because it accounts for all operating and capital expenses, making it tough to manipulate. Cash is king.
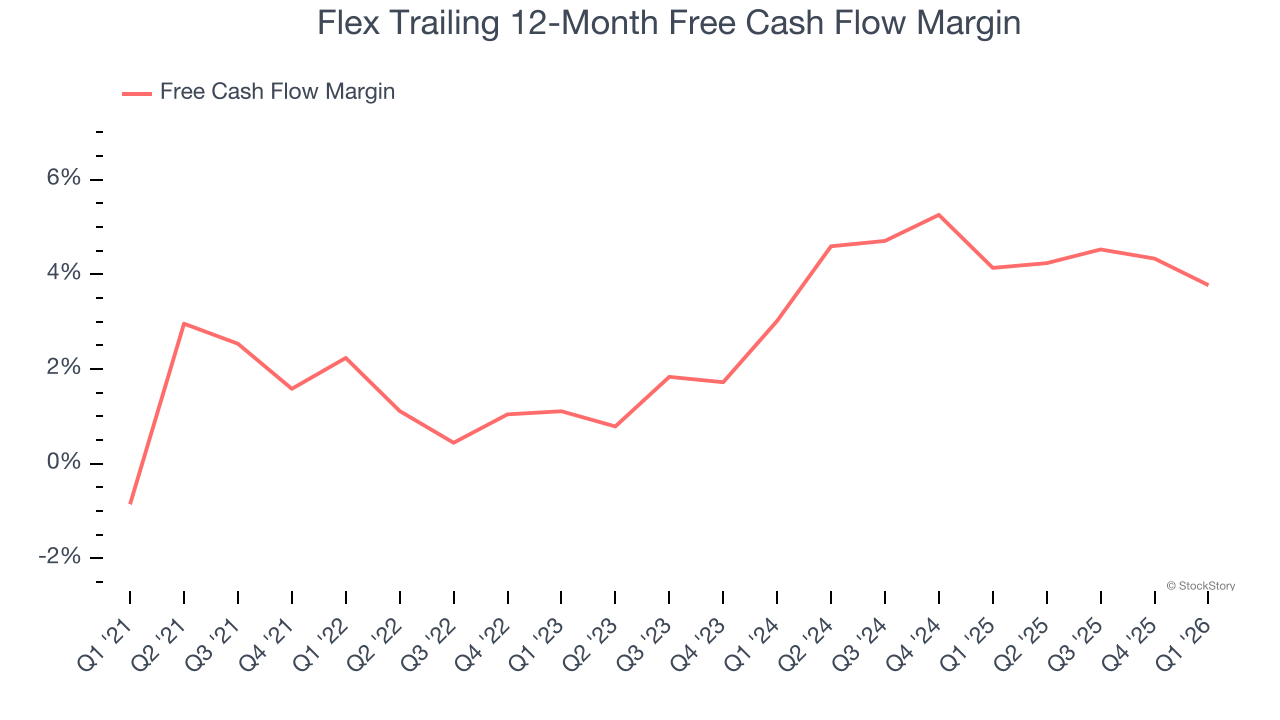
Flex has shown weak cash profitability relative to peers over the last five years, giving the company fewer opportunities to return capital to shareholders. Its free cash flow margin averaged 2.8%, below what we’d expect for a business services business.
3. New Investments Fail to Bear Fruit as ROIC Declines
A company’s ROIC, or return on invested capital, shows how much operating profit it makes compared to the money it has raised (debt and equity).
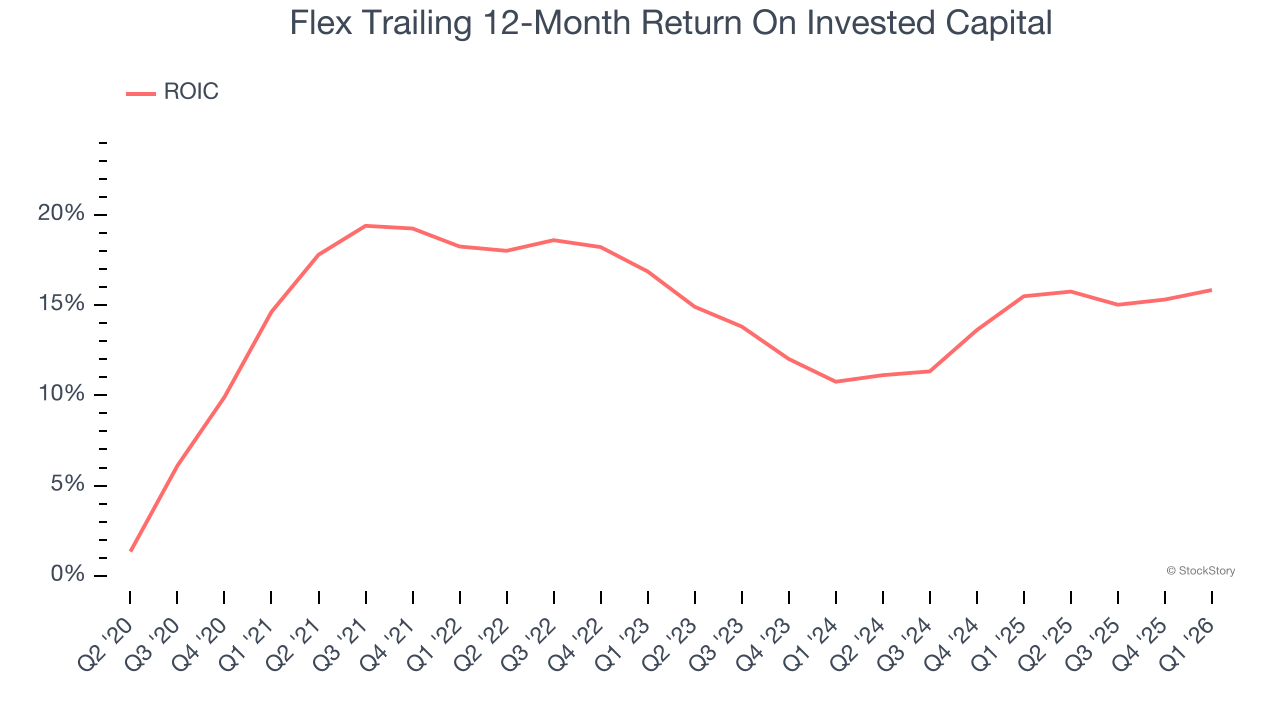
Over the last few years, Flex’s ROIC averaged 1.9 percentage point decreases each year. We like what management has done in the past, but its declining returns are perhaps a symptom of fewer profitable growth opportunities.
Final Judgment
Flex’s business quality ultimately falls short of our standards. After the recent rally, the stock trades at 29.6× forward P/E (or $128.26 per share). This multiple tells us a lot of good news is priced in - you can find more timely opportunities elsewhere. We’d suggest looking at one of our top software and edge computing picks.
Stocks We Would Buy Instead of Flex
ALSO WORTH WATCHING: Top 5 Momentum Stocks. The best time to own a great stock is when the market is finally noticing it. These aren’t just high-quality businesses. Something is happening with them right now. Elite fundamentals meet near-term momentum — both boxes checked at the same time.
Find out which stocks our AI platform is flagging this week. See this week’s Strong Momentum stocks — FREE. Get Our Strong Momentum Stocks for Free HERE.
Stocks that have made our list include now familiar names such as Nvidia (+1,460% between June 2020 and June 2025) as well as under-the-radar businesses like the once-micro-cap company Kadant (+214% between June 2020 and June 2025). Find your next big winner with StockStory today.