
Building products manufacturer Simpson (NYSE: SSD) reported revenue ahead of Wall Street’s expectations in Q2 CY2026, with sales up 6.3% year on year to $671.1 million. Its GAAP profit of $3.09 per share was 13.6% above analysts’ consensus estimates.
Is now the time to buy Simpson? Find out by accessing our full research report, it’s free.
Simpson (SSD) Q2 CY2026 Highlights:
- Revenue: $671.1 million vs analyst estimates of $658.8 million (6.3% year-on-year growth, 1.9% beat)
- EPS (GAAP): $3.09 vs analyst estimates of $2.72 (13.6% beat)
- Adjusted EBITDA: $196.1 million vs analyst estimates of $173.4 million (29.2% margin, 13.1% beat)
- Operating Margin: 25.2%, up from 22.2% in the same quarter last year
- Market Capitalization: $7.98 billion
"Our second quarter results reflect solid execution across our operations, with net sales increasing 6.3% year‑over‑year to $671.1 million, driven by growth in both North America and Europe," said Mike Olosky, President and Chief Executive Officer of Simpson Manufacturing Co., Inc.
Company Overview
Aiming to build safer and stronger buildings, Simpson (NYSE: SSD) designs and manufactures structural connectors, anchors, and other construction products.
Revenue Growth
Examining a company’s long-term performance can provide clues about its quality. Any business can experience short-term success, but top-performing ones enjoy sustained growth for years. Thankfully, Simpson’s 11.3% annualized revenue growth over the last five years was impressive. Its growth beat the average industrials company and shows its offerings resonate with customers.
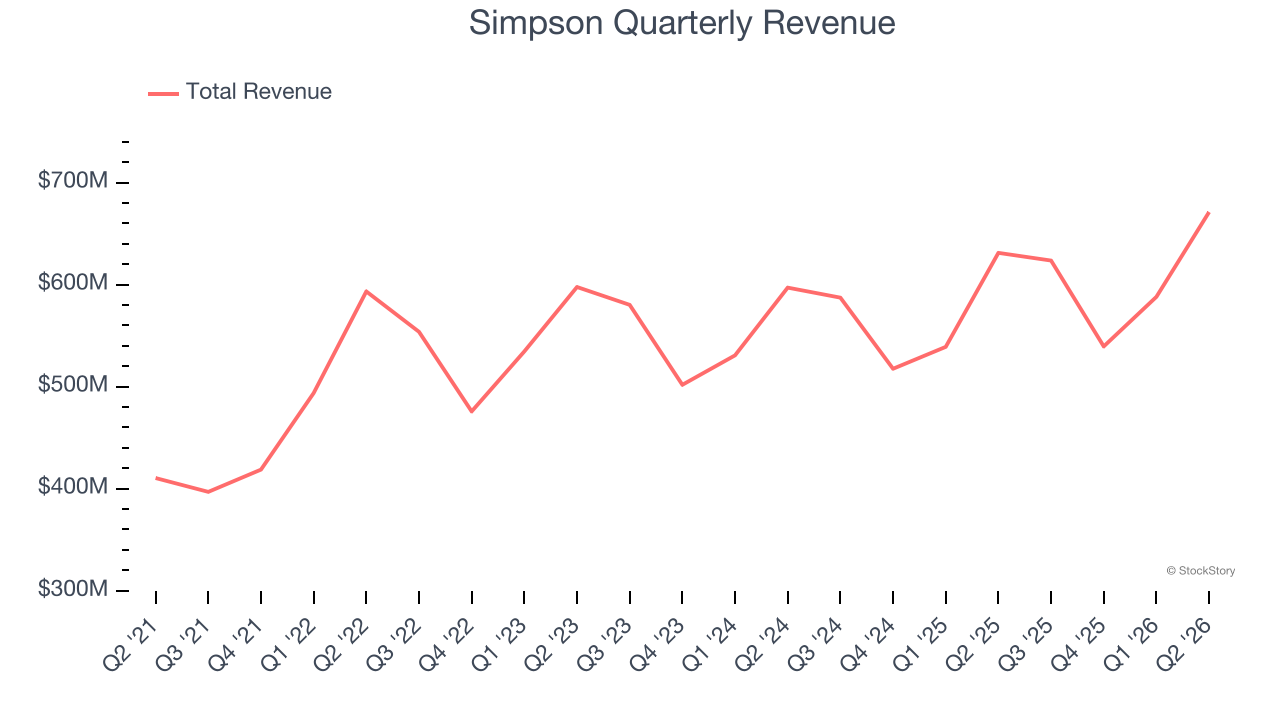
We at StockStory place the most emphasis on long-term growth, but within industrials, a half-decade historical view may miss cycles, industry trends, or a company capitalizing on catalysts such as a new contract win or a successful product line. Simpson’s recent performance shows its demand has slowed significantly as its annualized revenue growth of 4.7% over the last two years was well below its five-year trend. 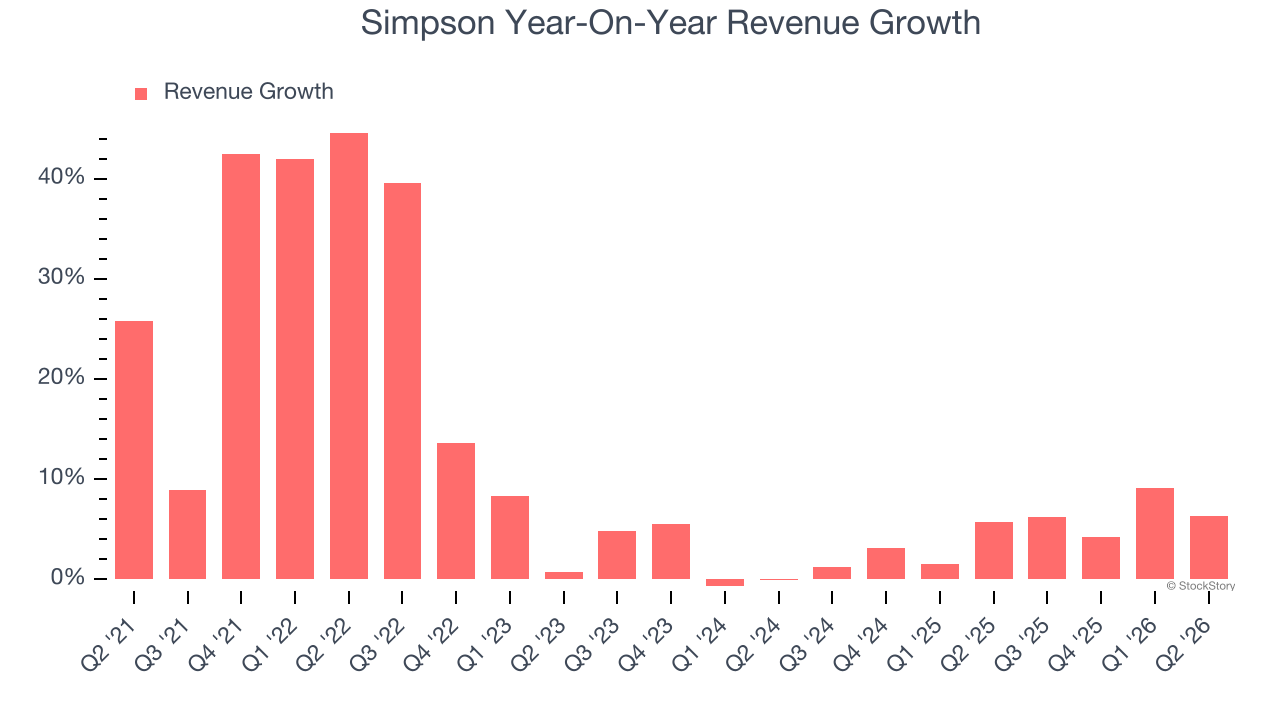
This quarter, Simpson reported year-on-year revenue growth of 6.3%, and its $671.1 million of revenue exceeded Wall Street’s estimates by 1.9%.
Looking ahead, sell-side analysts expect revenue to grow 2.4% over the next 12 months, a slight deceleration versus the last two years. This projection doesn’t excite us and indicates its products and services will face some demand challenges.
ALSO WORTH WATCHING: Nvidia’s Quiet Partner. Nvidia’s chips cost a hundred grand. The connectors that make them work cost even more. One company makes them all.
Every AI server needs specialized infrastructure the chip companies don’t make. High-speed cables. Power connectors. Thermal sensors. This 90-year-old company built a monopoly on it. The AI boom just started. This stock is still flying under the radar. Claim The Stock Ticker Here for FREE.
Operating Margin
Simpson has been a well-oiled machine over the last five years. It demonstrated elite profitability for an industrials business, boasting an average operating margin of 21.2%. This result isn’t surprising as its high gross margin gives it a favorable starting point.
Looking at the trend in its profitability, Simpson’s operating margin decreased by 4.5 percentage points over the last five years. This raises questions about the company’s expense base because its revenue growth should have given it leverage on its fixed costs, resulting in better economies of scale and profitability.
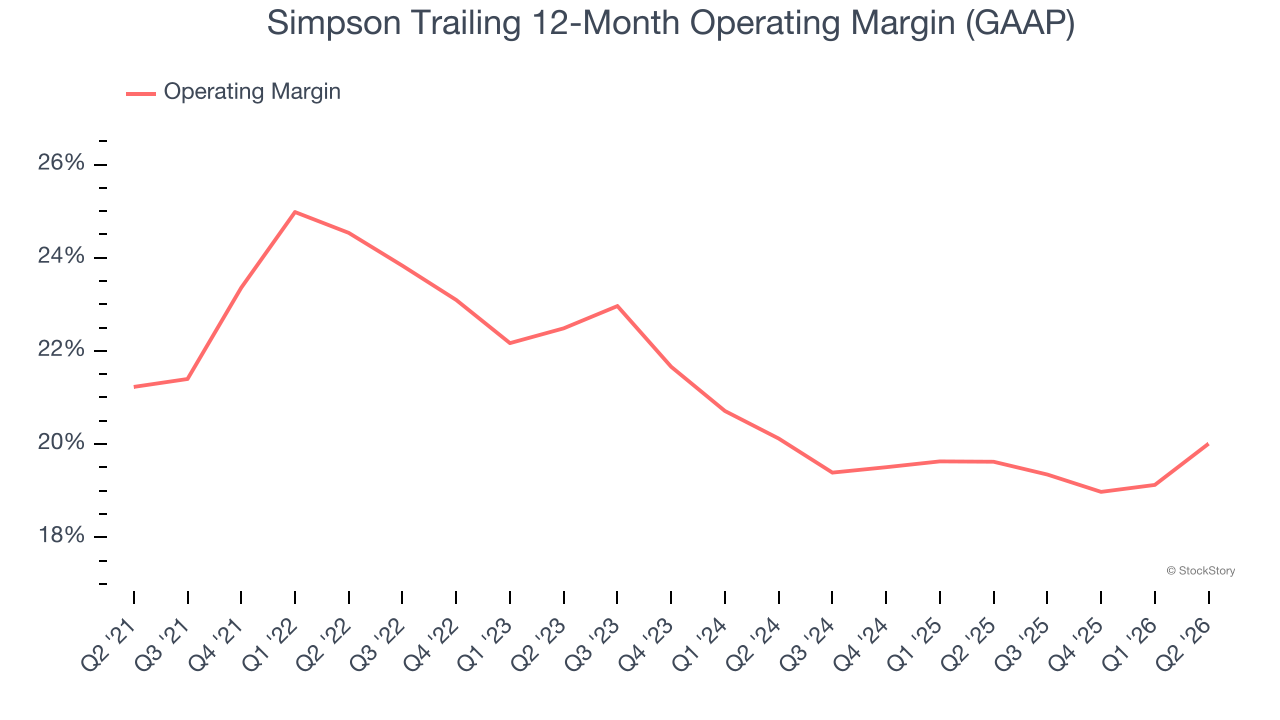
In Q2, Simpson generated an operating margin profit margin of 25.2%, up 3 percentage points year on year. The increase was encouraging, and because its operating margin rose more than its gross margin, we can infer it was more efficient with expenses such as marketing, R&D, and administrative overhead.
Earnings Per Share
We track the long-term change in earnings per share (EPS) for the same reason as long-term revenue growth. Compared to revenue, however, EPS highlights whether a company’s growth is profitable.
Simpson’s remarkable 12.7% annual EPS growth over the last five years aligns with its revenue performance. This tells us it maintained its per-share profitability as it expanded.
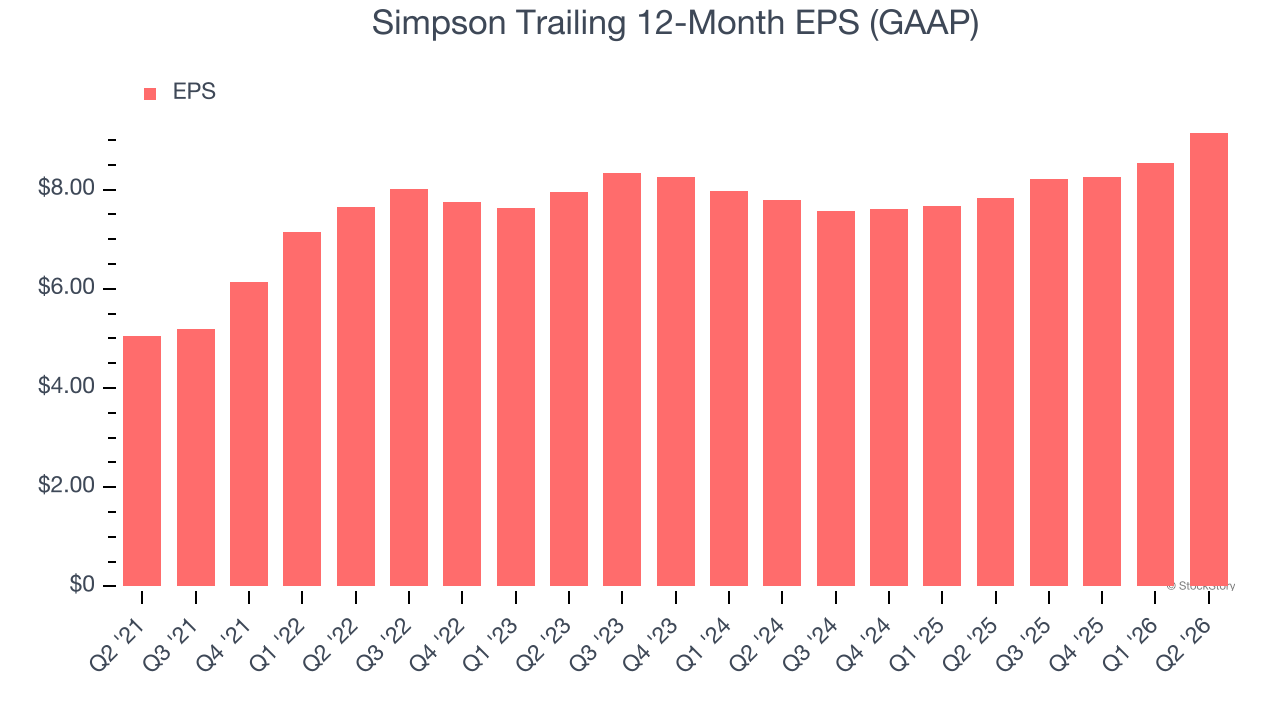
Like with revenue, we analyze EPS over a more recent period because it can provide insight into an emerging theme or development for the business.
Simpson’s two-year annual EPS growth of 8.4% was decent and topped its 4.7% two-year revenue growth.
Diving into Simpson’s quality of earnings can give us a better understanding of its performance. Simpson’s operating margin has expanded over the last two yearswhile its share count has shrunk 3.2%. Improving profitability and share buybacks are positive signs for shareholders as they juice EPS growth relative to revenue growth. 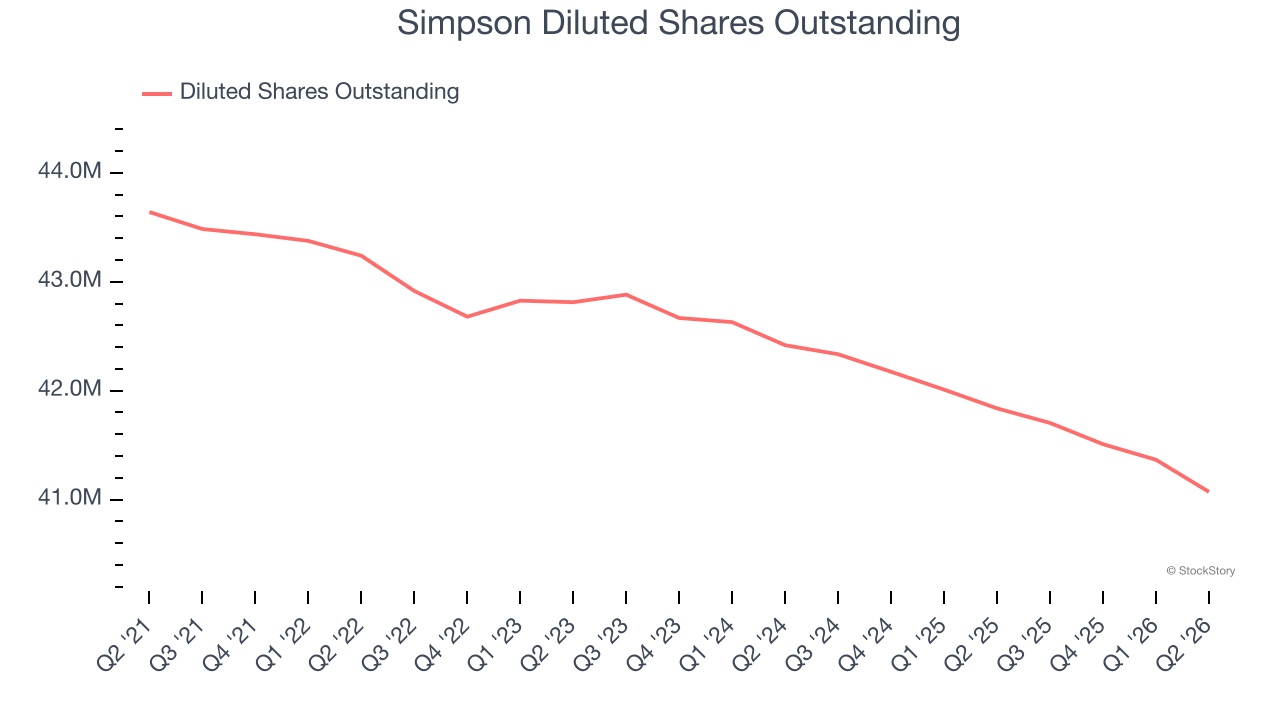
In Q2, Simpson reported EPS of $3.09, up from $2.47 in the same quarter last year. This print easily cleared analysts’ estimates, and shareholders should be content with the results. Over the next 12 months, Wall Street expects Simpson’s full-year EPS to grow 3.8% from $9.15 to $9.50.
Key Takeaways from Simpson’s Q2 Results
We liked that Simpson beat analysts’ EBITDA expectations this quarter. We were also glad its EPS outperformed Wall Street’s estimates. Zooming out, we think this was a solid print. The stock remained flat at $193.15 immediately following the results.
Should you buy the stock or not? If you’re making that decision, you should consider the bigger picture of valuation, business qualities, as well as the latest earnings. We cover that in our actionable full research report which you can read here (it’s free).