Building products company Boise Cascade Company (NYSE: BCC) reported Q2 CY2026 results topping the market’s revenue expectations, with sales up 5.2% year on year to $1.83 billion. Its GAAP profit of $1.63 per share was 30.7% above analysts’ consensus estimates.
Is now the time to buy Boise Cascade? Find out by accessing our full research report, it’s free.
Boise Cascade (BCC) Q2 CY2026 Highlights:
- Revenue: $1.83 billion vs analyst estimates of $1.77 billion (5.2% year-on-year growth, 3.4% beat)
- EPS (GAAP): $1.63 vs analyst estimates of $1.25 (30.7% beat)
- Adjusted EBITDA: $126.2 million vs analyst estimates of $103.6 million (6.9% margin, 21.9% beat)
- EBITDA guidance for Q3 CY2026 is $98 million at the midpoint, below analyst estimates of $104.7 million
- Operating Margin: 4.6%, in line with the same quarter last year
- Free Cash Flow was $18.83 million, up from -$45.88 million in the same quarter last year
- Market Capitalization: $2.69 billion
Company Overview
Formed through the merger of two lumber companies, Boise Cascade Company (NYSE: BCC) manufactures and distributes wood products and other building materials.
Revenue Growth
Reviewing a company’s long-term sales performance reveals insights into its quality. Any business can put up a good quarter or two, but many enduring ones grow for years. Boise Cascade’s demand was weak over the last five years as its sales fell at a 2.5% annual rate. This wasn’t a great result and is a sign of poor business quality.
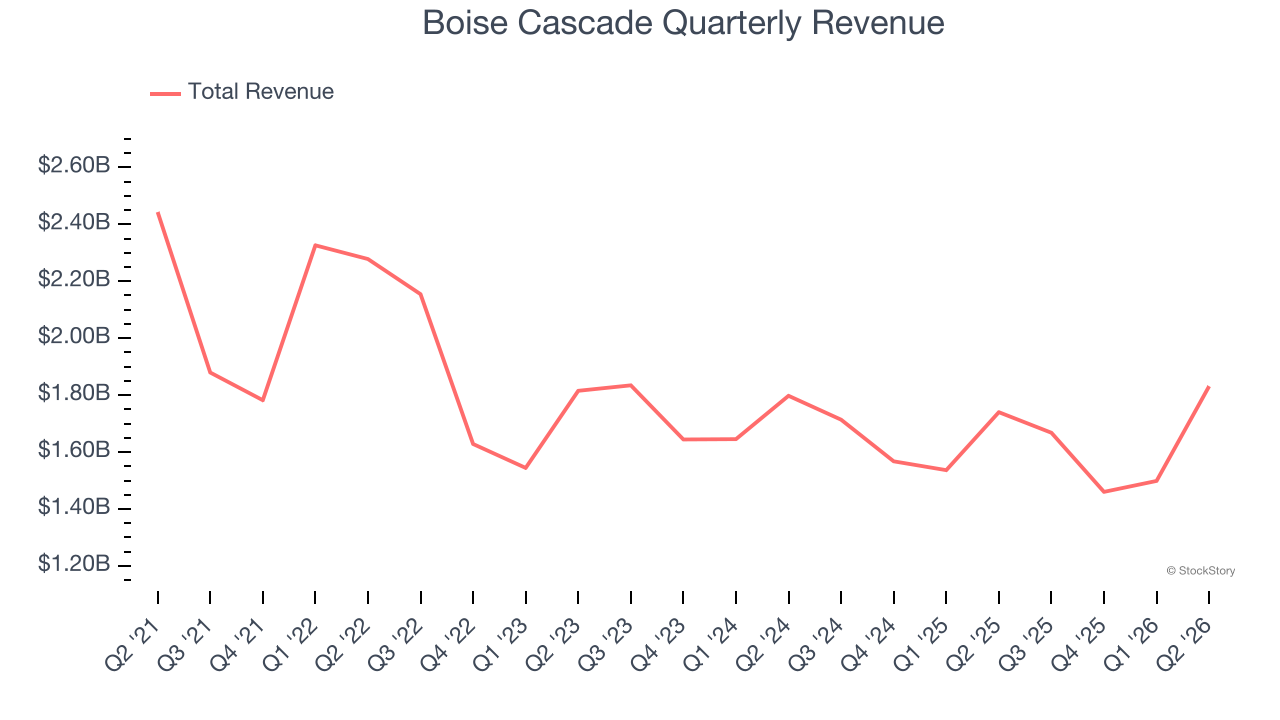
Long-term growth is the most important, but within industrials, a half-decade historical view may miss new industry trends or demand cycles. Boise Cascade’s annualized revenue declines of 3.4% over the last two years align with its five-year trend, suggesting its demand has consistently shrunk. 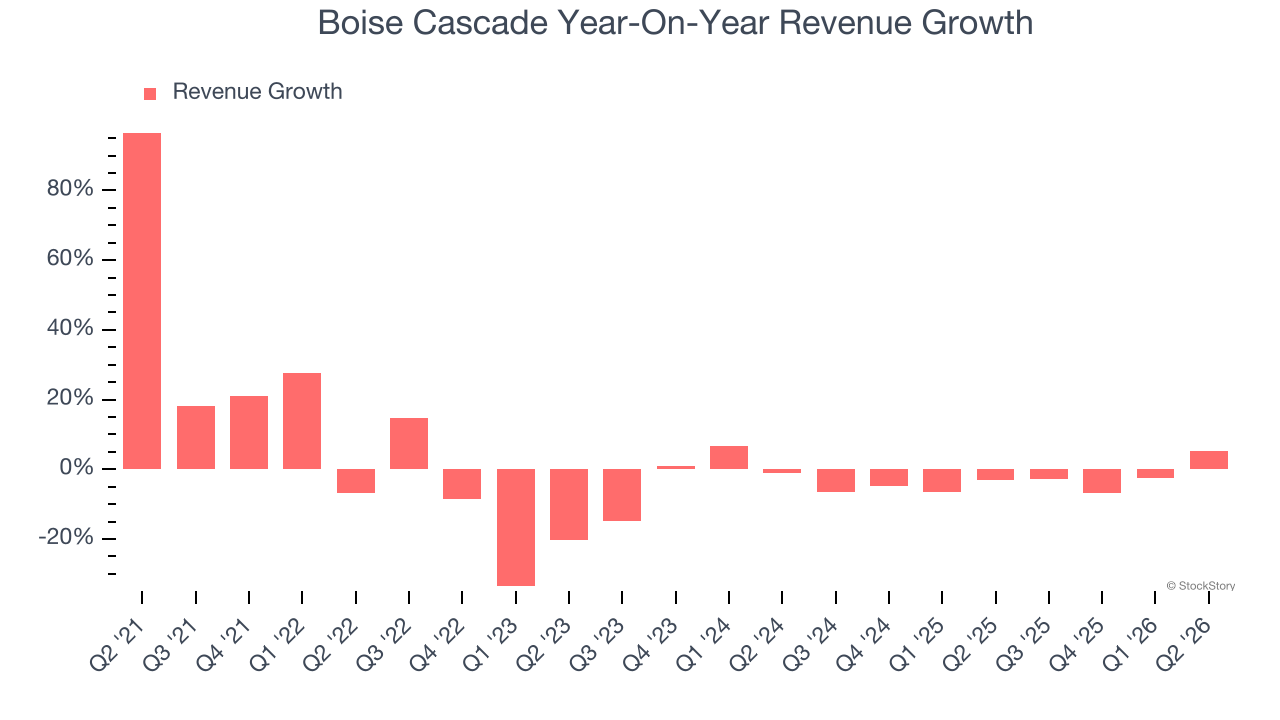
We can better understand the company’s revenue dynamics by analyzing its most important segments, Building Material Distribution and Wood products, which are 92.7% and 25.1% of revenue. Over the last two years, Boise Cascade’s Building Material Distribution revenue (plywood, siding, insulation) averaged 2.1% year-on-year declines while its Wood products revenue (lumber and beams) averaged 8.1% declines. 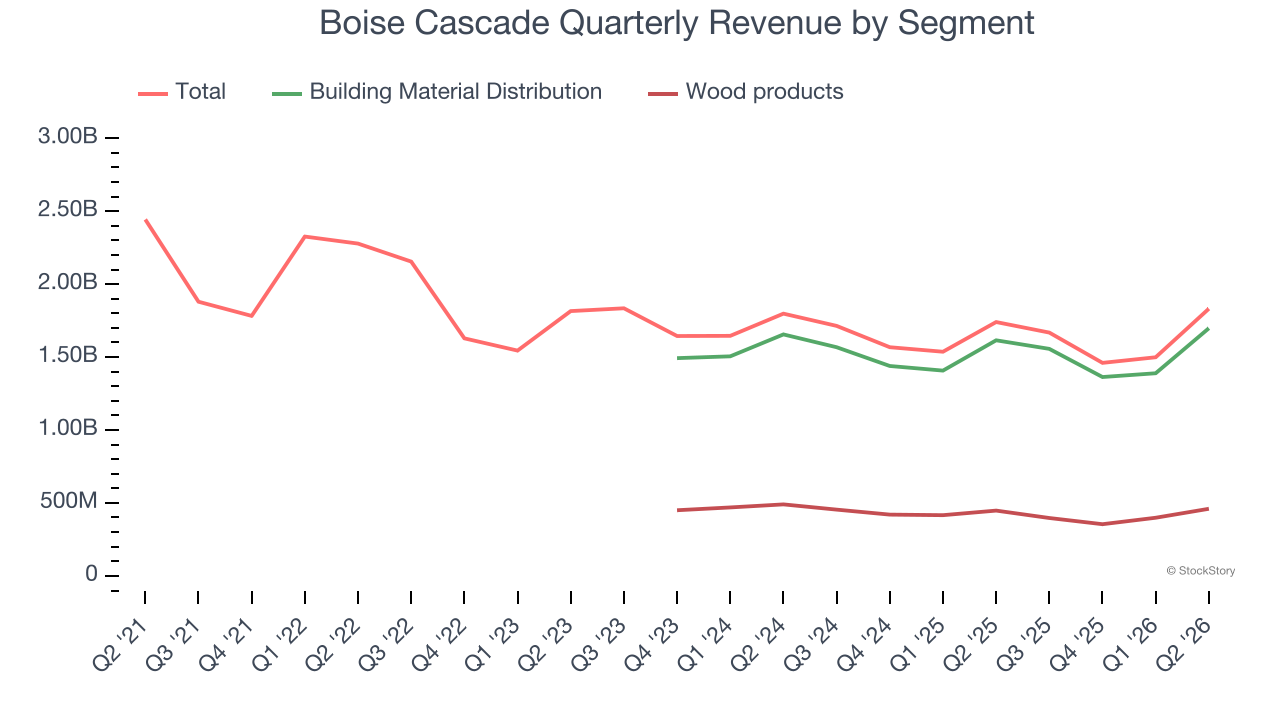
This quarter, Boise Cascade reported year-on-year revenue growth of 5.2%, and its $1.83 billion of revenue exceeded Wall Street’s estimates by 3.4%.
Looking ahead, sell-side analysts expect revenue to grow 4.4% over the next 12 months. Although this projection implies its newer products and services will spur better top-line performance, it is still below the sector average.
ONE MORE THING: The $21 AI Application Stock Wall Street Forgot. While Wall Street obsesses over who’s building AI, one company is already using it to print money. And nobody’s paying attention.
AI chip stocks trade at ridiculous valuations. This company processes a trillion consumer signals monthly using AI and trades at a third of the price. The gap won’t last. The institutions will figure it out. You need to see this first. Read the FREE Report Before They Notice.
Operating Margin
Operating margin is a key measure of profitability. Think of it as net income - the bottom line - excluding the impact of taxes and interest on debt, which are less connected to business fundamentals.
Boise Cascade has done a decent job managing its cost base over the last five years. The company has produced an average operating margin of 8.3%, higher than the broader industrials sector.
Analyzing the trend in its profitability, Boise Cascade’s operating margin decreased by 10.3 percentage points over the last five years. Even though its historical margin was healthy, shareholders will want to see Boise Cascade become more profitable in the future.
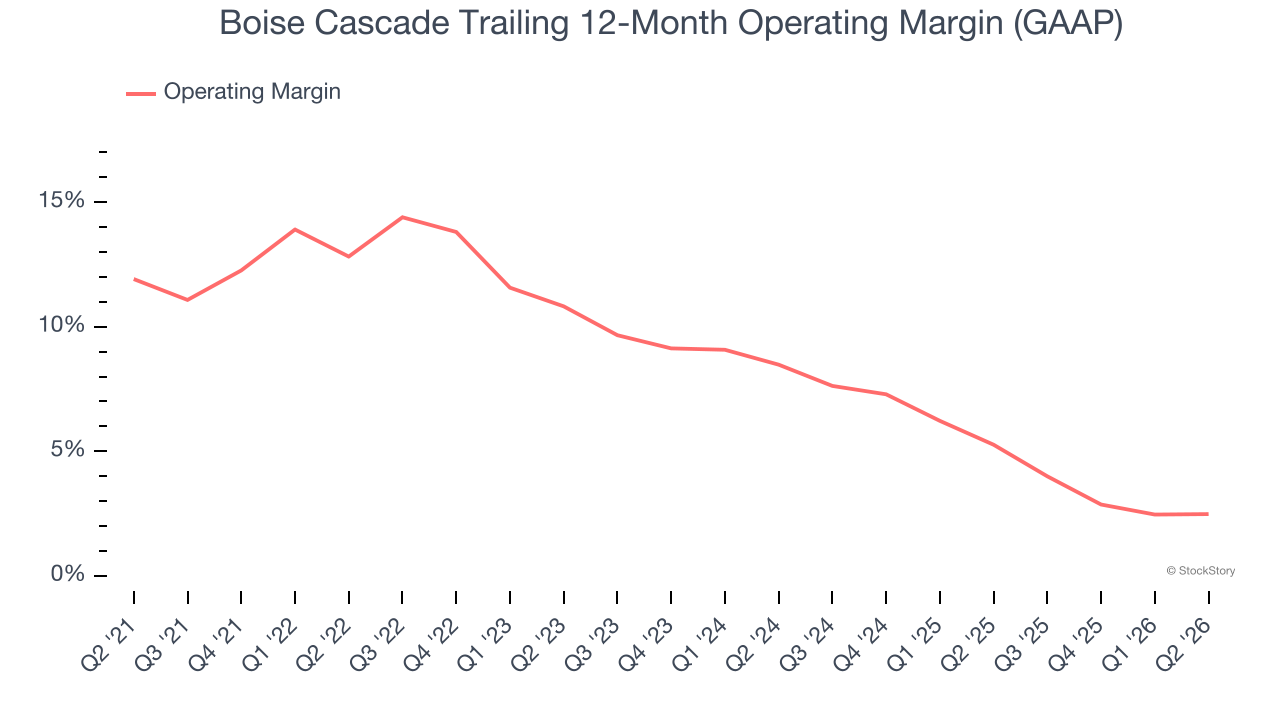
This quarter, Boise Cascade generated an operating margin profit margin of 4.6%, in line with the same quarter last year. This indicates the company’s cost structure has recently been stable.
Earnings Per Share
Revenue trends explain a company’s historical growth, but the long-term change in earnings per share (EPS) points to the profitability of that growth — for example, a company could inflate its sales through excessive spending on advertising and promotions.
Sadly for Boise Cascade, its EPS declined by 27.5% annually over the last five years, more than its revenue. This tells us the company struggled because its fixed cost base made it difficult to adjust to shrinking demand.
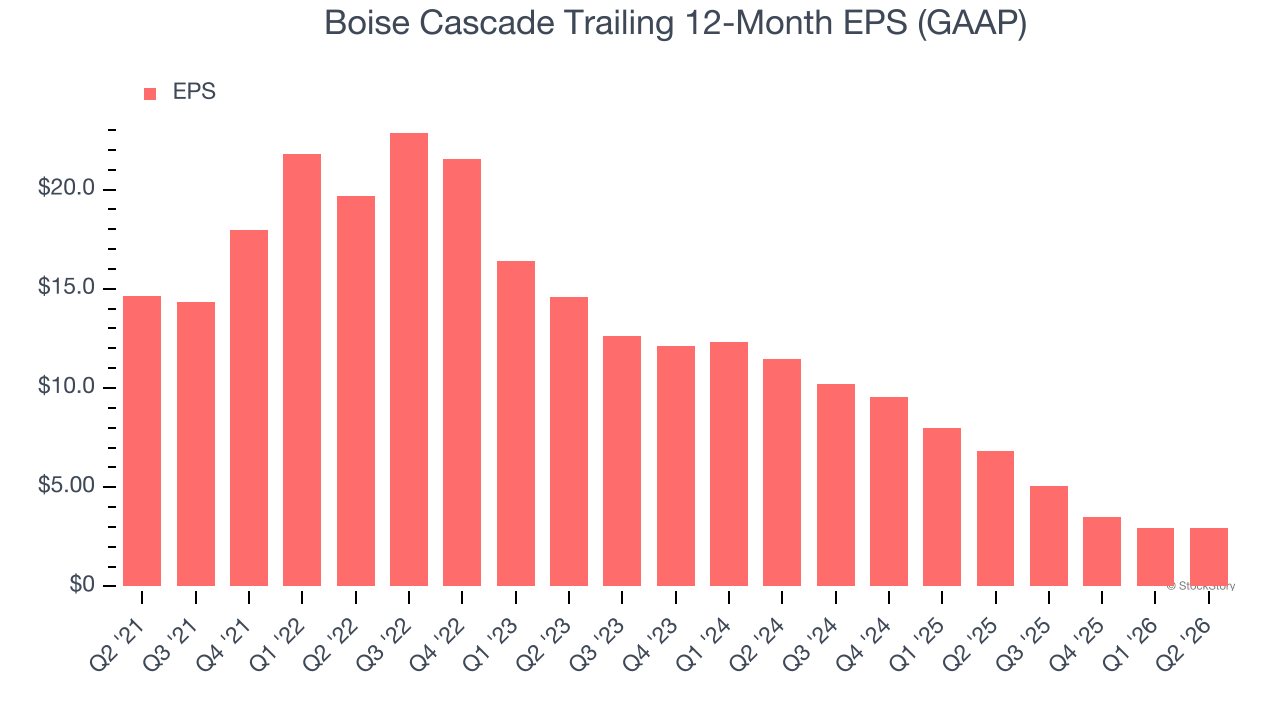
We can take a deeper look into Boise Cascade’s earnings to better understand the drivers of its performance. As we mentioned earlier, Boise Cascade’s operating margin was flat this quarter but declined by 10.3 percentage points over the last five years. This was the most relevant factor (aside from the revenue impact) behind its lower earnings; interest expenses and taxes can also affect EPS but don’t tell us as much about a company’s fundamentals.
Like with revenue, we analyze EPS over a shorter period to see if we are missing a change in the business.
For Boise Cascade, its two-year annual EPS declines of 49.3% show it’s continued to underperform. These results were bad no matter how you slice the data.
In Q2, Boise Cascade reported EPS of $1.63, down from $1.64 in the same quarter last year. Despite falling year on year, this print easily cleared analysts’ estimates. Over the next 12 months, Wall Street expects Boise Cascade’s full-year EPS to grow 55.7% from $2.94 to $4.58.
Key Takeaways from Boise Cascade’s Q2 Results
It was good to see Boise Cascade beat analysts’ EPS expectations this quarter. We were also excited its EBITDA outperformed Wall Street’s estimates by a wide margin. On the other hand, its EBITDA guidance for next quarter missed. Zooming out, we think this quarter was mixed. The stock remained flat at $83 immediately after reporting.
Boise Cascade had an encouraging quarter, but one earnings result doesn’t necessarily make the stock a buy. Let’s see if this is a good investment. We think that the latest quarter is only one piece of the longer-term business quality puzzle. Quality, when combined with valuation, can help determine if the stock is a buy. We cover that in our actionable full research report which you can read here (it’s free).