
Cruise and exploration company Lindblad Expeditions (NASDAQ: LIND) reported Q2 CY2026 results exceeding the market’s revenue expectations, with sales up 18.6% year on year to $199.2 million. The company expects the full year’s revenue to be around $845 million, close to analysts’ estimates. Its GAAP loss of $0.02 per share was 81.1% above analysts’ consensus estimates.
Is now the time to buy Lindblad Expeditions? Find out by accessing our full research report, it’s free.
Lindblad Expeditions (LIND) Q2 CY2026 Highlights:
- Revenue: $199.2 million vs analyst estimates of $185.9 million (18.6% year-on-year growth, 7.2% beat)
- EPS (GAAP): -$0.02 vs analyst estimates of -$0.11 (81.1% beat)
- Adjusted EBITDA: $32.46 million vs analyst estimates of $23.69 million (16.3% margin, 37.1% beat)
- The company lifted its revenue guidance for the full year to $845 million at the midpoint from $825 million, a 2.4% increase
- EBITDA guidance for the full year is $135 million at the midpoint, below analyst estimates of $137.6 million
- Operating Margin: 6%, up from 2.6% in the same quarter last year
- Free Cash Flow Margin: 25.6%, up from 8% in the same quarter last year
- Market Capitalization: $1.94 billion
Company Overview
Founded by explorer Sven-Olof Lindblad in 1979, Lindblad Expeditions (NASDAQ: LIND) offers cruising experiences to remote destinations in partnership with National Geographic.
Revenue Growth
Reviewing a company’s long-term sales performance reveals insights into its quality. Any business can put up a good quarter or two, but the best consistently grow over the long haul. Thankfully, Lindblad Expeditions’s 114% annualized revenue growth over the last five years was incredible. Its growth beat the average consumer discretionary company and shows its offerings resonate with customers.
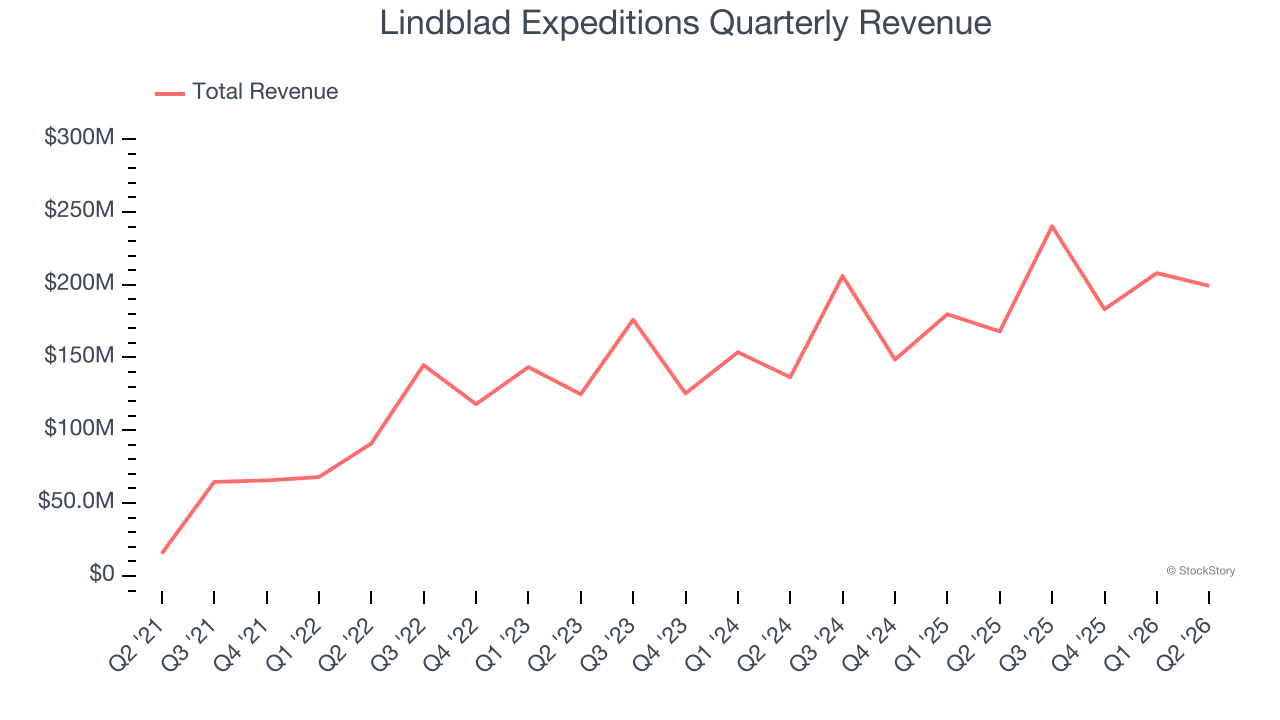
We at StockStory place the most emphasis on long-term growth, but within consumer discretionary, a stretched historical view may miss a company riding a successful new property or trend. Lindblad Expeditions’s recent performance shows its demand has slowed significantly as its annualized revenue growth of 18.5% over the last two years was well below its five-year trend. 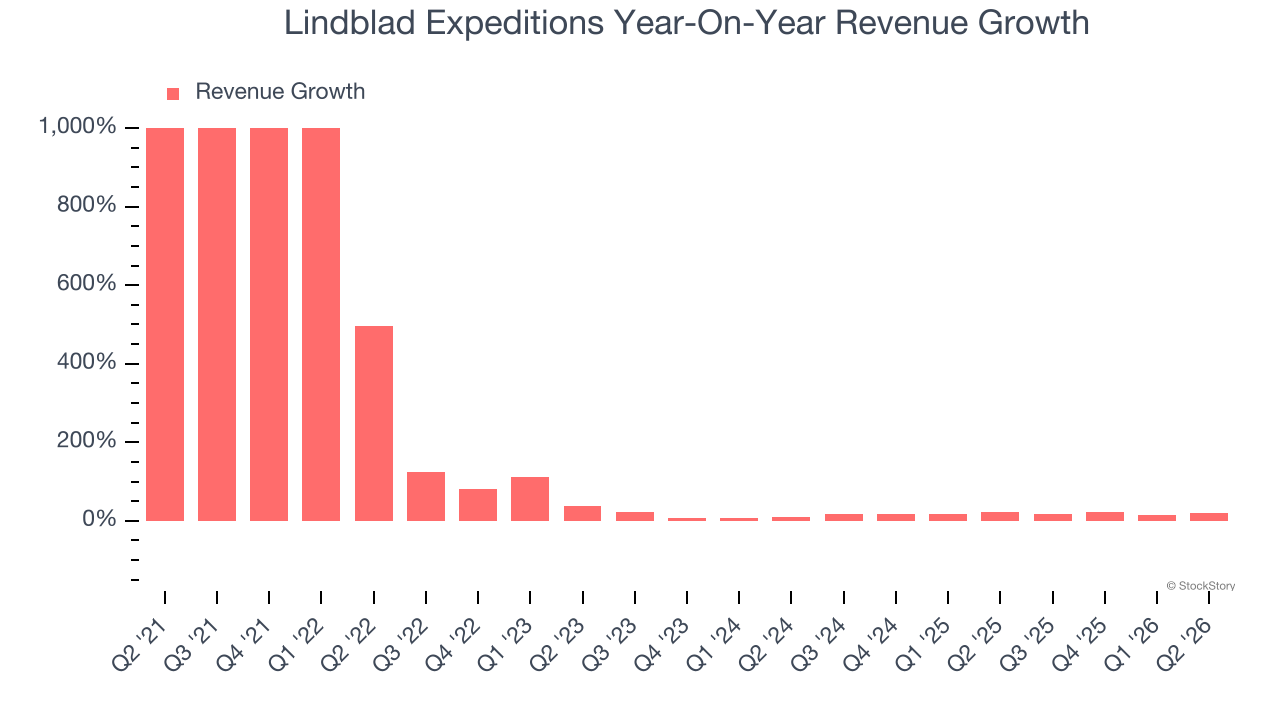
This quarter, Lindblad Expeditions reported year-on-year revenue growth of 18.6%, and its $199.2 million of revenue exceeded Wall Street’s estimates by 7.2%.
Looking ahead, sell-side analysts expect revenue to grow 5.3% over the next 12 months, a deceleration versus the last two years. This projection doesn’t excite us and indicates its products and services will face some demand challenges.
WHILE YOU’RE HERE: The Next Palantir? One satellite company captures images of every point on Earth. Every single day. The Pentagon wants it. Hedge funds are using it to beat earnings. You’ve probably never heard of it.
This is what the early days of Palantir looked like before it became a giant. Same playbook. Different technology. If you missed Palantir, you need to see this. Claim The Stock Ticker for Free HERE.
Operating Margin
Operating margin is an important measure of profitability as it shows the portion of revenue left after accounting for all core expenses — everything from the cost of goods sold to advertising and wages. It’s also useful for comparing profitability across companies with different levels of debt and tax rates because it excludes interest and taxes.
Lindblad Expeditions’s operating margin has been trending up over the last 12 months and averaged 6.9% over the last two years. The company’s higher efficiency is a breath of fresh air, but its suboptimal cost structure means it still sports inadequate profitability for a consumer discretionary business.
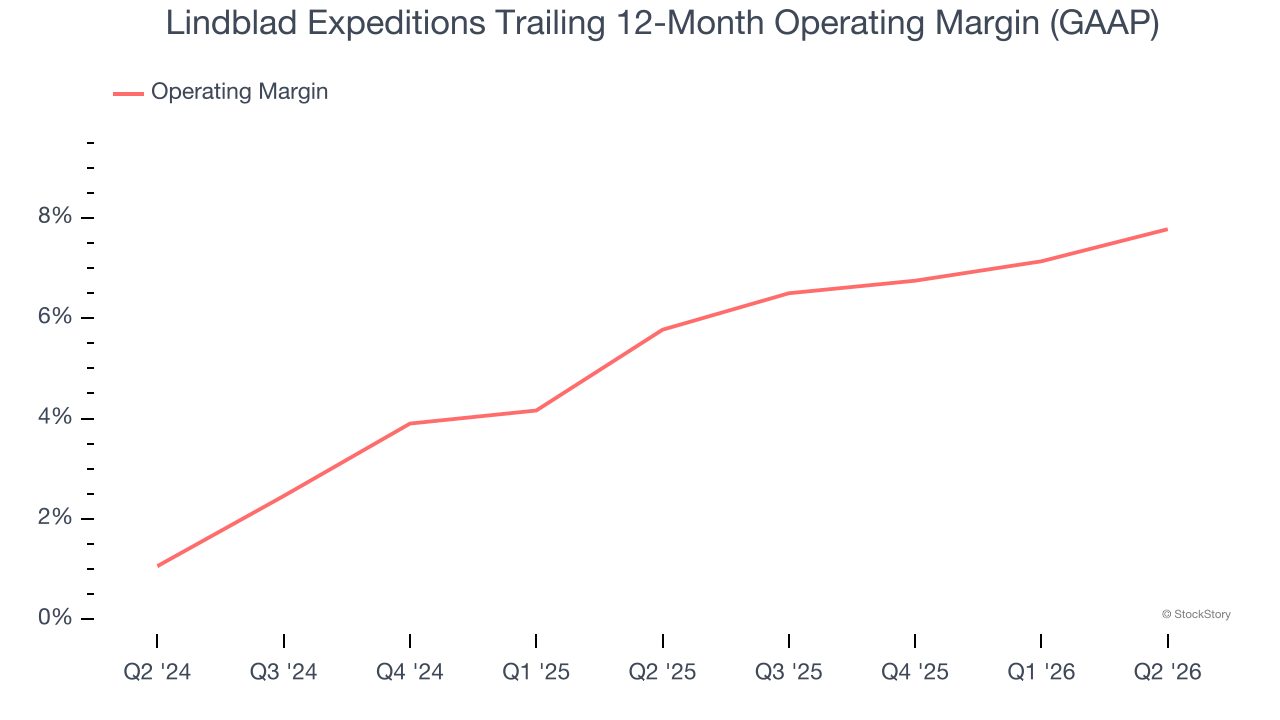
In Q2, Lindblad Expeditions generated an operating margin profit margin of 6%, up 3.4 percentage points year on year. This increase was a welcome development and shows it was more efficient.
Earnings Per Share
Revenue trends explain a company’s historical growth, but the long-term change in earnings per share (EPS) points to the profitability of that growth — for example, a company could inflate its sales through excessive spending on advertising and promotions.
Although Lindblad Expeditions’s full-year earnings are still negative, it reduced its losses and improved its EPS by 31.5% annually over the last five years. The next few quarters will be critical for assessing its long-term profitability.
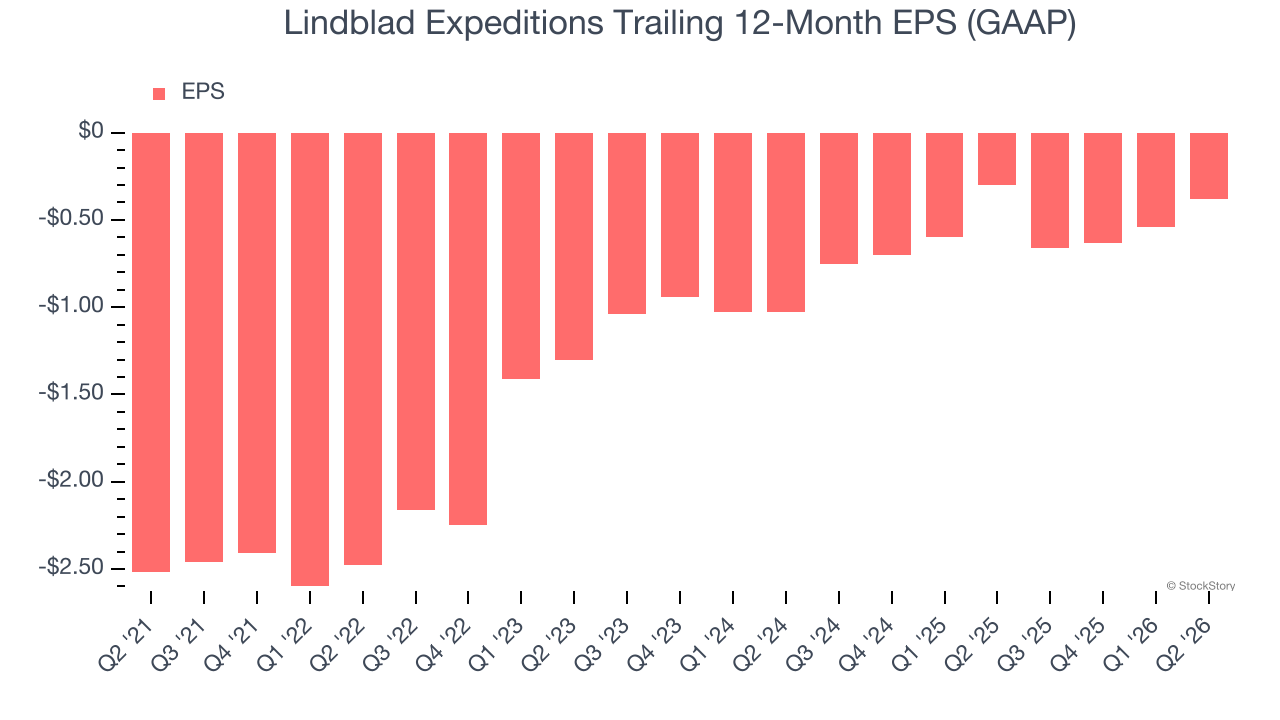
In Q2, Lindblad Expeditions reported EPS of negative $0.02, up from negative $0.18 in the same quarter last year. This print easily cleared analysts’ estimates, and shareholders should be content with the results. Over the next 12 months, Wall Street is optimistic. Analysts forecast Lindblad Expeditions’s full-year EPS will flip from negative $0.38 to positive $0.19.
Key Takeaways from Lindblad Expeditions’s Q2 Results
It was good to see Lindblad Expeditions beat analysts’ EPS expectations this quarter. We were also excited its EBITDA outperformed Wall Street’s estimates by a wide margin. On the other hand, its full-year EBITDA guidance missed and its full-year revenue guidance was in line with Wall Street’s estimates. Overall, we think this was still a solid quarter with some key areas of upside. The stock traded up 2.6% to $30.35 immediately after reporting.
Indeed, Lindblad Expeditions had a rock-solid quarterly earnings result, but is this stock a good investment here? The latest quarter does matter, but not nearly as much as longer-term fundamentals and valuation, when deciding if the stock is a buy. We cover that in our actionable full research report which you can read here (it’s free).