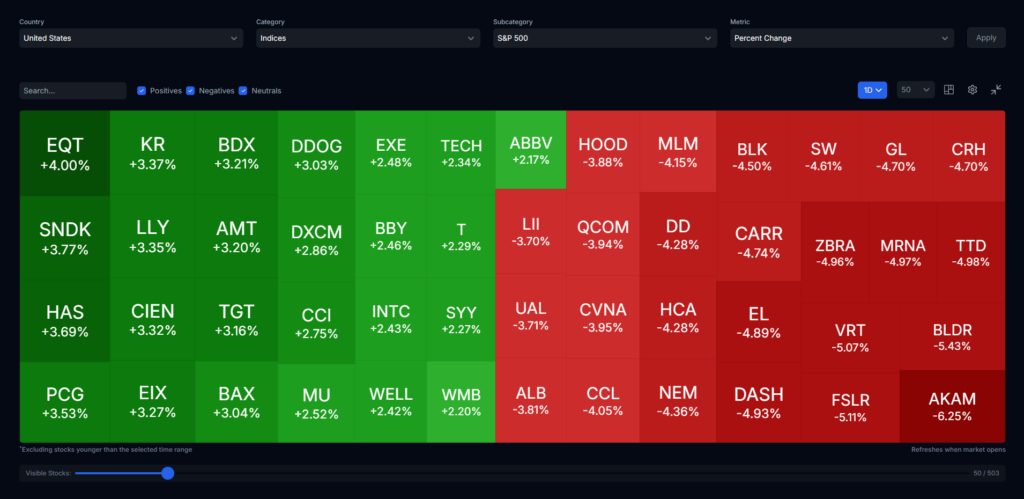
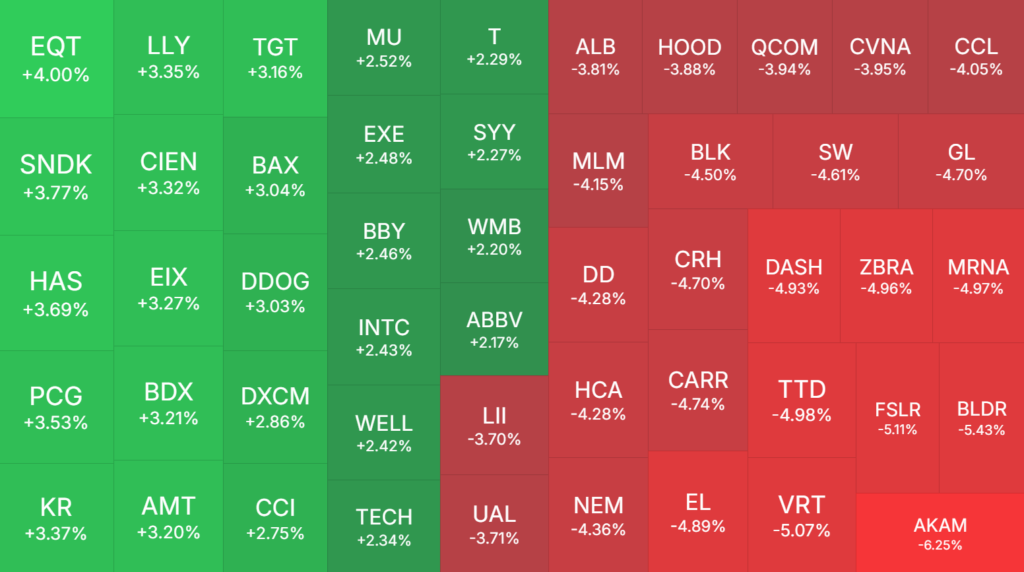
Marketgenius is a free, mobile-first stock market visualization platform. The centerpiece is a stock heatmap where tile sizes reflect the metric being viewed, not a fixed market-cap weighting. Switch from percent change to dividend yield to PEG and the same universe re-sizes around the new signal.
A portfolio view shows what someone owns. A metric view shows where a signal lives. Combining them shows whether a signal is concentrated in places disciplined investors have already moved into.
Heatmap universes (17 total)
United States indices:
· S&P 500
· NASDAQ-100
· Dow Jones Industrial Average
Mexican indices:
· S&P/BMV IPC (Indice de Precios y Cotizaciones)
· S&P/BMV IPC CompMx
· S&P/BMV INMEX (Indice Mexico)
Netherlands indices (Euronext Amsterdam):
· AEX (large cap)
· AMX (mid cap)
· AMS Next 20 (next-tier large cap)
Belgium indices (Euronext Brussels):
· BEL 20 (blue chip)
· BEL Mid (mid cap)
Superinvestor 13F portfolios:
· Berkshire Hathaway (Warren Buffett)
· Pershing Square Capital Management (Bill Ackman)
· Icahn Enterprises (Carl Icahn)
· ARK Investment Management (Cathie Wood)
· Scion Asset Management (Michael Burry)
· Bill & Melinda Gates Foundation Trust
Coverage of Mexican, Dutch, and Belgian indices is unusual among free retail platforms. Most stick to US-only universes.
22 metric views per universe
Every universe rotates through 22 metric views: percent change, market cap, forward and trailing P/E, PEG, P/B, P/S, EV/EBITDA, EPS yield, forward dividend yield, payout ratio, year-over-year earnings growth, quarterly revenue growth, return on equity, gross and net profit margin, debt-to-equity, current ratio, beta, short interest, 52-week high drawdown, and 52-week low gain.
Per-stock pages
Every stock has a dedicated quote page with:
· Live price hero with digit-by-digit price ticking, percent-change indicator, and a Market Open or Market Closed badge
· Interactive multi-range price chart with intraday and multi-day views, updating in real time during market hours
· Two risk and quality indicators: Industry Safety Score (risk score for the stock’s industry), and Earnings Quality (alignment between reported earnings and operating cash flow)
· Peer-comparison statistics panel that rates the stock 1 to 5 against same-country, same-industry peers across 28 metrics: market cap, P/E, PEG, EV/EBITDA, P/S, P/B, revenue, net and gross margin, EPS, ROE, operating cash flow, revenue and earnings growth, beta, debt-to-equity, total debt, current ratio, book value per share, total cash, levered free cash flow, cash per share, institutional and insider ownership, short interest, forward dividend yield, and payout ratio
Free financial calculators
Beyond heatmaps and stock pages, Marketgenius ships free interactive financial calculators:
· DCF (discounted cash flow) for fair-value estimation
· Reverse DCF that back-solves the growth rate the market is pricing into a given share price
· WACC for weighted average cost of capital
· CAGR for compound annual growth rates
· Dividend calculator for income and reinvested-snowball projections
· Market cap calculator
· Profit margin calculator
Identifier validators
Free validators for the six major securities and entity identifier codes, each with format checks and check-digit verification: ISIN, CFI, LEI, CUSIP, SEDOL, and WKN.
Multilingual education library
A full education library in English, Dutch, and Spanish, covering valuation methods, financial ratios, cash-flow analysis, dividend mechanics, risk concepts, and the identifier codes themselves.