
Visa Inc. (V), a leading global player in the payment processing industry, outperformed top and bottom-line expectations in its last reported quarter, buoyed by strong consumer spending and robust cross-border payment volumes despite fears of an economic downturn.
Despite the steadily rising interest rates, as part of the Federal Reserve's strategy to curb inflation, American consumer spending demonstrated a remarkable resilience. Boosted by robust consumer expenditure, sectors such as travel and retail experienced significant growth, ultimately benefitting credit card companies.
The Federal Reserve Bank of New York reports that credit card balances for Americans reached a historic high of $1 trillion this year. During the second quarter of 2023 alone, credit card balances saw an increase of $45 billion, up 4% year-over-year. As per Statista, approximately 242 billion global purchase transactions involved Visa payment cards during 2022, equating to almost 0.66 billion daily transactions.
V's growth can be further attributed to the ongoing transition toward digital payments and the expansion of V's service offerings, which are expected to have substantially contributed to the fiscal third quarter that ended June 30, 2023.
Moreover, the company has significantly expanded its network through strategic acquisitions, new deals, and extended agreements. For example, V recently extended its partnership with Conferma Pay by four years to enhance Visa Commercial Pay payment offerings. Given the current growth in the global travel market, this development comes at an opportune time.
Given this backdrop, let’s delve into some of its key financial metrics trends to understand why V could be a valuable addition to your financial portfolio.
Fluctuations and Trends in Visa's Financial Performance: 2020-2023 Analysis
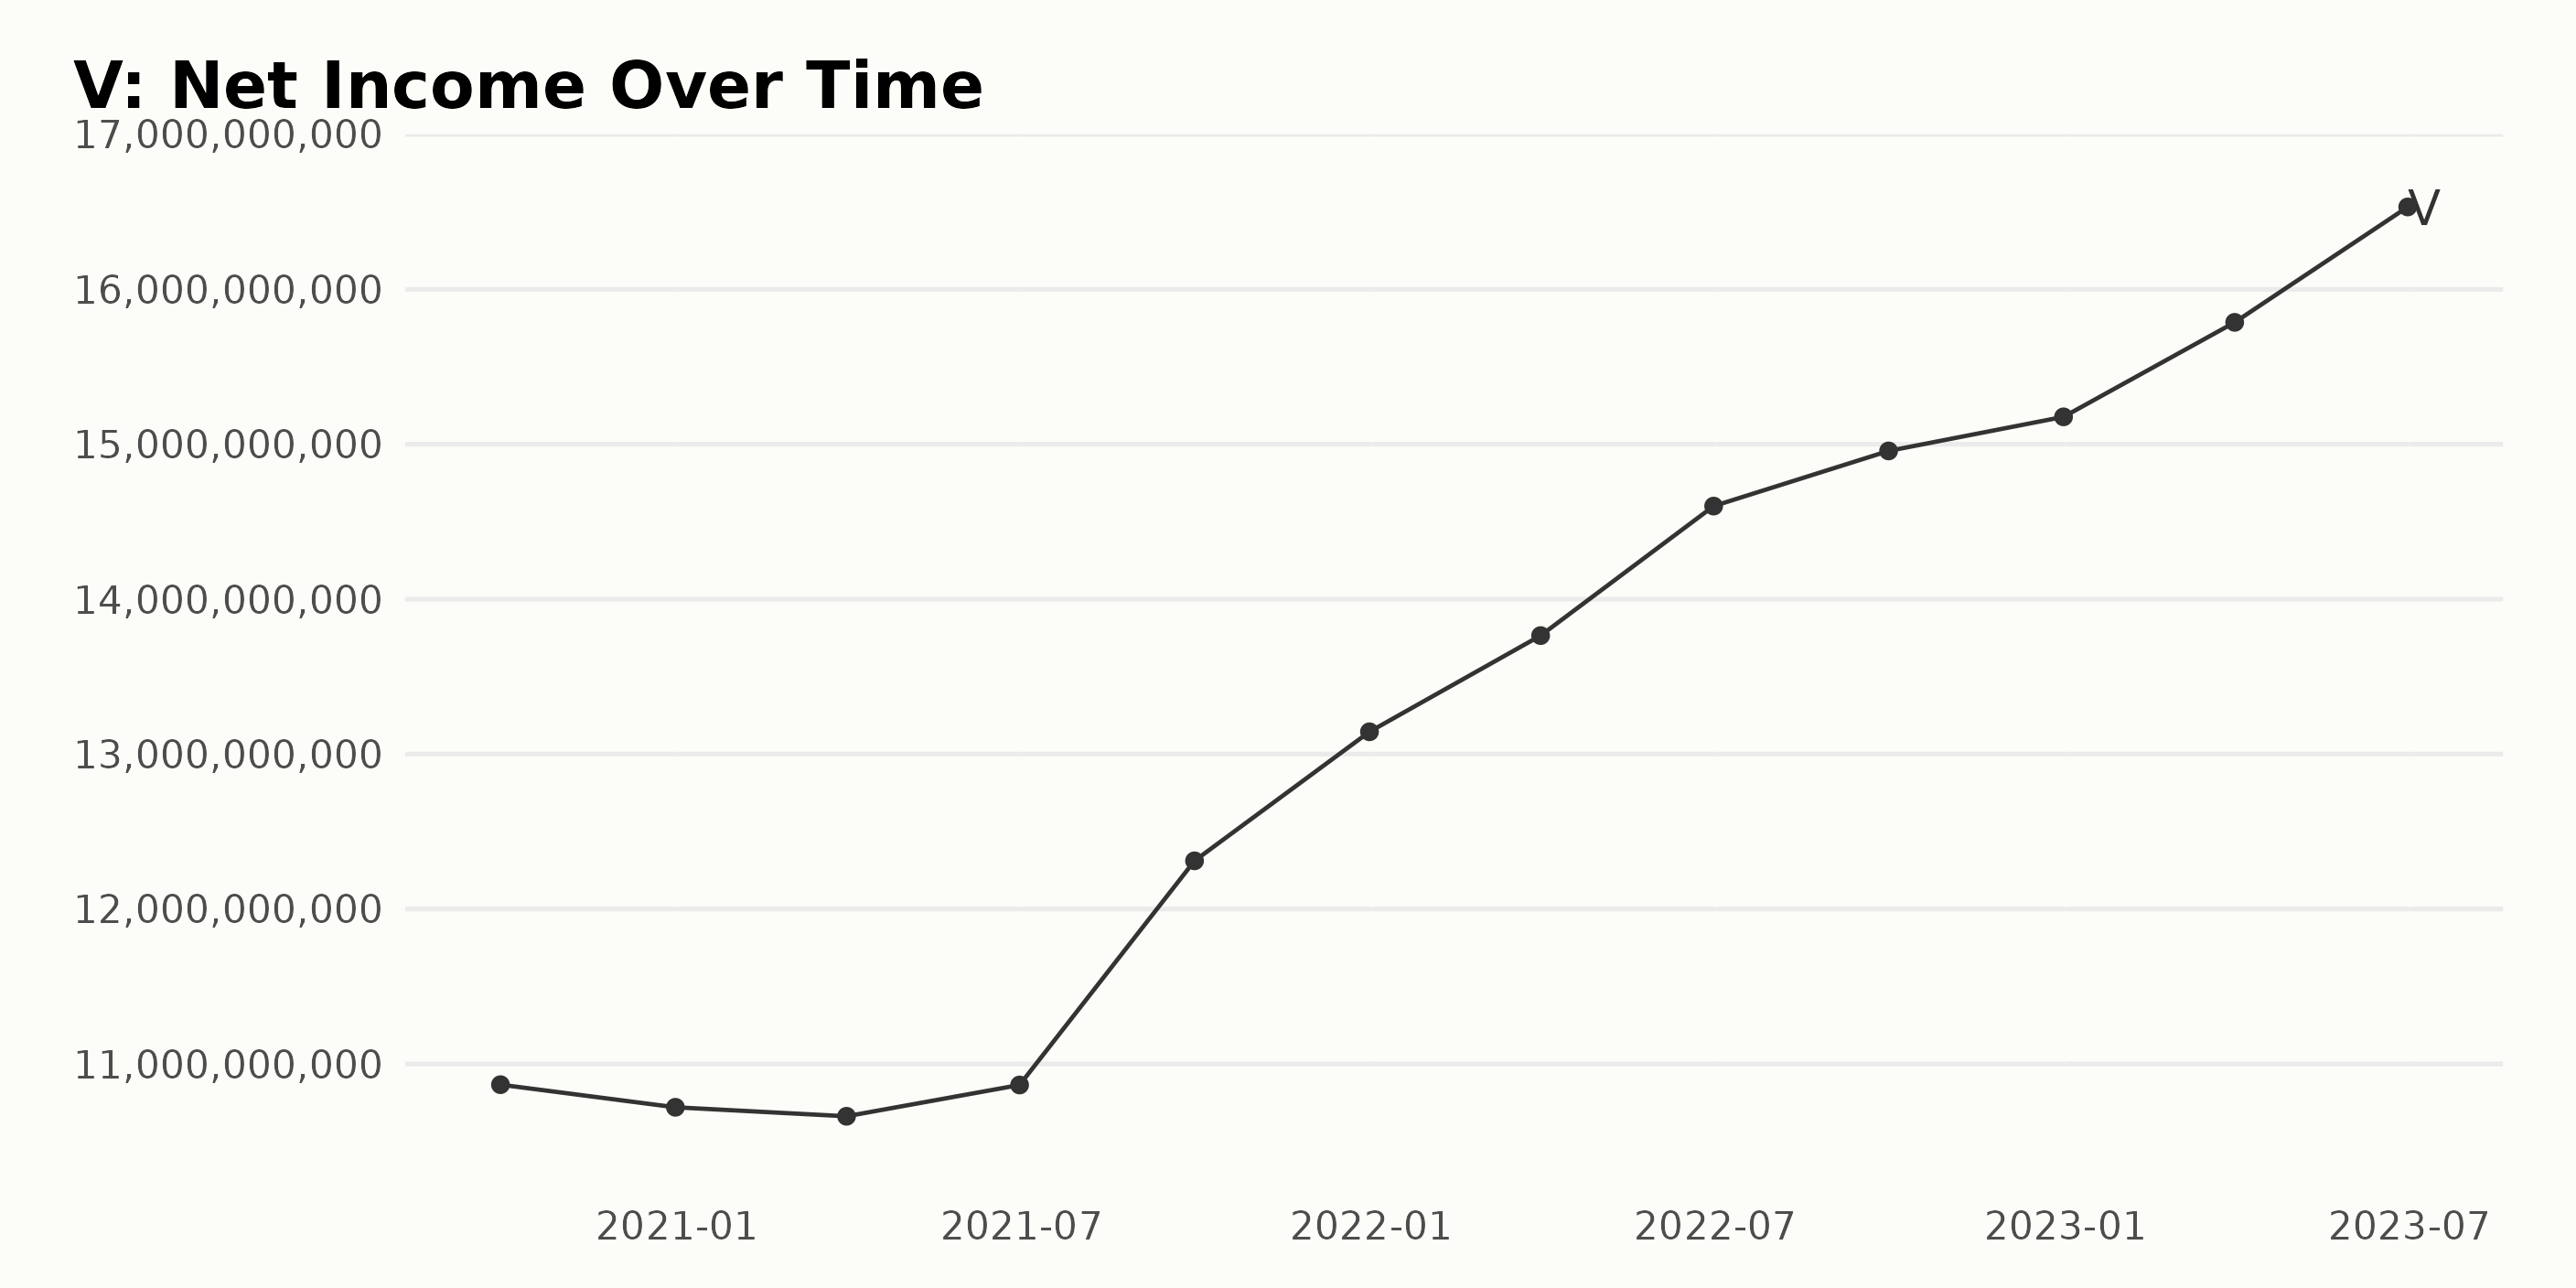
The data shows significant changes in V’s trailing-12-month net income from September 30, 2020, to June 30, 2023.
Short-term Fluctuations:
- On September 30, 2020, net income was $10.866 billion, which experienced minor reductions until March 31, 2021, reaching $10.662 billion.
- A slight increase was observed on June 30, 2021, with net income at $10.864 billion, after which a steady rise ensued until December 31, 2021, ending the year at $13.144 billion.
Recent Trend:
- As of January 1, 2022, a consistent growth pattern can be traced.
- The upward trend persisted until the last recorded value on June 30, 2023, where net income peaked at $16.532 billion.
The overall net income growth rate measured from the first value to the last indicates an increase of about 52.24%. Thus, V's net income showed a strong upward progression over this period, particularly highlighted between 2022 and 2023.
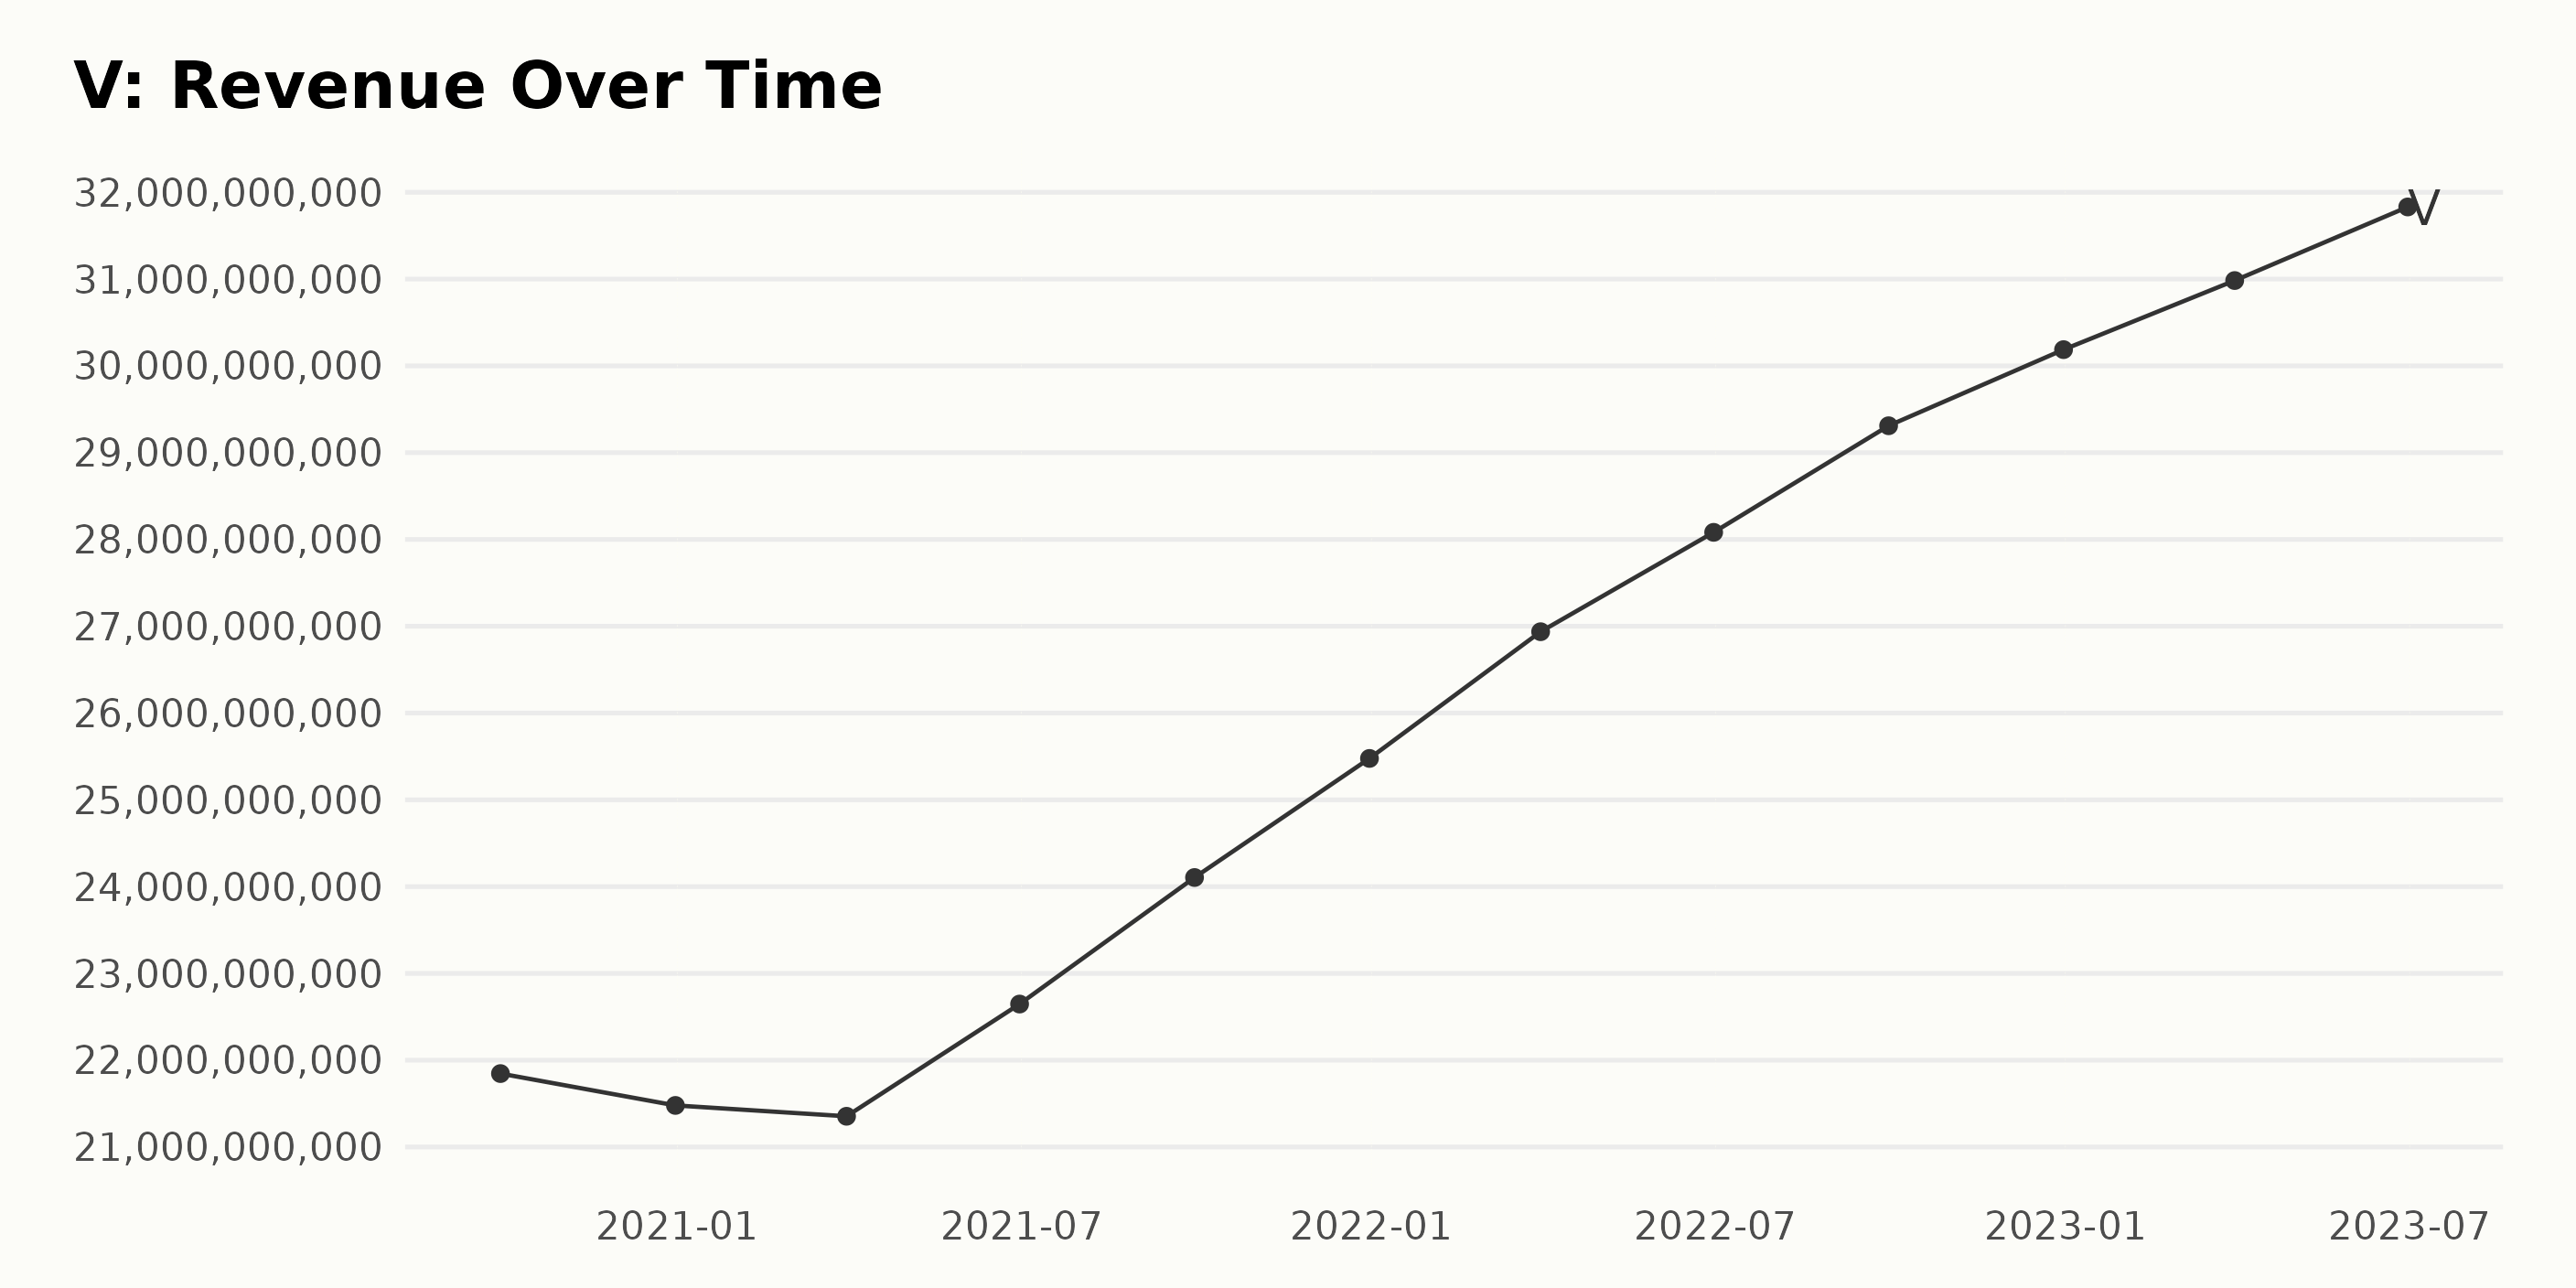
Below is a summary of V’s trailing-12-month revenue trend and fluctuations from 2020 to 2023:
- V’s revenue stood at $21.85 billion on September 30, 2020.
- A slight decrease to $21.48 billion was observed by December 31, 2020.
- By the end of the first quarter of 2021 on March 31, it slightly dipped to $21.35 billion.
- In contrast, there were moderate increases: $22.65 billion and $24.11 billion on June 30, 2021, and September 30, 2021, respectively.
- By the end of 2021, V posted a considerable increase in its revenue at $25.48 billion.
- In the first two quarters of 2022, the company’s revenue grew steadily, recording $26.94 billion by March 31 and $28.08 billion by June 30.
- Going toward the final quarters of 2022, V’s revenue exhibited an upward trend, reaching $29.31 billion in September and finishing the year with a higher value of $30.19 billion in December.
- The upward trend continued into 2023, where V’s revenue stood at $30.98 billion at the end of the first quarter (March 31, 2023), then rose to $31.83 billion by June 30, 2023.
In terms of growth, from $21.85 billion (September 2020) to $31.83 billion (June 2023), V achieved a growth rate of approximately 45.63%. The focus lies mainly on the last value of $31.83 billion in June 2023, indicating a positive trend for V's financial performance.
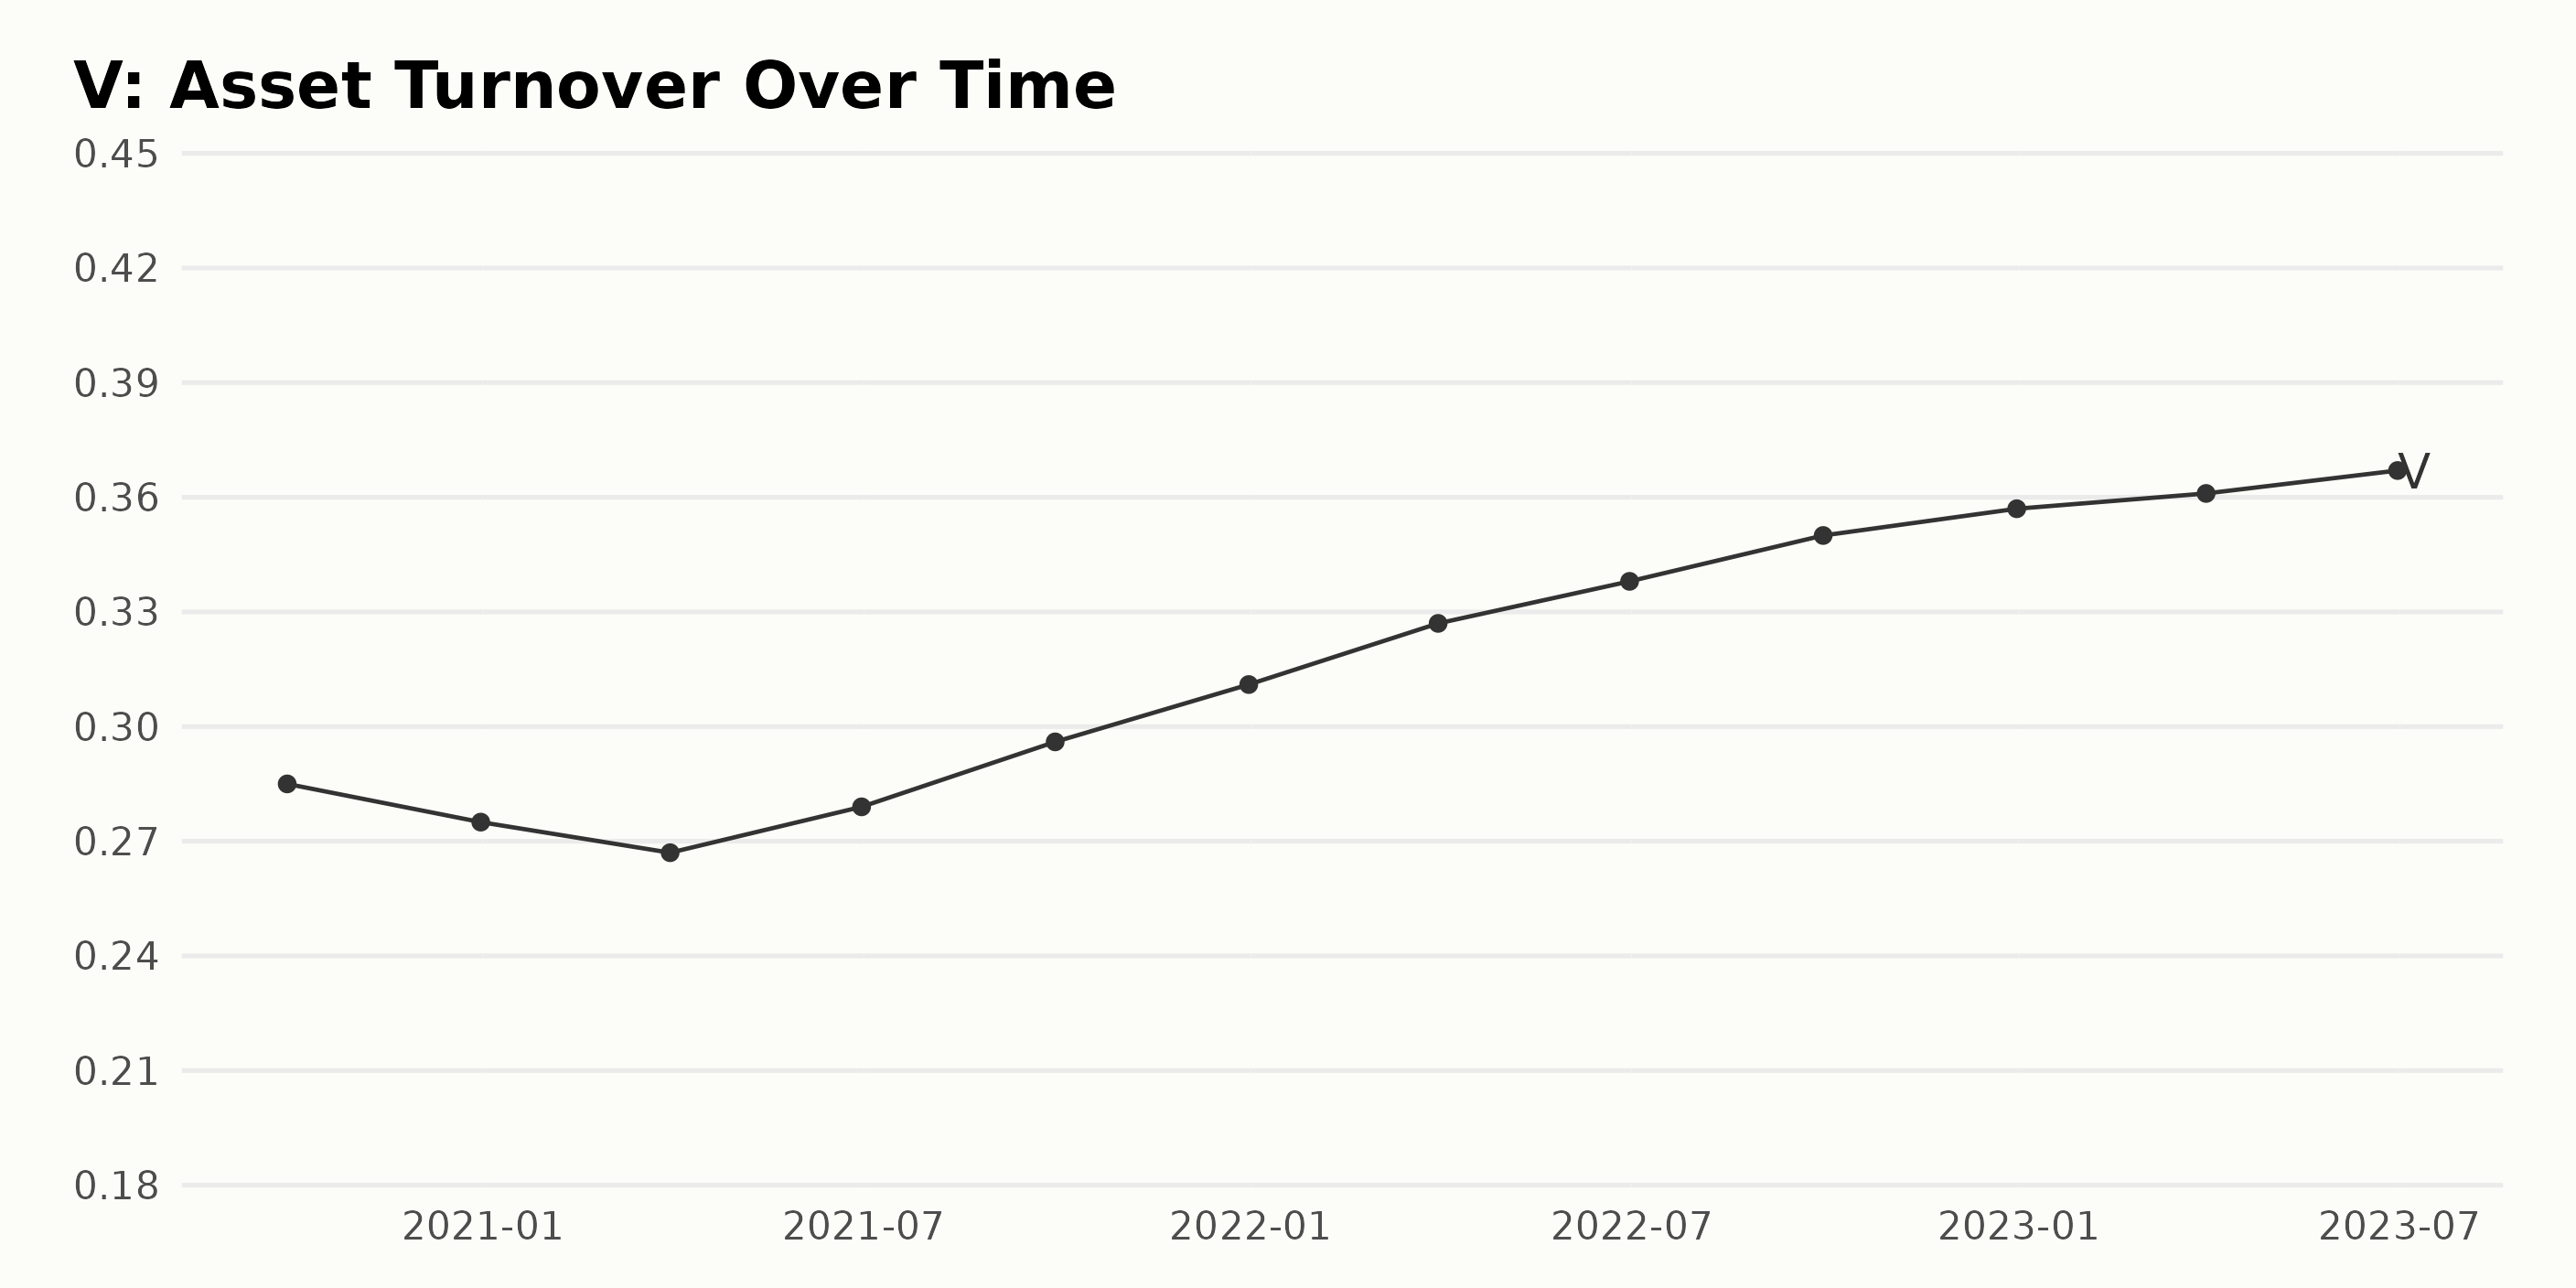
Based on the given data, the following trends and fluctuations in V’s asset turnover can be observed:
- From September 2020 to December 2022, there has been a general upward trend in V's asset turnover.
- It decreased from 0.285 in September 2020 to 0.275 by the end of December 2020.
- After a slight drop in the first quarter of 2021, reaching a low point of 0.267, it gradually improved.
- There has been a steady growth from 0.267 in March 2021 to 0.357 in December 2022. This amounts to an approximate growth rate of 33.71% over this period.
- As of June 2023, the asset turnover stood at 0.367, slightly increasing from December 2022's value of 0.357.
In conclusion, while there were minor fluctuations in the initial stage, V saw a notable improvement in its asset turnover from March 2021 to June 2023.
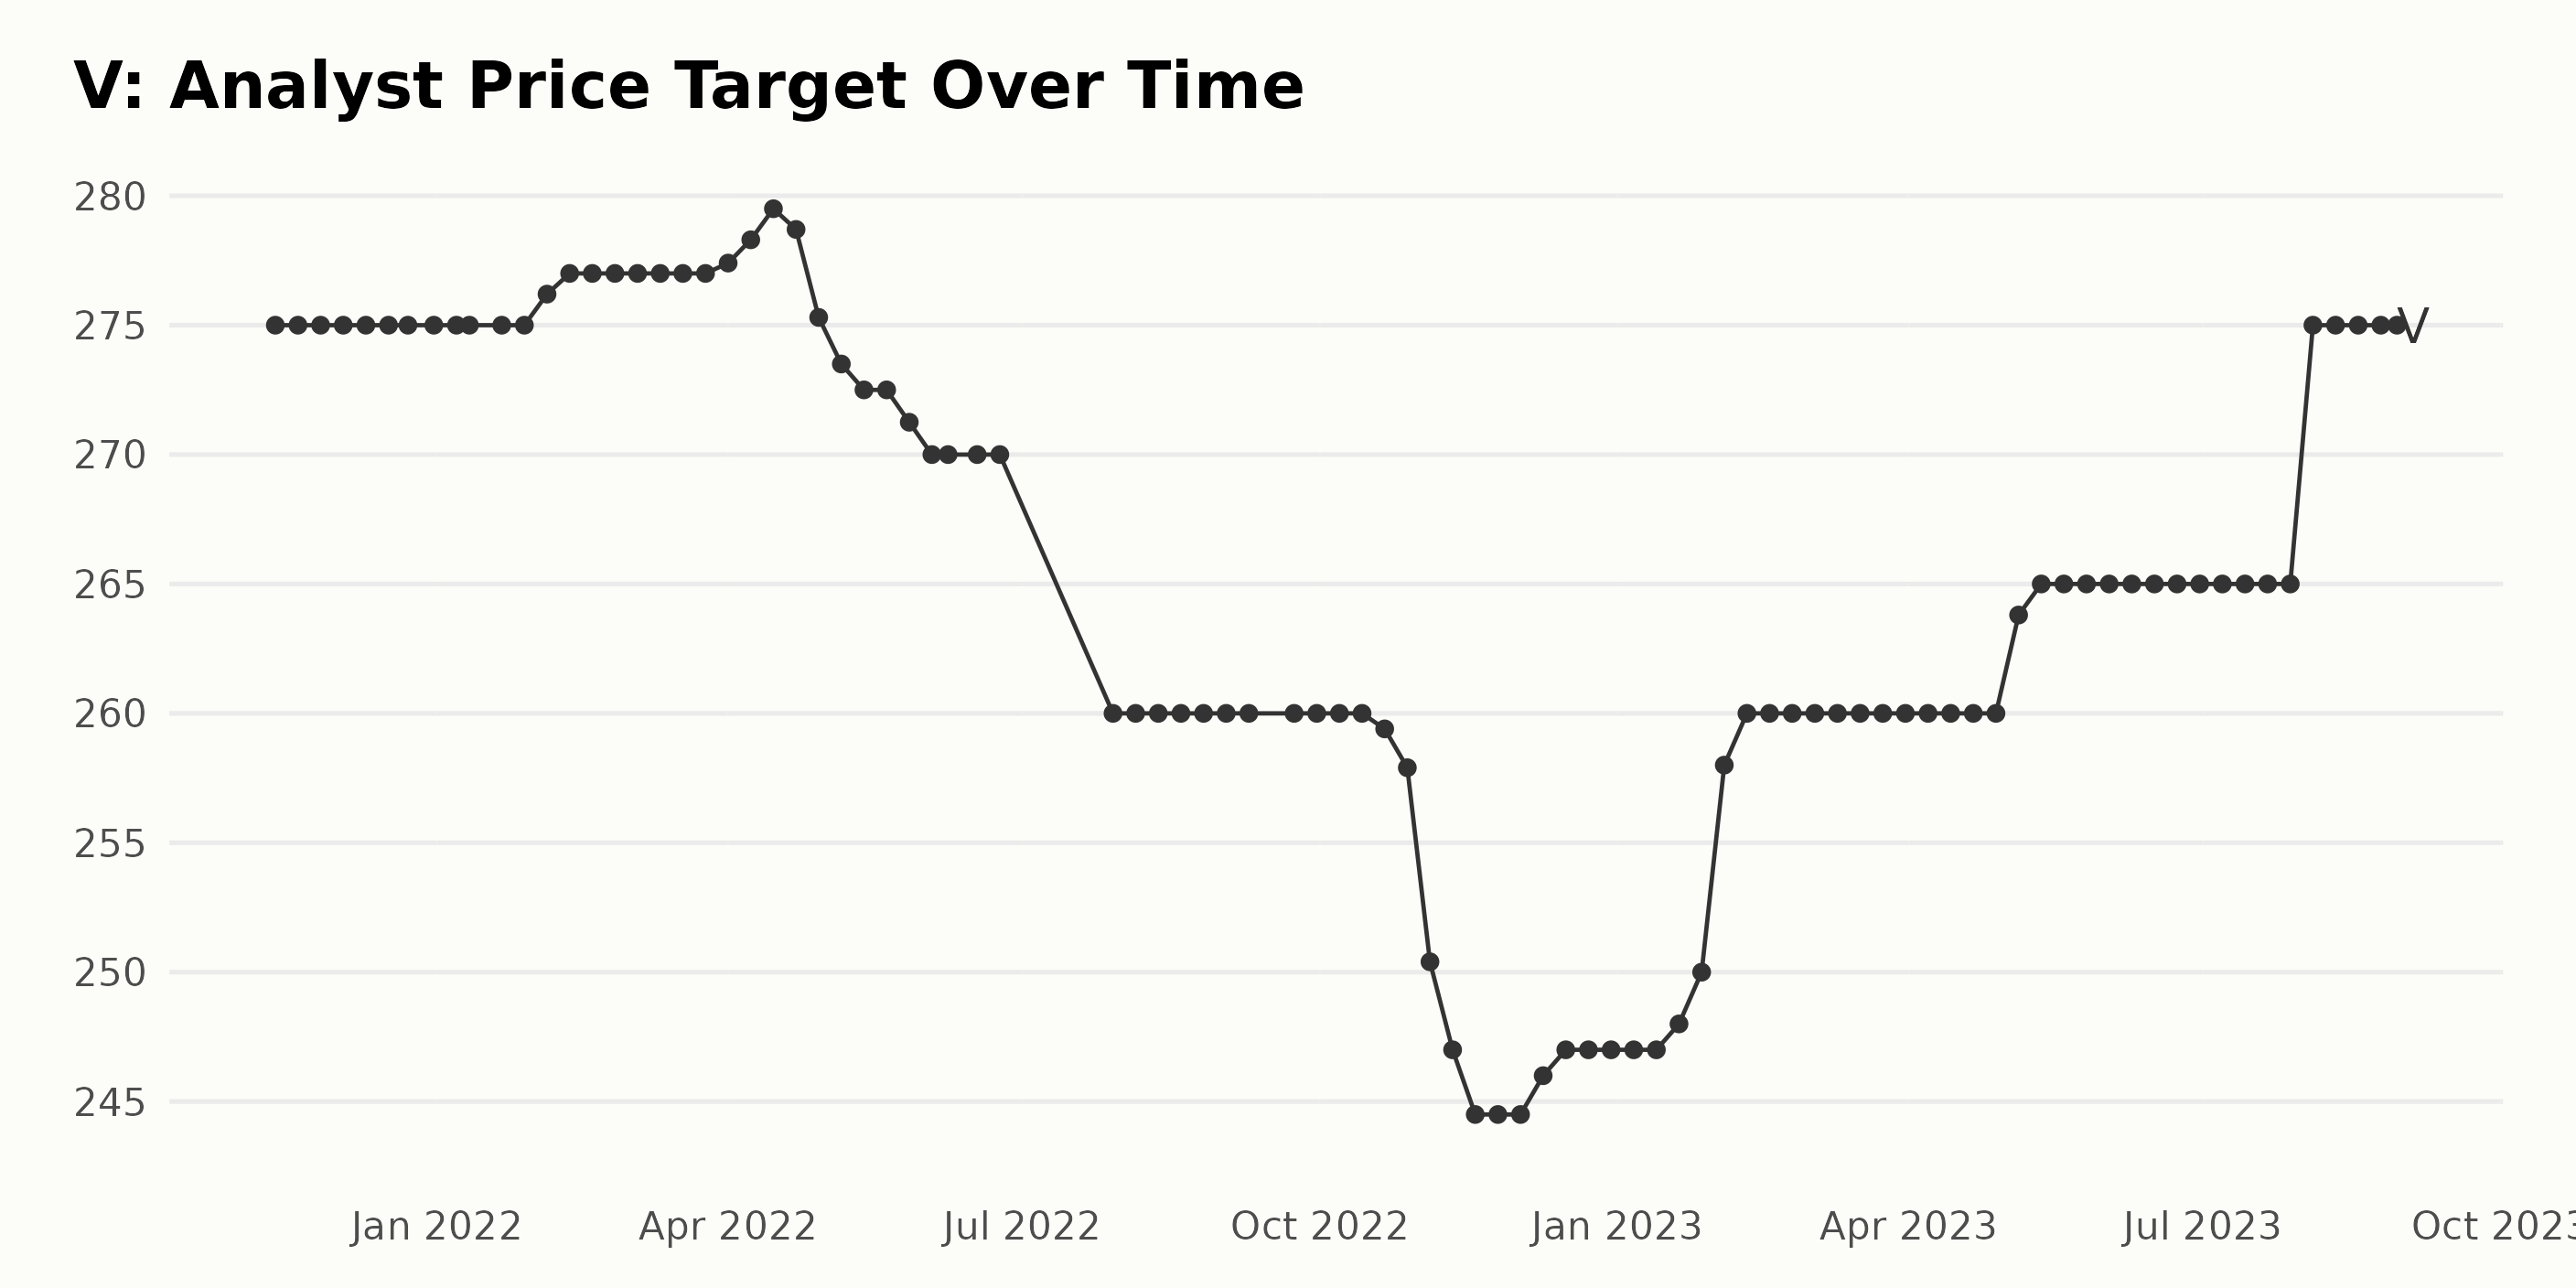
V’s analyst price target shows some fluctuations over the data series, with a general downward trend observed toward the end of 2022, followed by stabilization and an upward surge in 2023.
Key Points:
- Starting at $275 on November 12, 2021, the analyst price target maintained this value until February 4, 2022, when it experienced a slight increase to $276.2.
- Following this, the price target saw incremental growth until April 15, 2022, reaching a peak of $279.5.
- A period of fluctuation ensued, with the prices decreasing to $270 by June 3, 2022, and maintaining that level through late June.
- In late July 2022, it dropped significantly to $260, maintaining this level for an extended period until a further decrease occurred in late October, hitting $250.4 on November 4, 2022.
- The lowest point in the series came on November 18, 2022, when the price fell to $244.5. Subsequently, there was a mild recovery, retained at $247 from mid-December 2022 to January 2023.
- Notable growth was seen from late January 2023 to early February 2023, where it rose from $248 to $260. This upward trajectory was then maintained until early May 2023.
- A slight increase to $263.8 was seen on May 5, 2023, which rose to $265 within a week and remained at this price target through July 2023.
- Finally, the last recorded price in this series is $275 on August 30, 2023, showing a return to the initial values observed in November 2021.
This data reflects the analyst price targets circular pattern over this time series. However, the fluctuations and trends within this time frame provide valuable insights into the shifts and uncertainty in V’s market's perception.
Analyzing V’s Share Price Trends and Growth: March to August 2023
Upon analyzing the given data, the following trends and rates of growth for V’s share prices are observed:
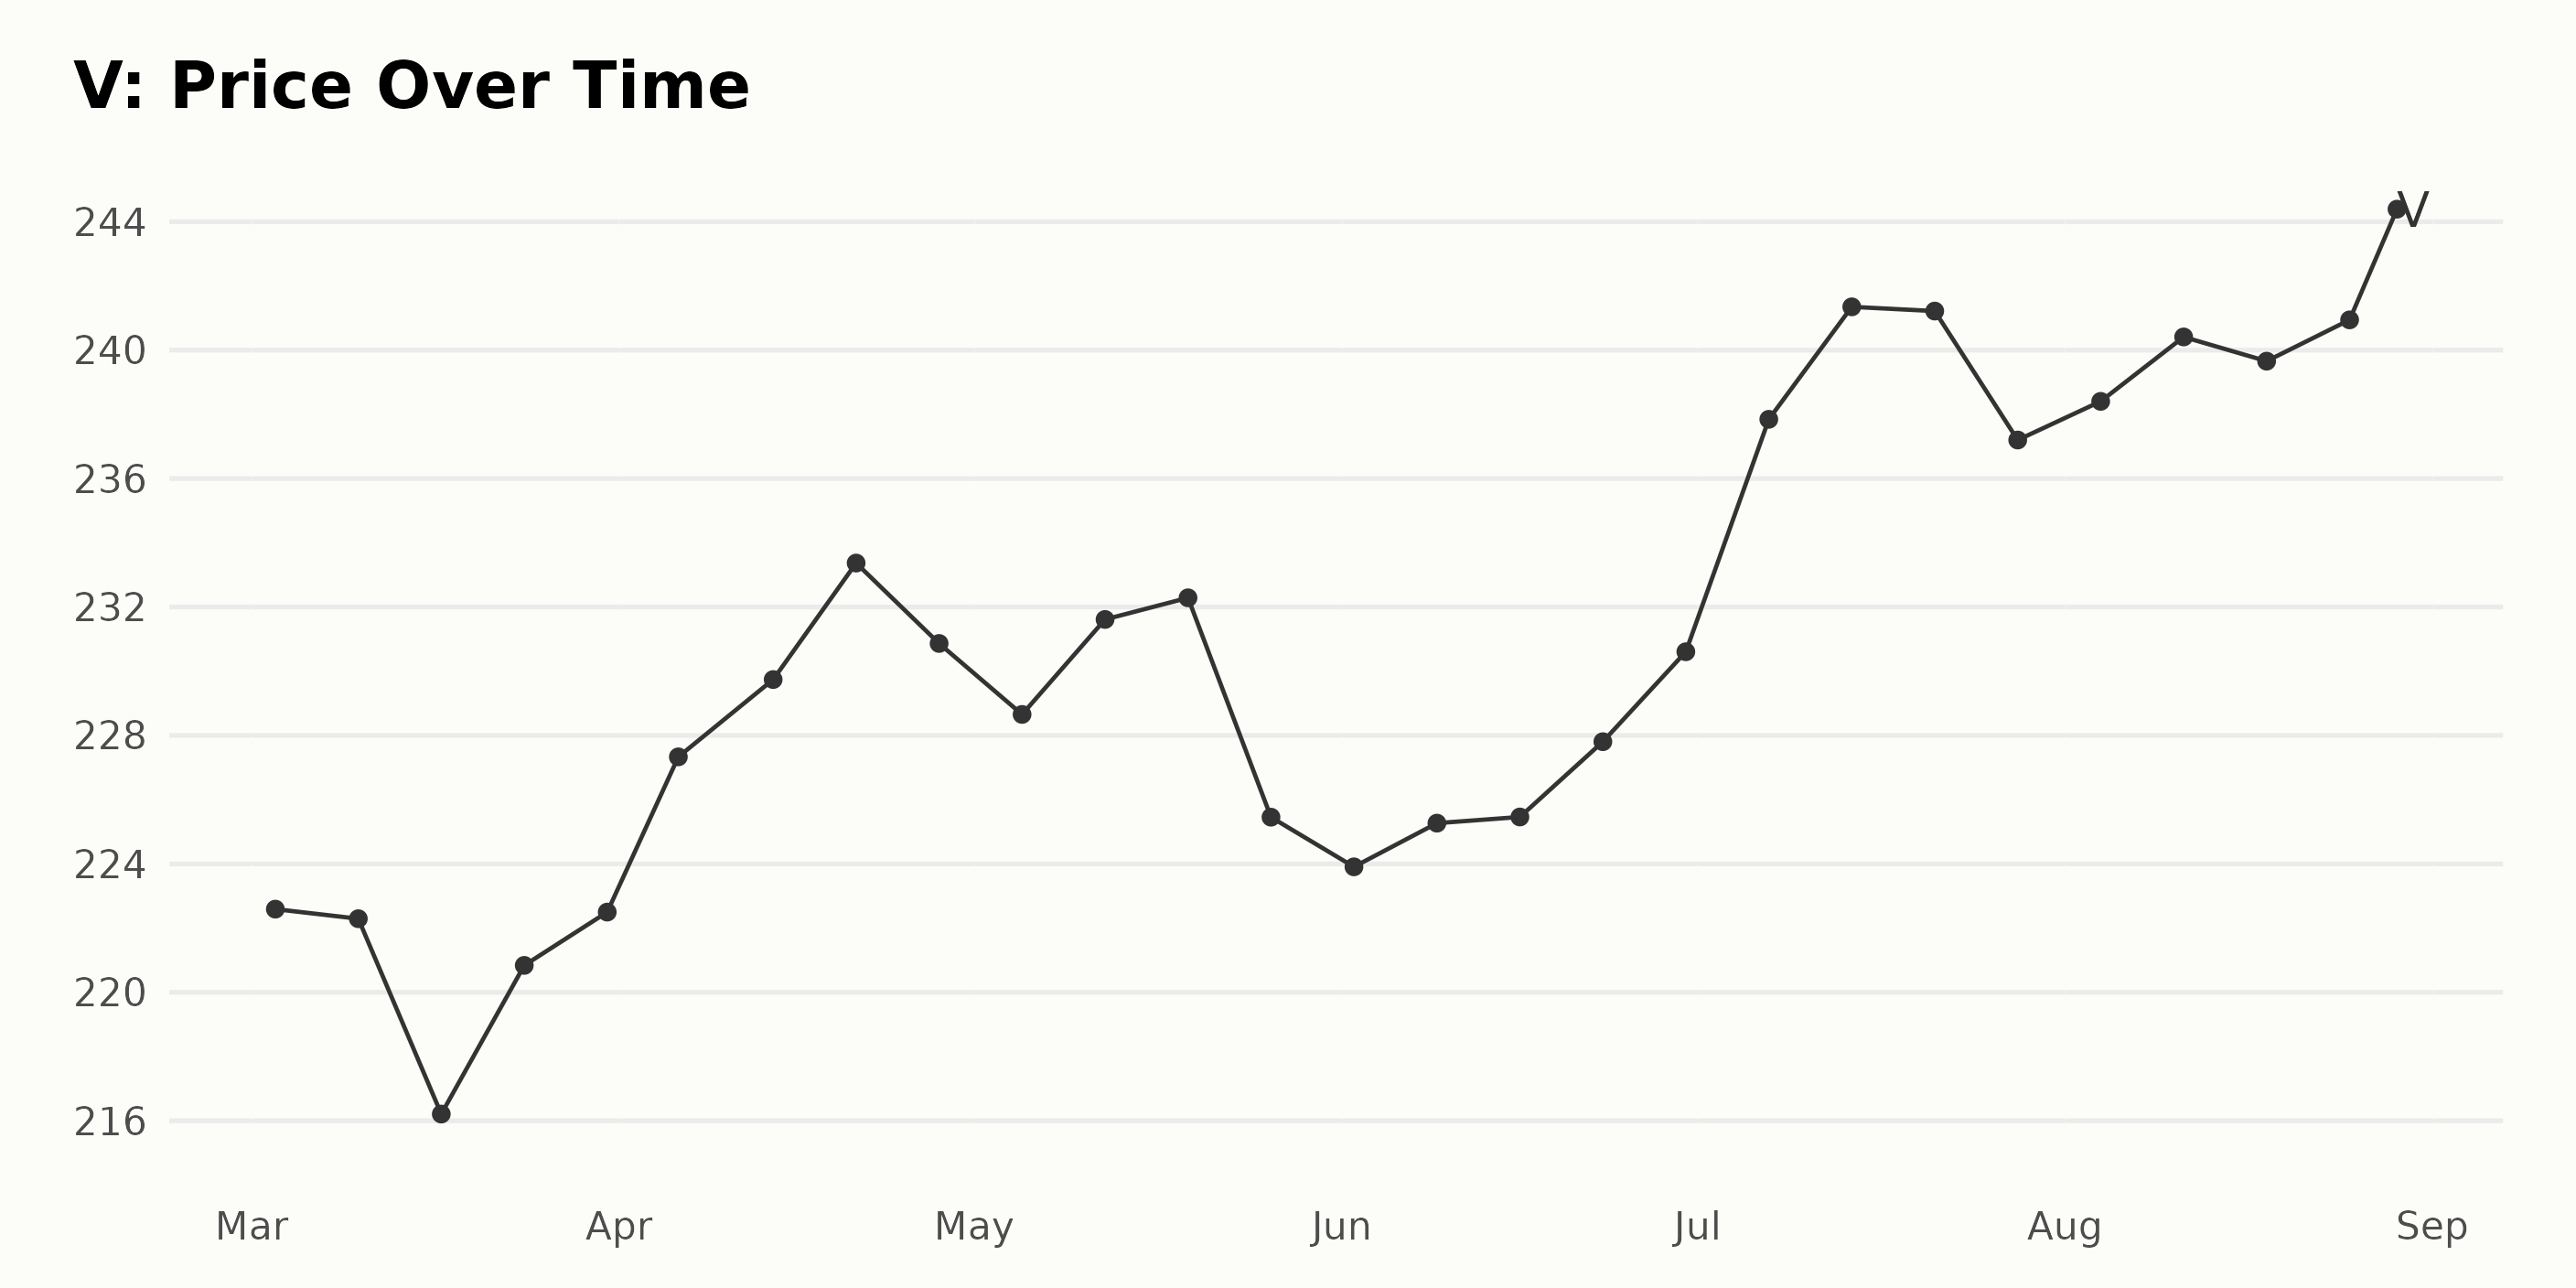
- In March 2023, V’s share prices moved in a fluctuating manner. It started at $222.59 on March 3 and dipped to $216.21 on March 17 before climbing back up to $222.50 on March 31.
- April saw an overall increase in the share price, with a subsequent rise from $227.33 on April 6 to $233.37 by April 21. However, the price slightly dropped to $230.86 on April 28.
- The prices in May were a bit unstable, with some increase from $228.65 on May 5 to $232.29 on May 19, but dropping again to $225.45 by the end of May.
- June prices remained relatively stable compared to previous months, with a lowest of $223.91 on June 2 and a highest of $230.61 on June 30.
- A notable increase is seen in July, with the price jumping from $237.84 on July 7 to its peak at $241.35 on July 14.
- A slight decrease in price happens in late July, with $237.20 on July 28. However, through August 2023, there was another steady increase, starting at $238.40 on August 4 and peaking at $244.39 on August 29.
To summarize, apart from minor fluctuations, there is an overall growth trend in V’s share prices from March to August 2023. The prices seem to experience a gradual increase despite occasional dips. Despite these, the trend depicts a general success trajectory, cumulating in the highest value seen for the data period on August 29 at $244.39. Here is a chart of V's price over the past 180 days.
Examining V's High-Performance Ratings: Quality, Stability, and Momentum
As of the most recent data available, for the week of August 29, 2023, V has an overall POWR Ratings of B (Buy) in the Consumer Financial Services category. It ranks #6 out of the 50 stocks in this category. Below is a historical overview of V's POWR Grade and its rank in the category:
- Week of March 4, 2023: POWR Grade B, rank #5
- Week of April 1, 2023: POWR Grade B, rank #5
- Week of May 6, 2023: POWR Grade B, rank #1 (best ranking)
- Week of June 3, 2023: POWR Grade B, rank #4
- Week of July 1, 2023: POWR Grade B, rank #3
- Week of August 5, 2023: POWR Grade B, rank #4
- Week of August 30, 2023: POWR Grade B, rank #6 (most recent)
Over these weeks, V has consistently maintained a POWR grade of B (Buy) but fluctuated within the top ten rankings among its counterparts.
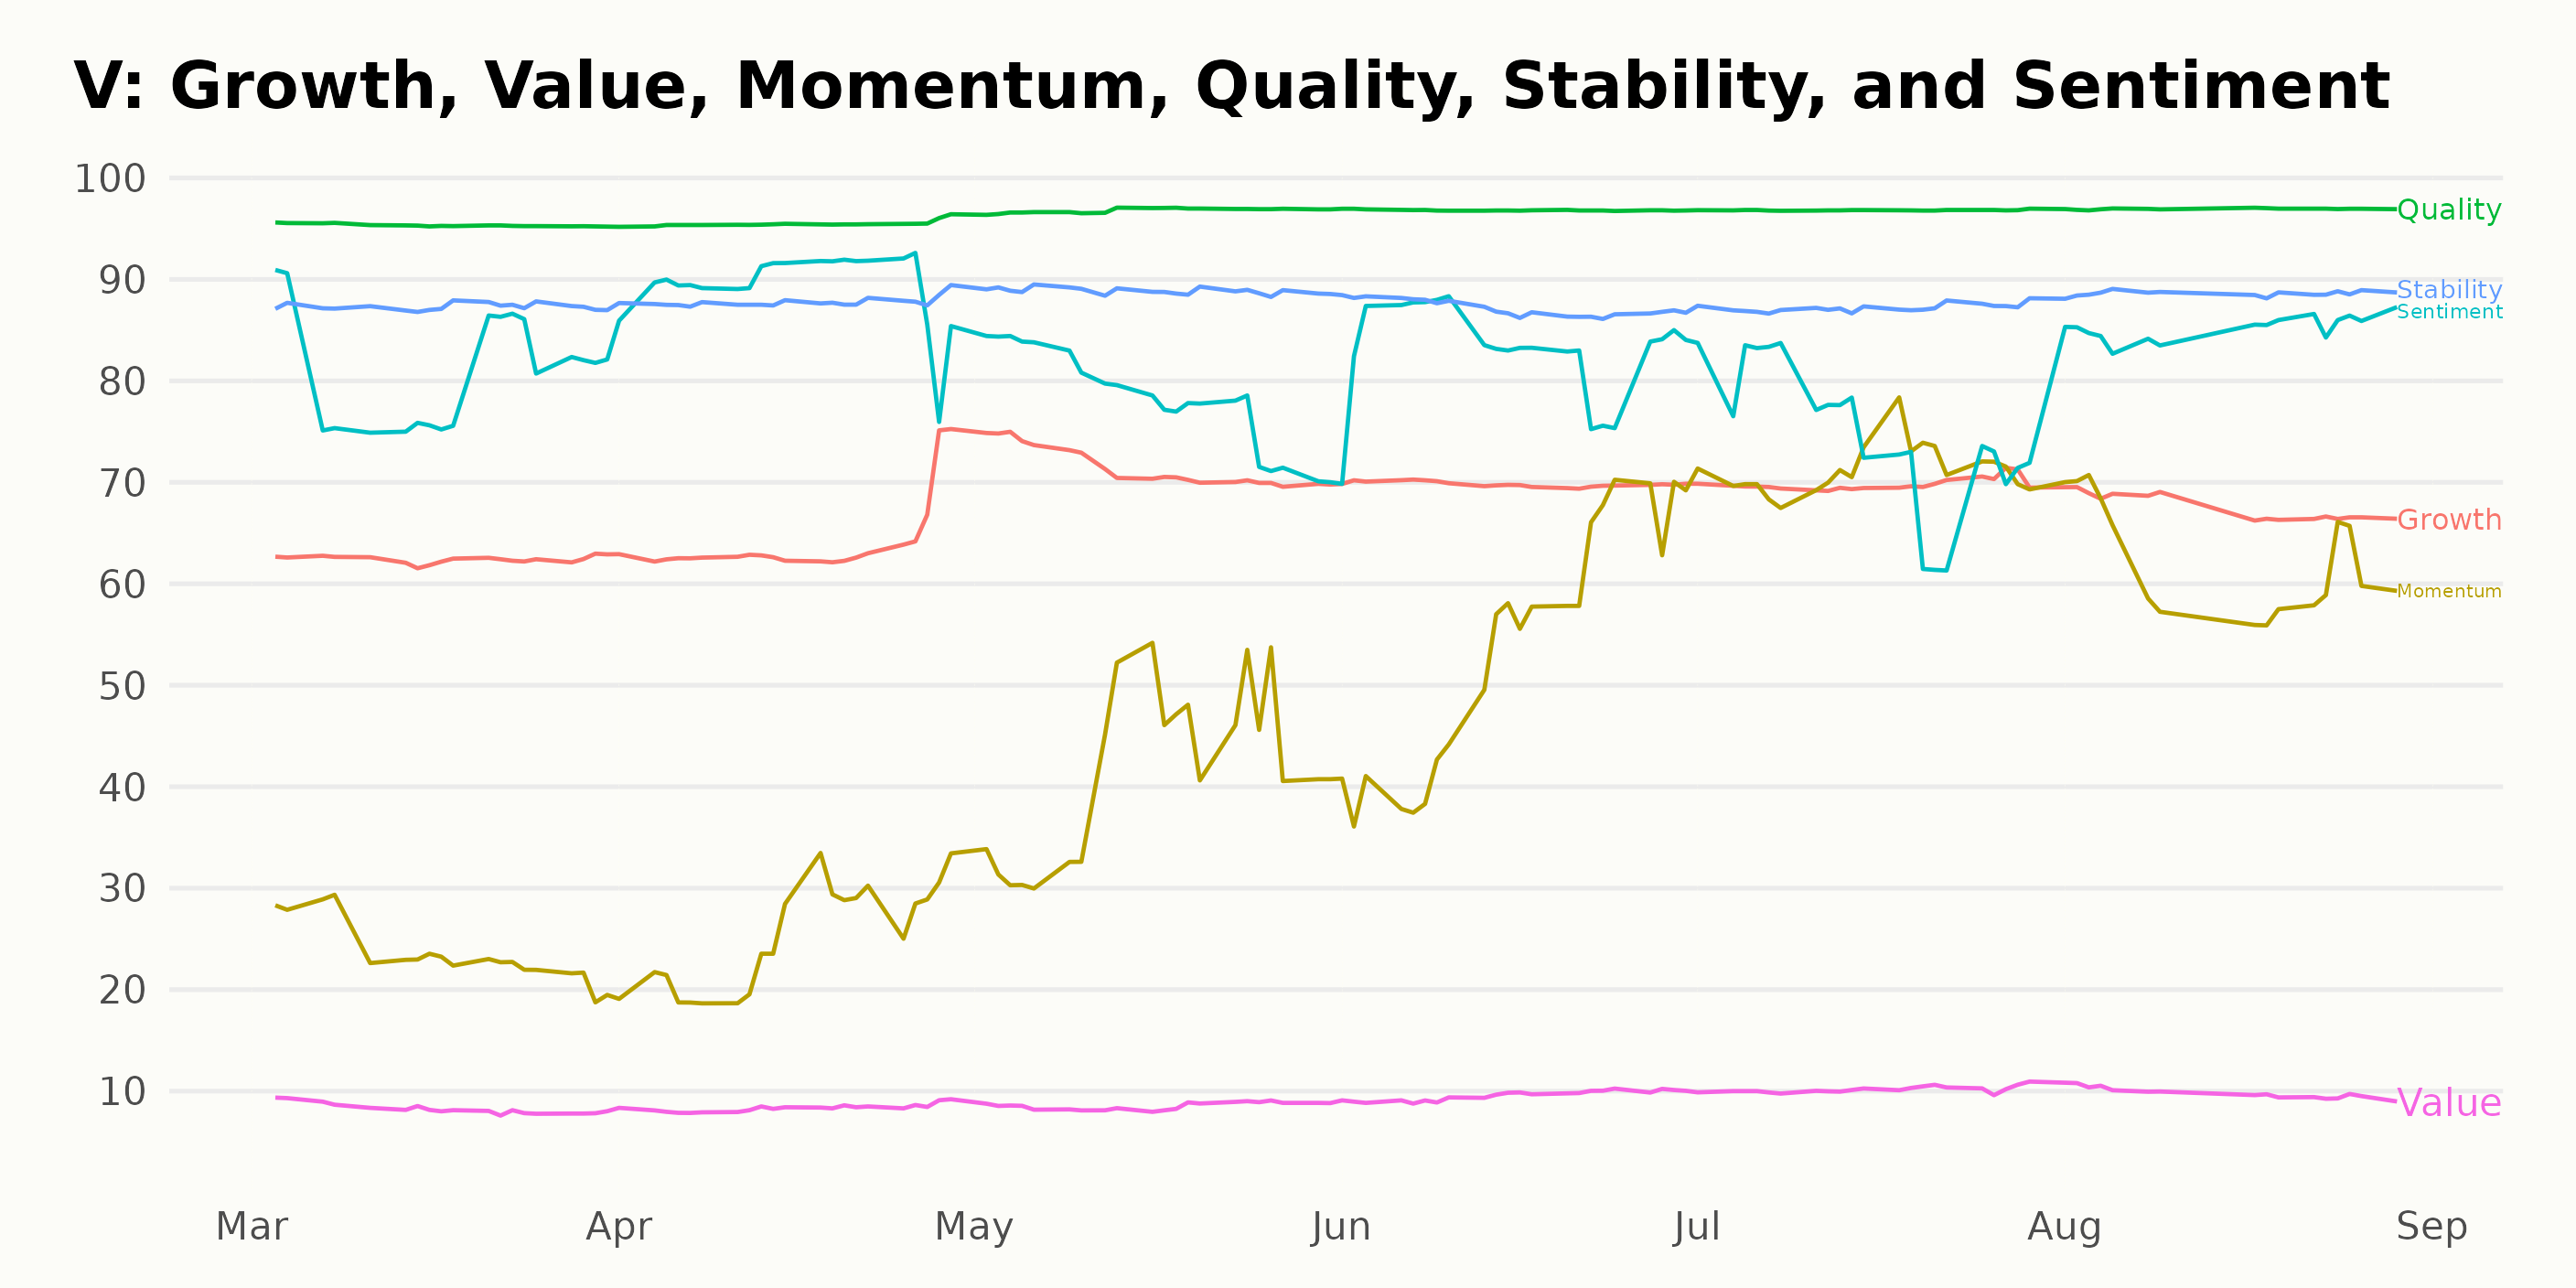
The POWR Ratings for V significantly stand out along three dimensions: Quality, Stability, and Momentum. These three dimensions consistently showcase the highest ratings.
- Quality: V has consistently high ratings in Quality. Starting at 95 in March 2023, it holds on to this score through April 2023. The rating increases to 97 by May 2023, a value it retains through August 2023. Given these figures, the consistency in high performance is notable in this dimension.
- Stability: The Stability dimension for V also presents a strong performance. While it starts at 87 in March 2023, it slowly and steadily climbs to 89 by May 2023. This upward trend continues, remaining steady at 89 through August 2023. This suggests that stability has seen marginal but consistent growth over these months.
- Momentum: V’s Momentum ratings, starting from a modest score of 23 in March 2023, show a substantial upward trend across the following months. By July 2023, the momentum score moves up to 71, marking a significant increase. It then moderates to 62 by August 2023. The continual rise over these months shows a strong positive trend in Momentum.
In conclusion, looking at the Quality, Stability, and Momentum dimensions, V shows a consistent trend toward high performance. Quality remains consistently high throughout, while Stability and Momentum show remarkable improvement over the period.
How Does Visa Inc. (V) Stack Up Against Its Peers?
While V has an overall grade of B, equating to a Buy rating, you may also check out the other stocks within the Consumer Financial Services industry: Regional Management Corp. (RM), Enova International Inc. (ENVA), and Mastercard Incorporated (MA), with a B (Buy) rating. For exploring more A and B-rated Consumer Financial Services stocks, click here.
What To Do Next?
Get your hands on this special report with 3 low priced companies with tremendous upside potential even in today’s volatile markets:
3 Stocks to DOUBLE This Year >
V shares were trading at $247.17 per share on Wednesday morning, up $1.83 (+0.75%). Year-to-date, V has gained 19.66%, versus a 18.64% rise in the benchmark S&P 500 index during the same period.
About the Author: Sristi Suman Jayaswal

The stock market dynamics sparked Sristi's interest during her school days, which led her to become a financial journalist. Investing in undervalued stocks with solid long-term growth prospects is her preferred strategy. Having earned a master's degree in Accounting and Finance, Sristi hopes to deepen her investment research experience and better guide investors.
The post Should Investors Cash in on Visa (V) Now? appeared first on StockNews.com