
NVIDIA Corporation (NVDA) stands as a mega-cap chip giant in the Artificial Intelligence (AI) industry by virtue of its Graphics Processing Units (GPUs), which support accelerated computing.
With the era of generative AI upon us, the company is seeing heightened interest from global cloud service providers, internet companies, and large language model startups. This is reflected in NVDA’s stock performance, which has gained 234.1% year-to-date.
Contrarily, the company faces regulatory restrictions as the United States and China engage in a race to be the global tech superpower. Subsequently, in October, NVDA’s share hit a near five-month low when a Wall Street Journal report dropped that it could be forced to cancel up to $5 billion worth of advanced chip orders to China.
Although the Biden administration is in talks with the company about permitting some AI chips to be sold to China, the administration has also stated that it cannot sell its most advanced chips to Chinese companies.
Therefore, we think investors should wait for a more opportune moment to invest in NVDA’s stock. Let’s look at the trends of its key financial metrics to gain further insight.
Two-Year Financial Performance Review: A Shift-by-Shift Analysis of NVIDIA Corporation's Key Metrics (2021-2023)
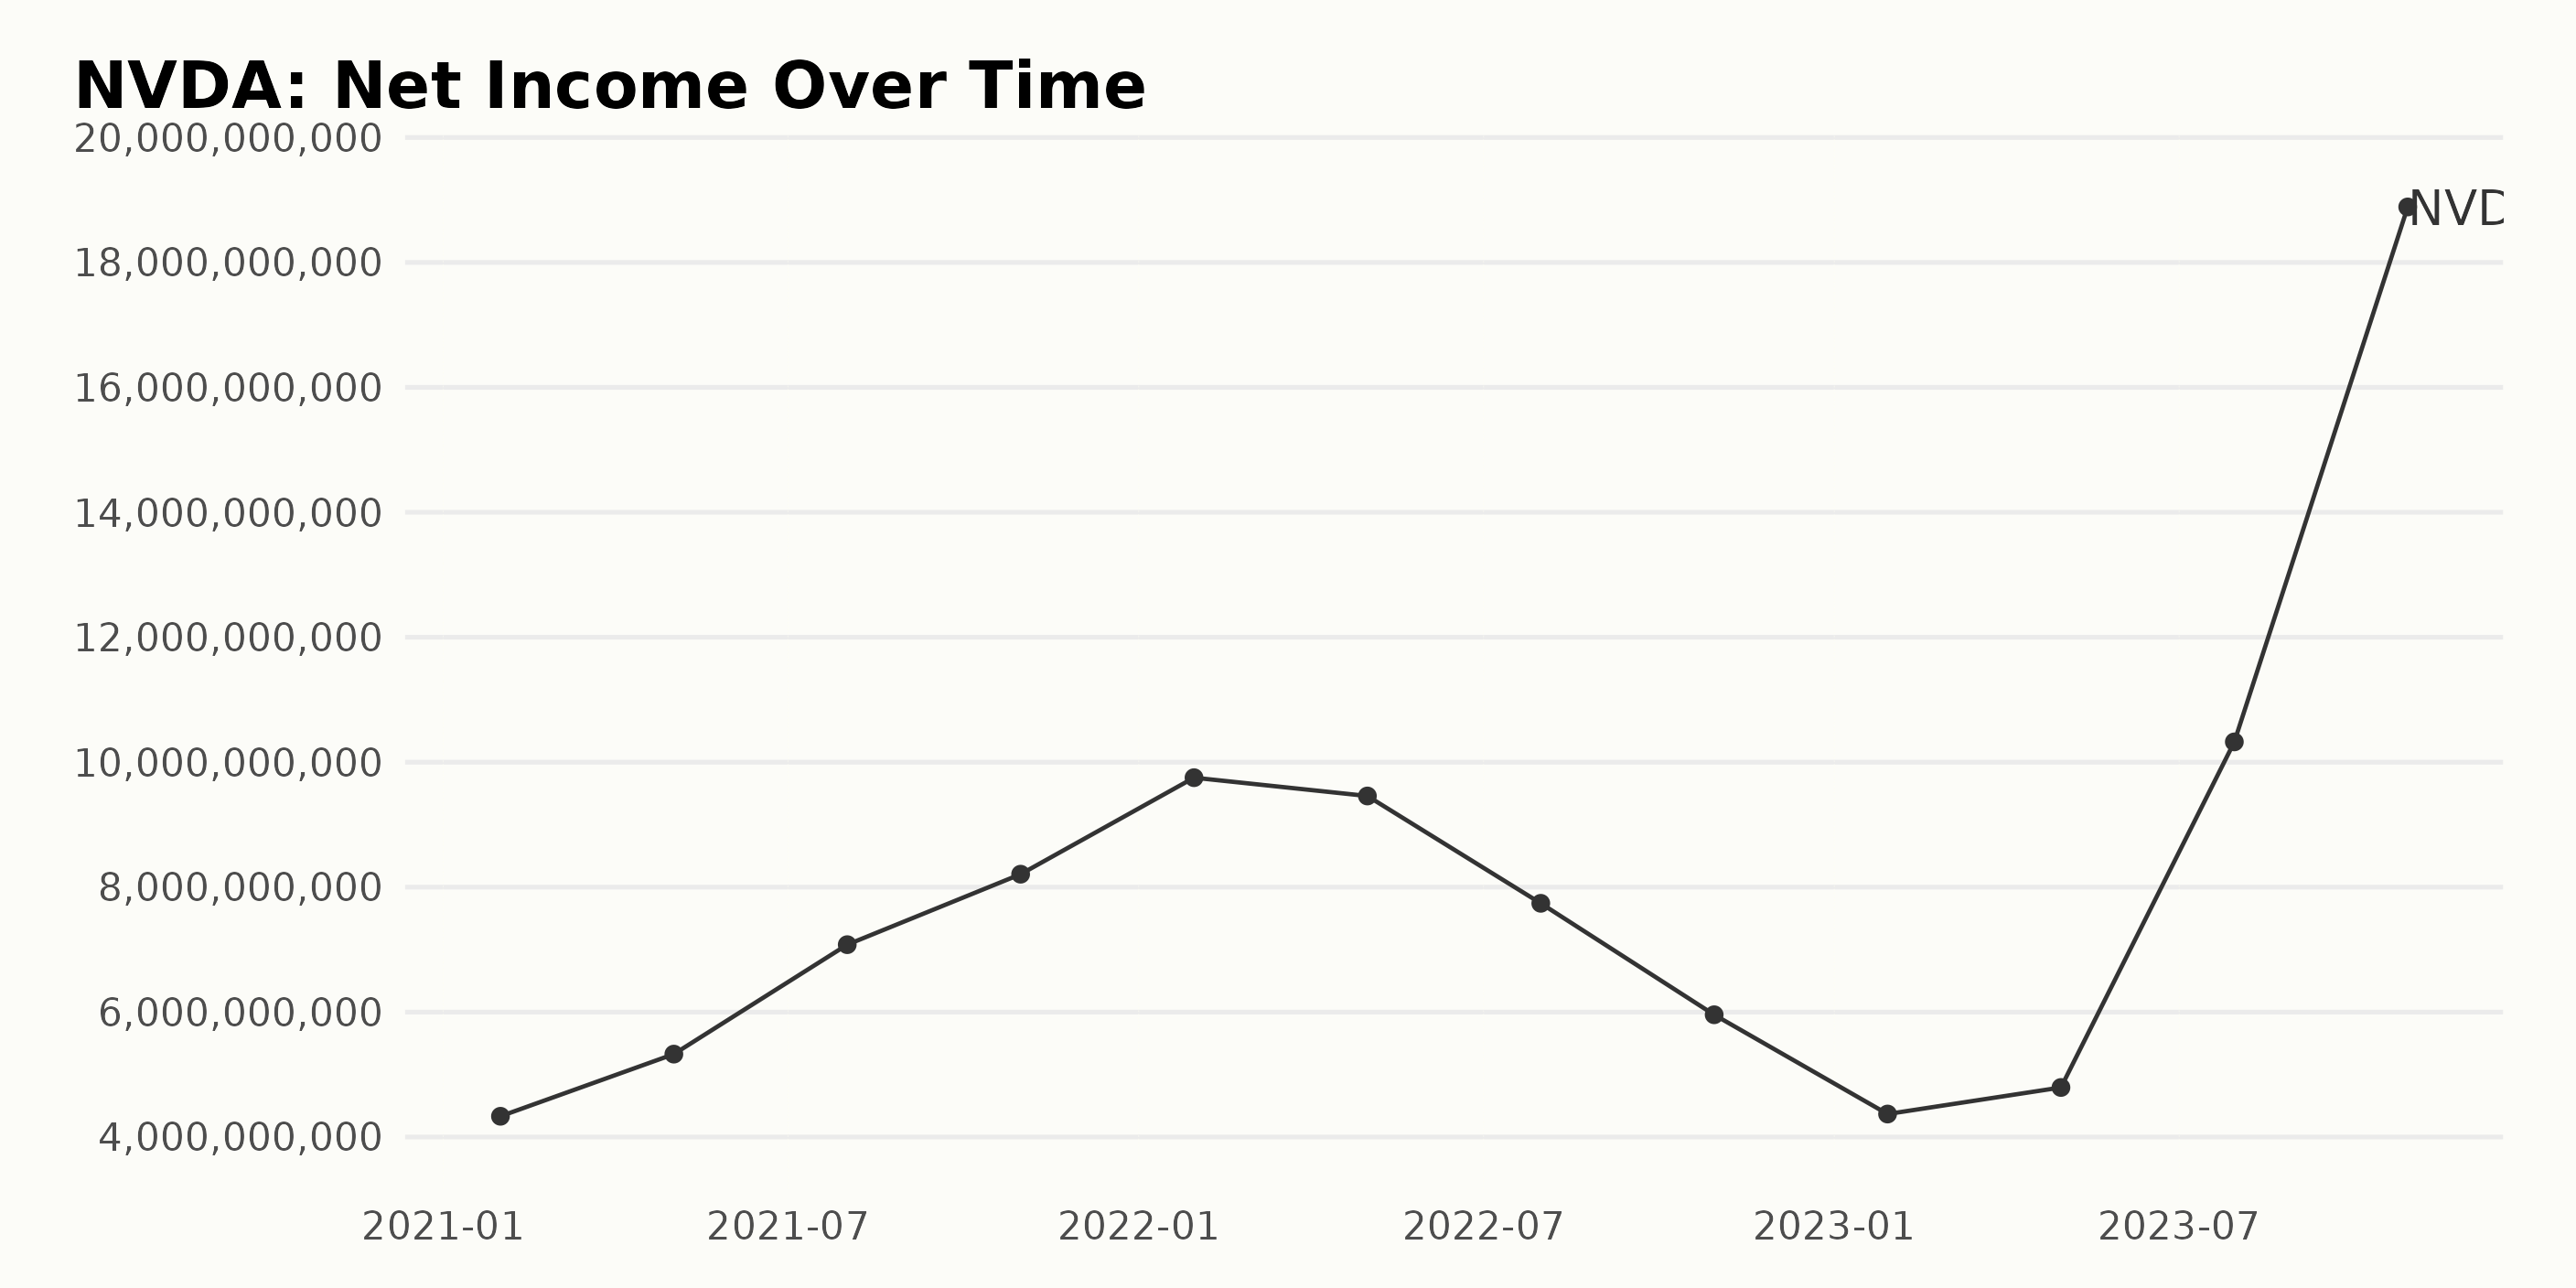
The trailing-12-month net income of NVDA has exhibited immense fluctuation over the period depicted in your dataset, which spans from January 2021 to October 2023.
- On January 31, 2021, NVDA had a net income of $4.33 billion, which gradually increased in the subsequent months.
- In May 2022, NVDA’s net income peaked at $9.46 billion before seeing a significant drop to $5.96 billion in October of the same year.
- Following this downward trend, the corporation experienced an even steeper decline, with the net income falling to $4.37 billion by January 2023.
- An incredible recovery was witnessed between April and October 2023. The net income registered a steady growth to $4.79 billion in April, then surged to an all-time high of $18.88 billion in October 2023.
The net income growth rate from January 2021 ($4.33 billion) to October 2023 ($18.88 billion) is approximately 336%. However, it's worth noting that the performance in recent quarters has been highly volatile, suggesting market turbulence or significant shifts within the company.
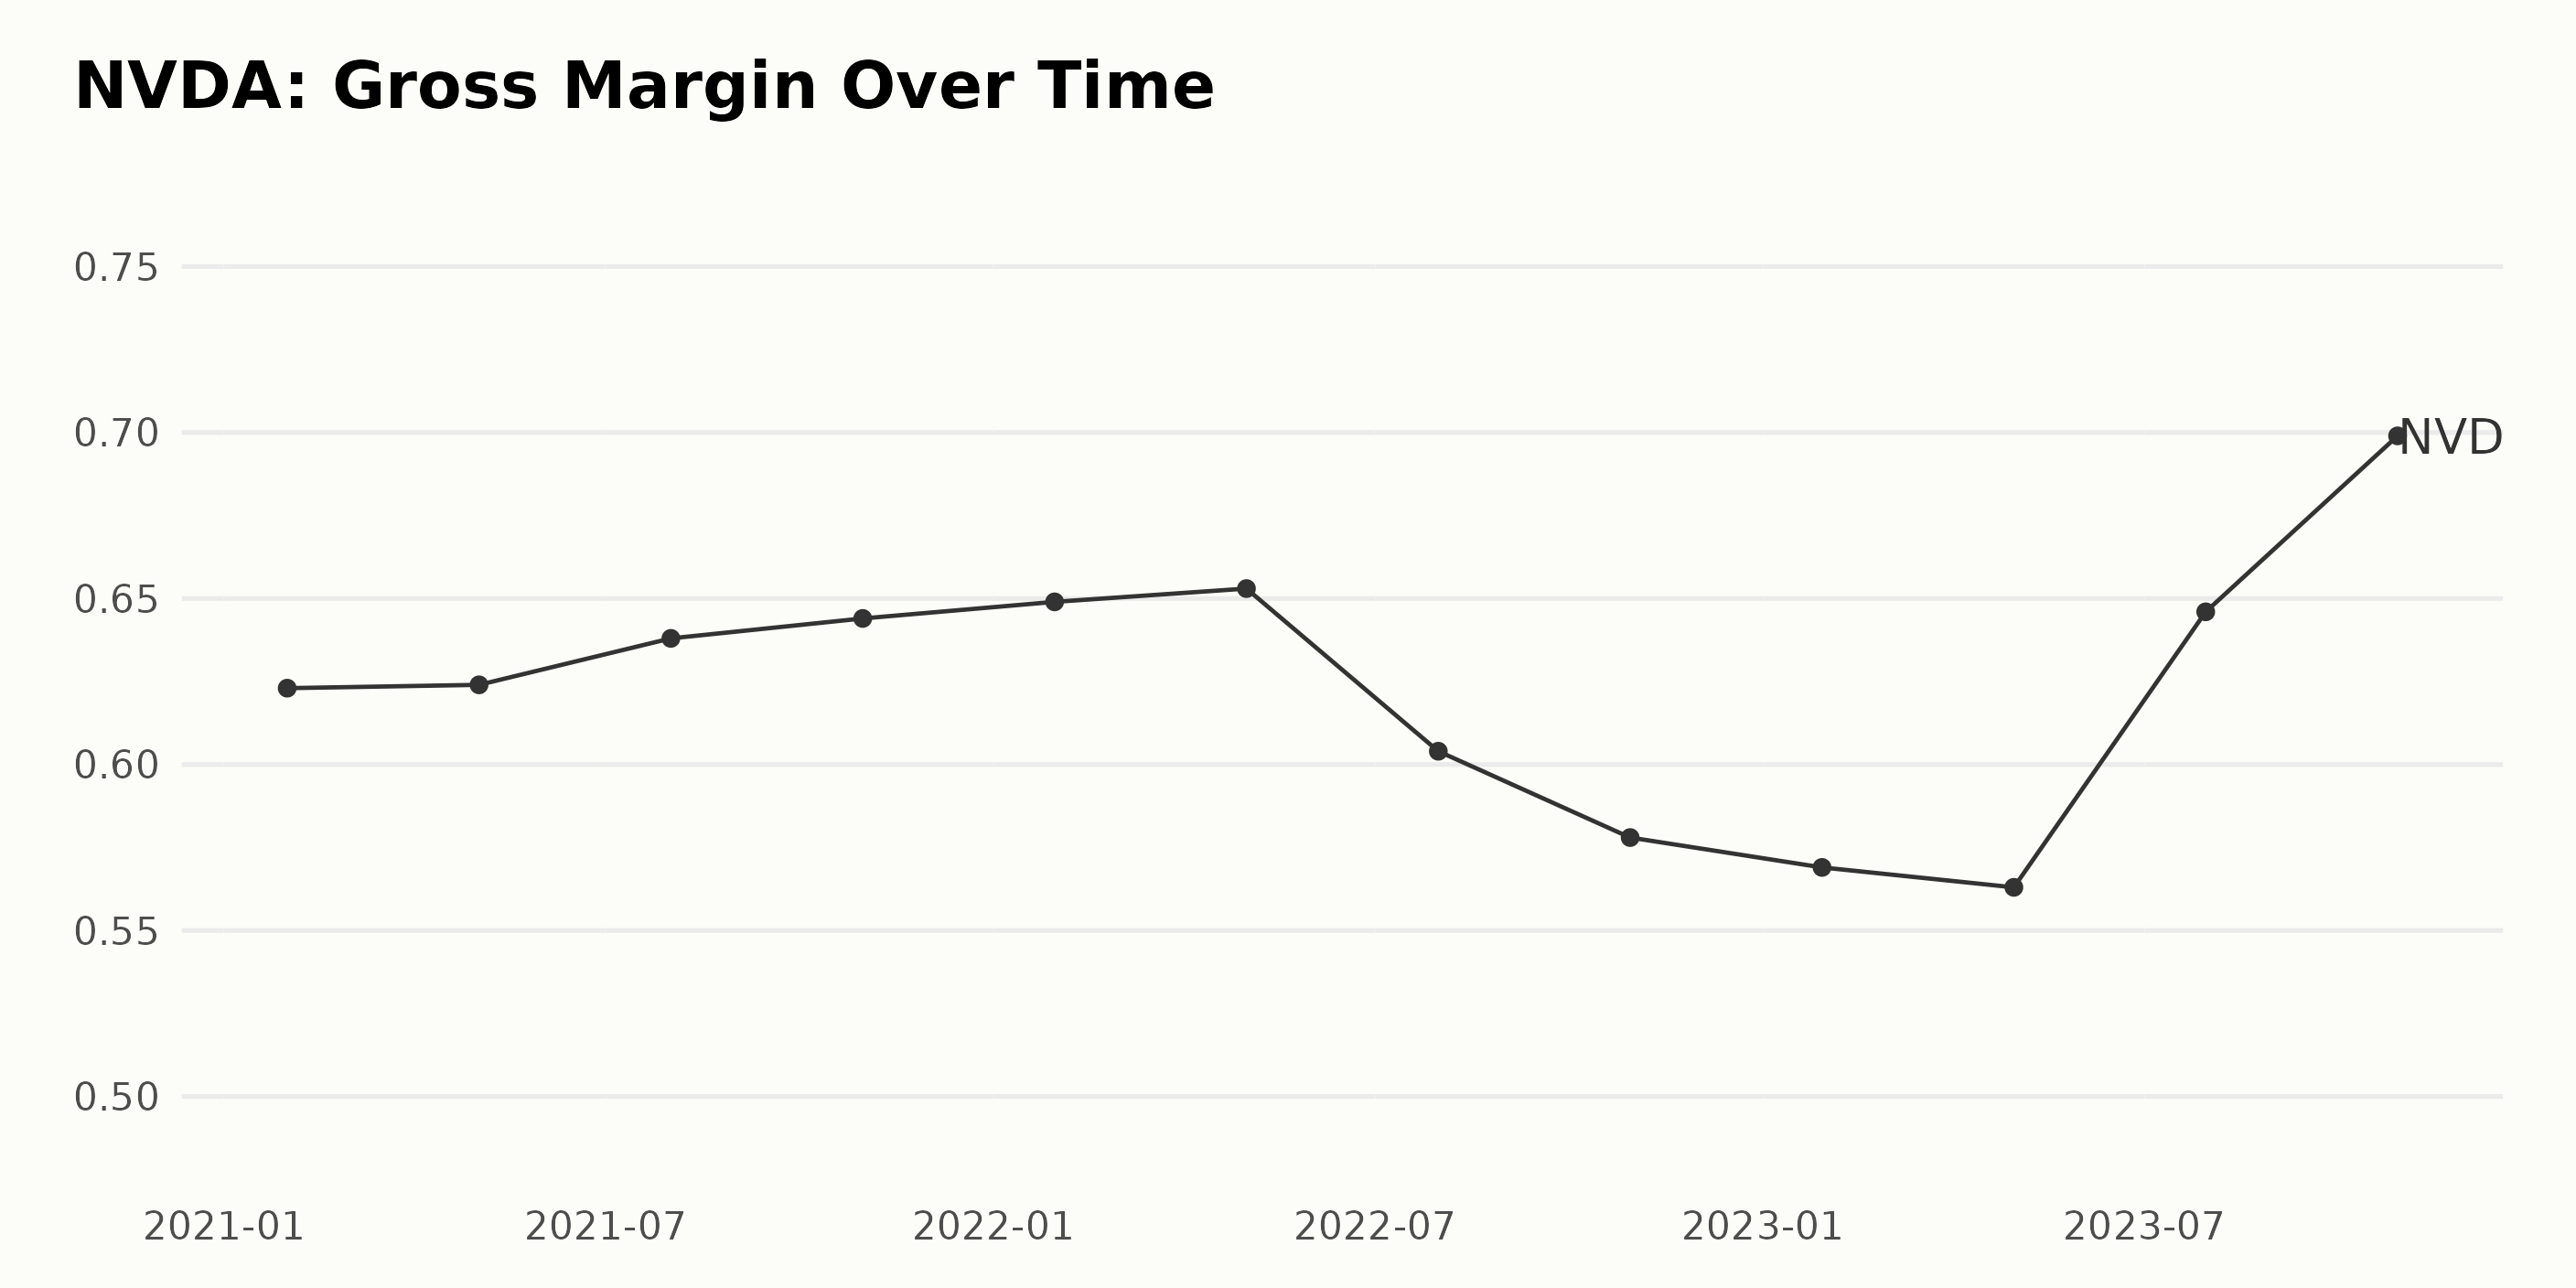
The NVDA's gross margin has shown a fluctuating trend over the years based on the provided data series. The data begins with a gross margin of 62.30% in January 2021 and ends with 69.90% in October 2023. Key observations:
- There was a slightly increasing trend from January 2021 (62.30%) to May 2022 (65.30%).
- An unusual drop was seen between May and October 2022, with the gross margin falling from 65.30% to 57.80%.
- The highest drop was recorded between July and October 2022, when the gross margin plummeted from 65.30% to 57.80%, a decrease of 7.5% points.
- From October 2022 onwards, NVDA experienced a steady increase in its gross margin, with it reaching 69.90% by October 2023.
When calculating the growth rate by measuring the last value from the first one, we observe that there was an overall positive growth in the gross margin during the reporting period. Specifically, the gross margin increased from 62.30% to 69.90% from January 2021 to October 2023, indicating sizable progress.
The greater emphasis lies on the recent figures that reveal gross margin sharply pumped up after the substantial fall in mid-2022. There was notable growth from April to October 2023, rising from 56.30% to 69.90%, showing a robust recovery and boding well for NVDA's financial position.
It is important to dig more into the reason behind such variations, especially the drop witnessed in 2022 and the significant rebound in 2023. Among possible reasons could be changes in the cost of sales, variations in product mix, strategic shifts, or unexpected market events.
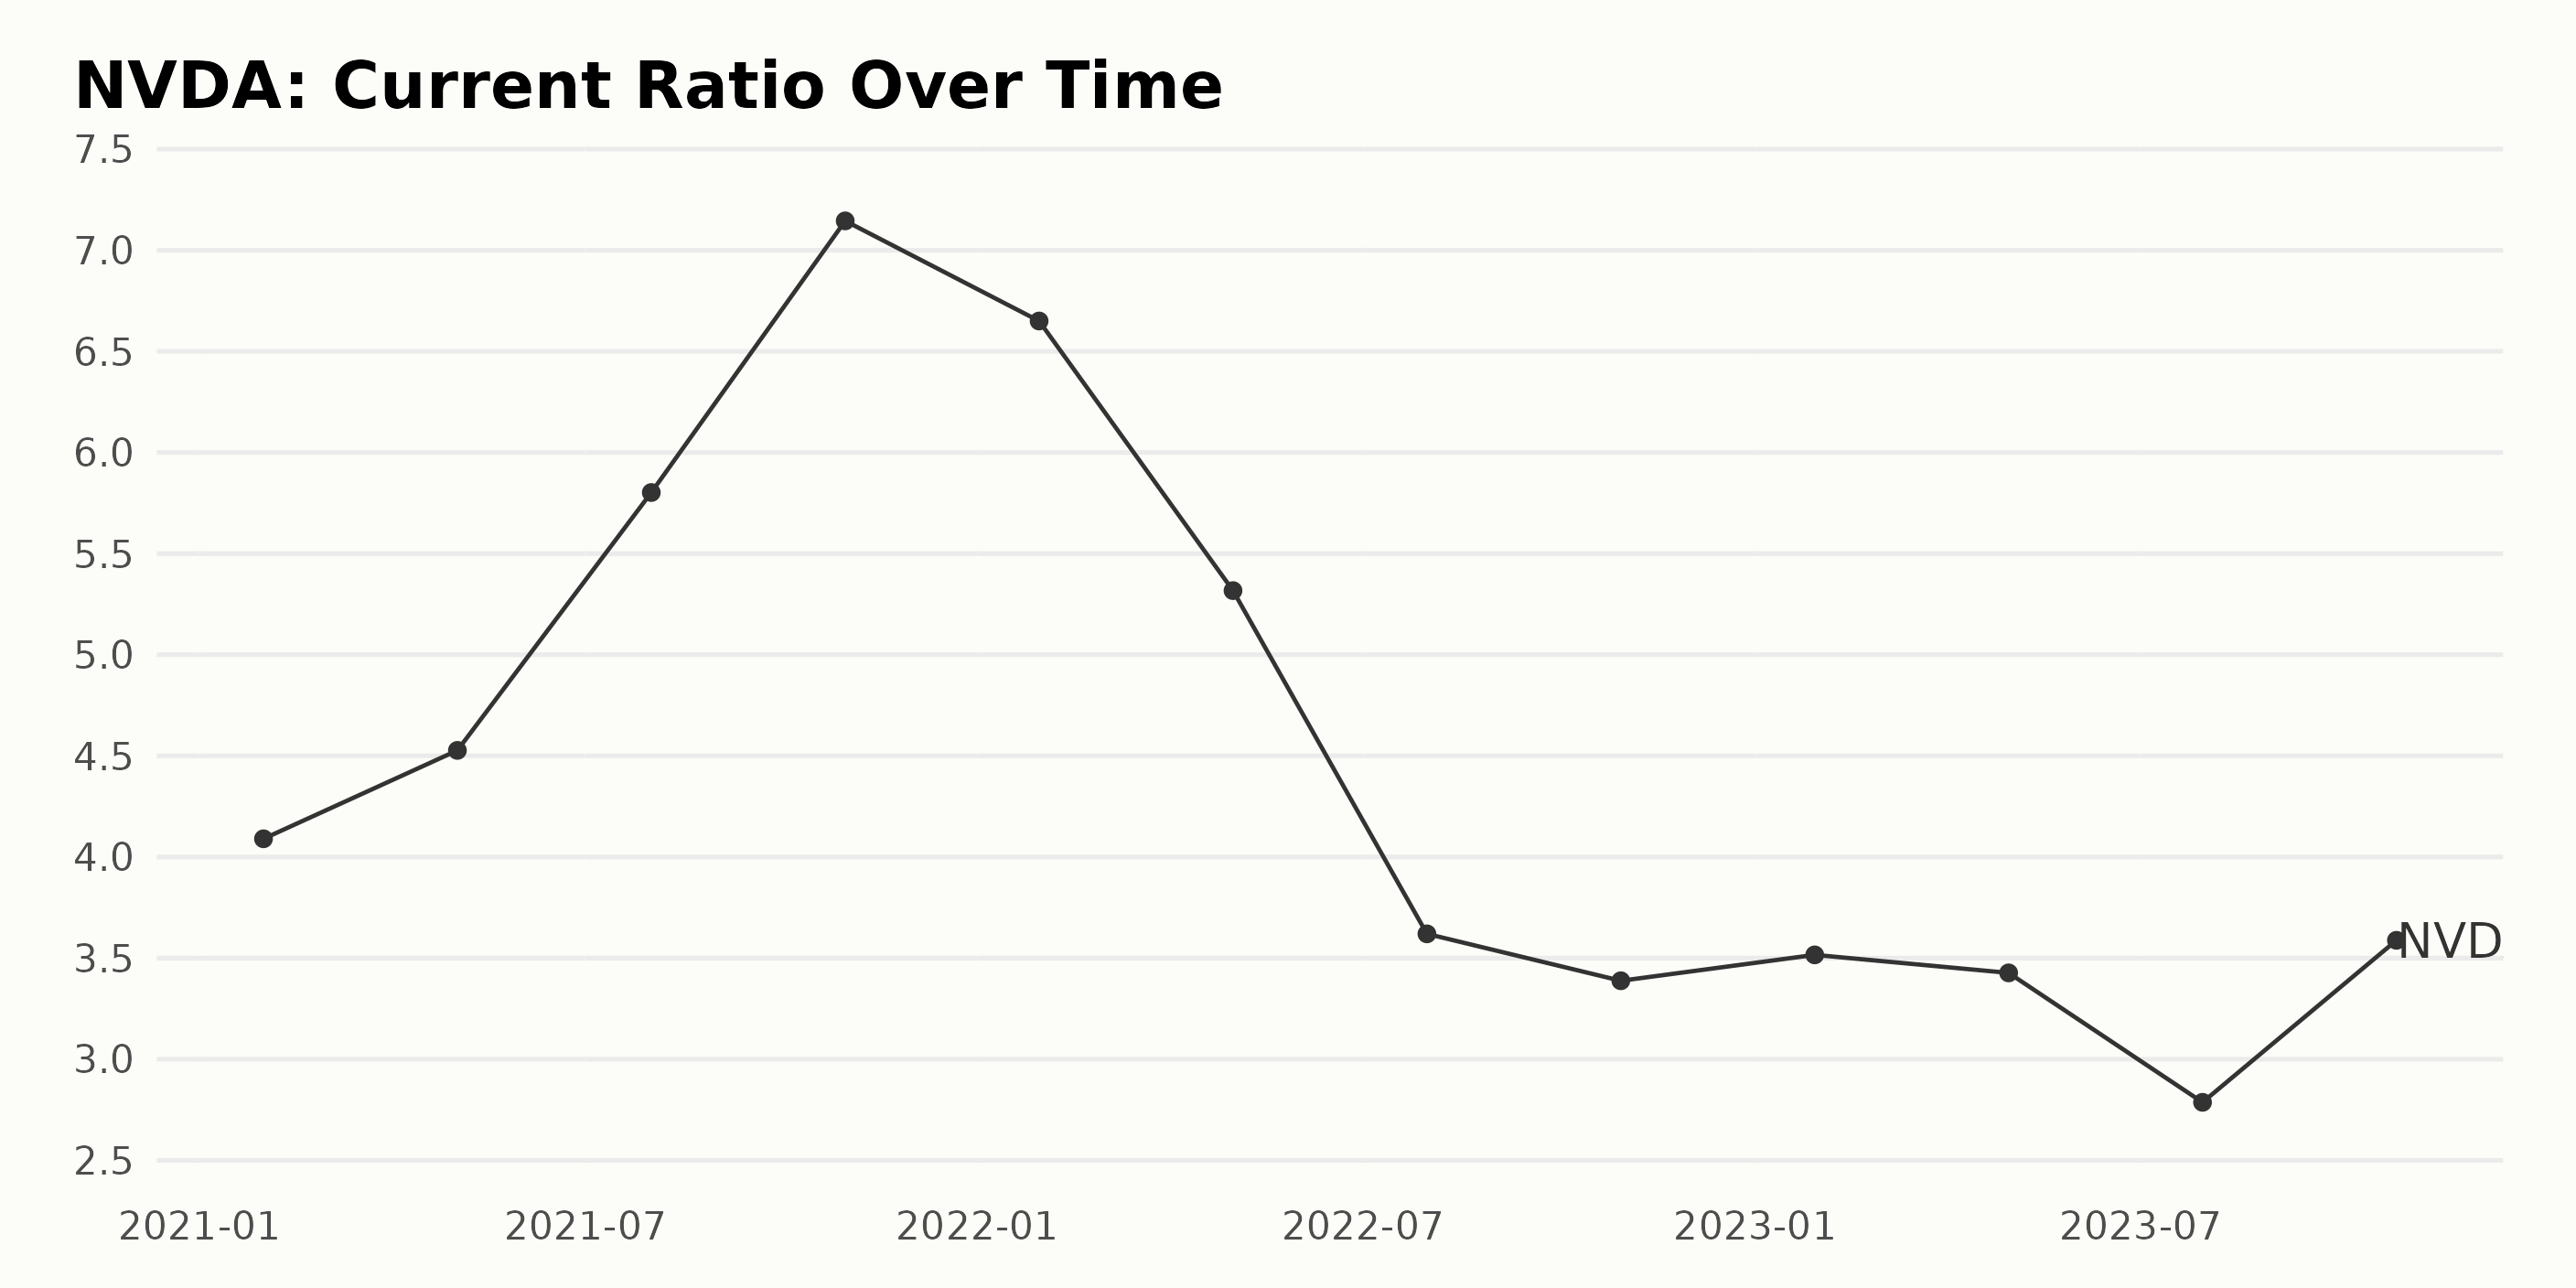
The current ratio of NVDA has exhibited both upward and downward trends as well as fluctuations throughout the reported period. Here's the summary:
- In January 2021, the current ratio was 4.09.
- There was a steady increase in the current ratio from January 2021 to October 2021, peaking at 7.145 in October 2021.
- Following the peak, there was a sharp decline in the current ratio, falling to 3.62 by July 2022.
- The current ratio showed slight fluctuations between July 2022 and April 2023, ranging between 3.388 and 3.516.
- By July 2023, the current ratio fell further down to 2.787.
- The data series ends with a rebound in October 2023, where the current ratio was recorded as 3.588.
From the first value in January 2021 (4.09) to the last value in October 2023 (3.588), there was a decrease of roughly 12.3%. Despite the mid-period peak, by the end of the series, the current ratio was lower than the starting point.
Please note: greater emphasis has been placed on more recent data in this analysis, according to the instructions. The general trend suggests some form of instability in NVDA's short-term liquidity over the course of the observed time frame.
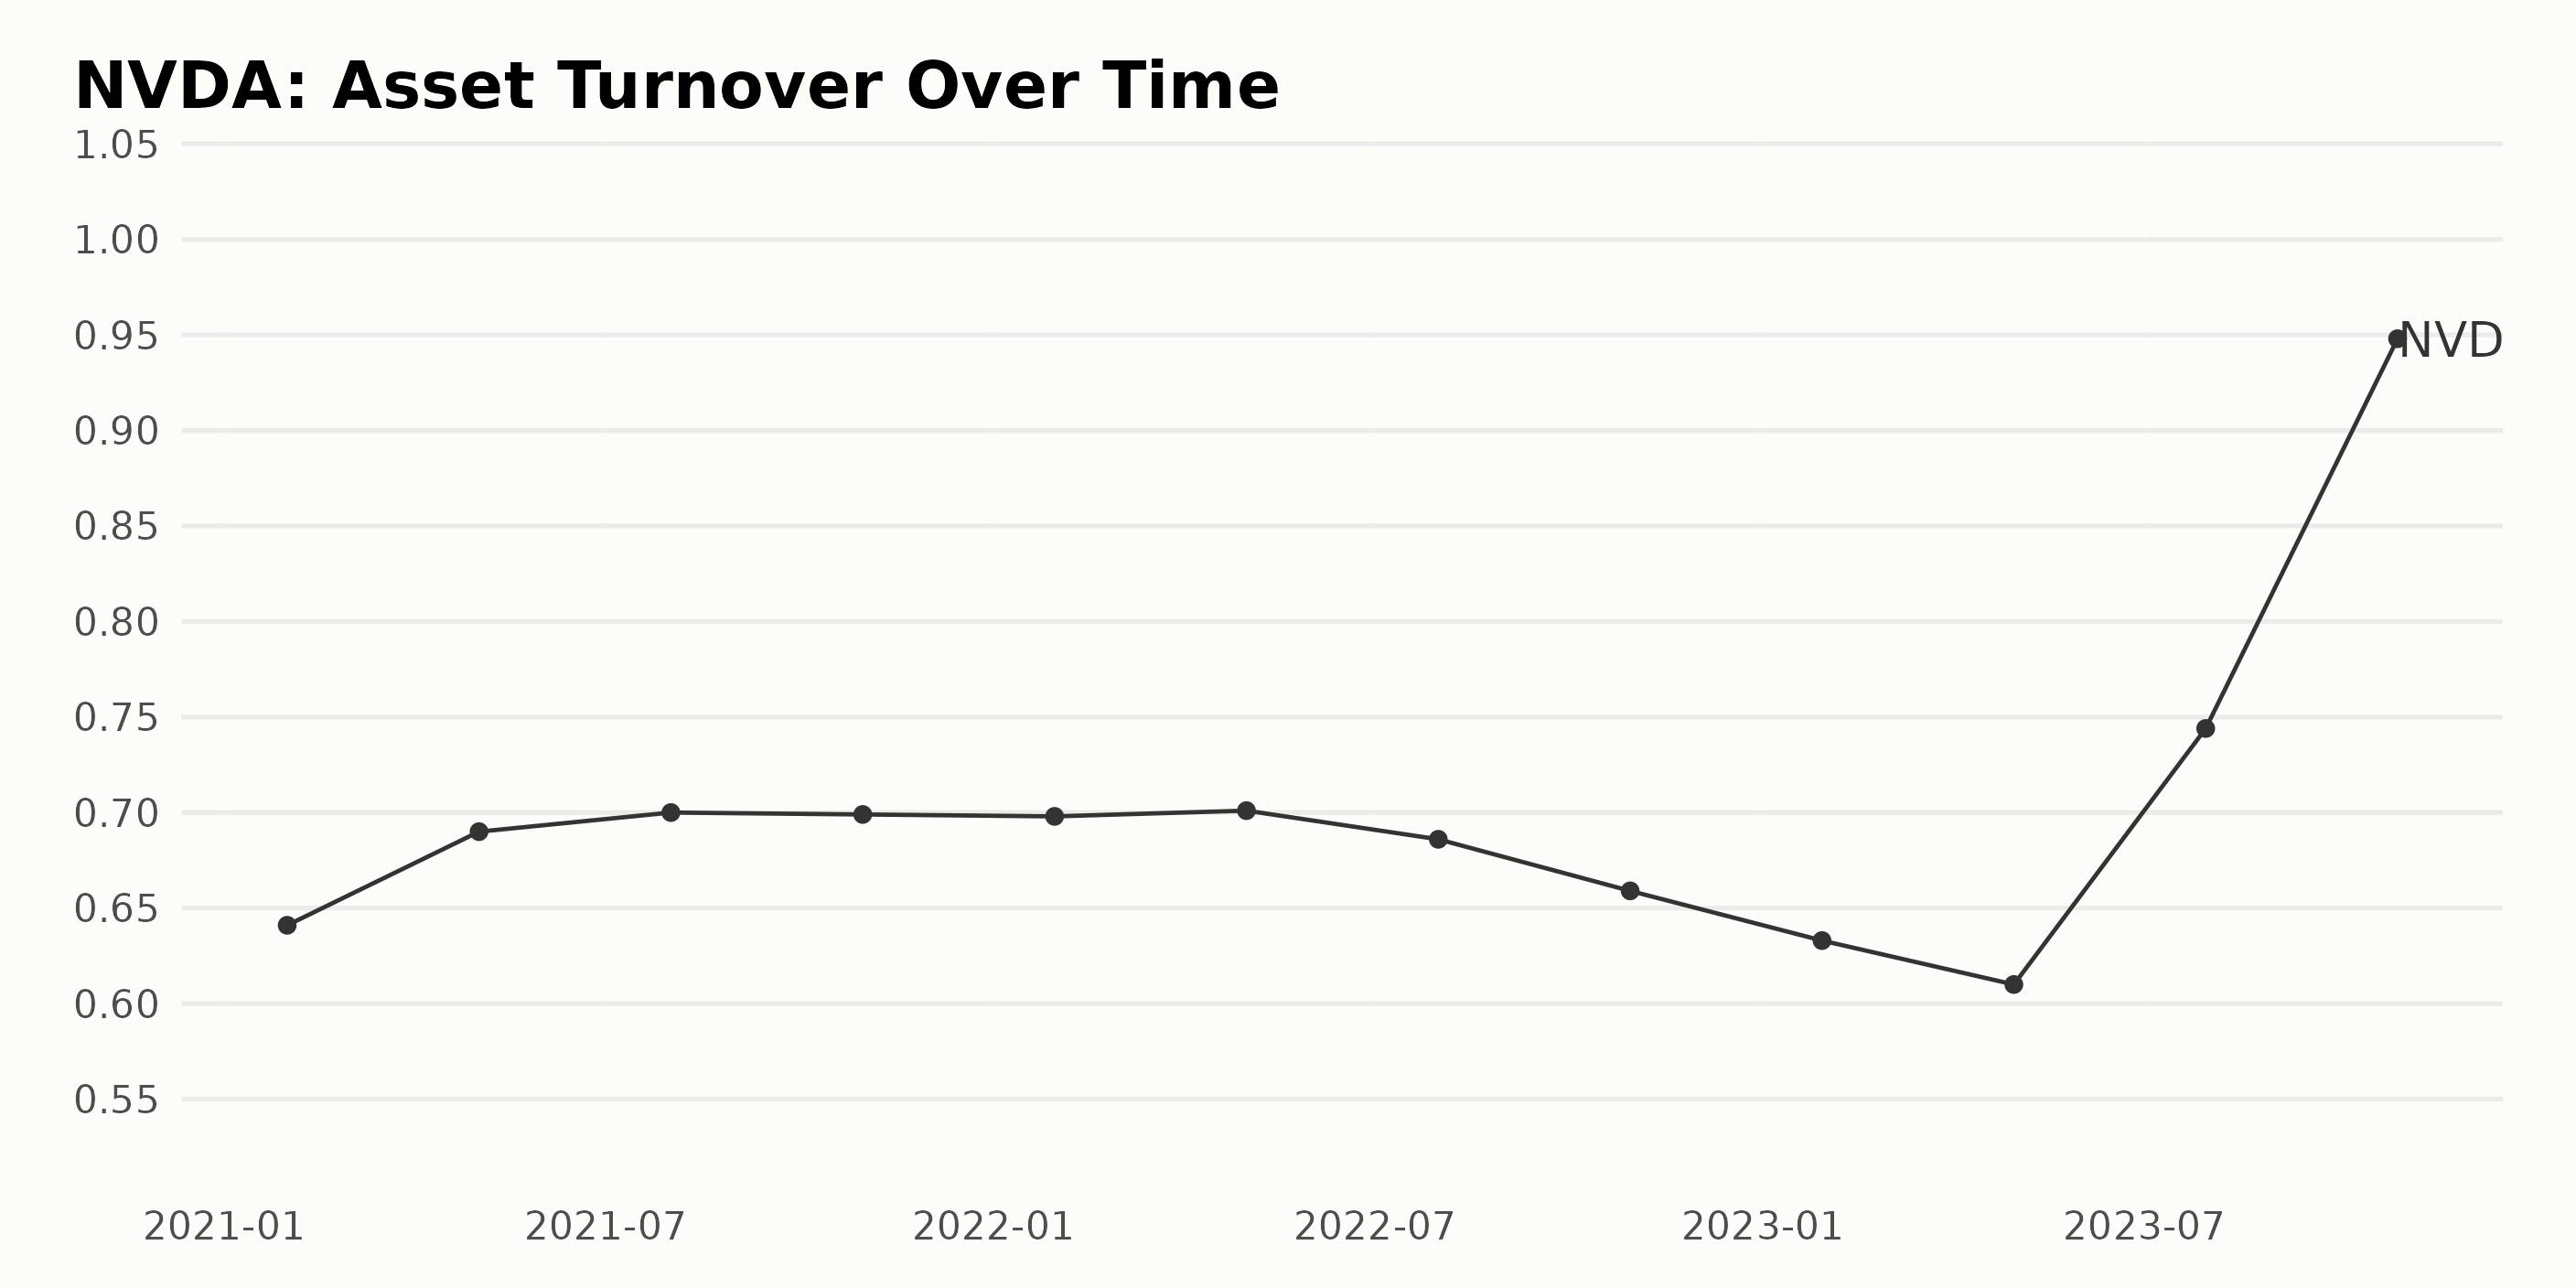
The available data on NVDA's asset turnover, spanning from January 2021 to October 2023, reveals a generally fluctuating pattern with a minor overall increment. Some of the key points include:
- Starting at 0.641 in January 2021, the asset turnover manifested small gains through August 2021, peaking at 0.7.
- This small upward trend plateaued through May 2022 as the value remained around 0.70.
- Notably, a brief downturn appeared between July and October 2022 when the figure slightly dropped to 0.659.
- The number further decreased to 0.61 by April 2023, marking its lowest point in this timeframe.
- However, from July to October 2023, there was a significant surge in asset turnover, reaching a series high of 0.948 by the end of the period.
In terms of growth rate, calculated from the difference between the final (October 2023: 0.948) and the initial value (January 2021: 0.641), there is a growth of approximately 48%. It means NVDA has been able to use its assets more effectively to generate income over this period despite some intermittent fluctuations.
This growth suggests financial improvements for NVDA. However, the inconsistent pattern within this timeframe also indicates potential instability or varying degrees of operational efficiency.
Analyzing NVIDIA's Stock Performance: A Comprehensive Review of June-December 2023
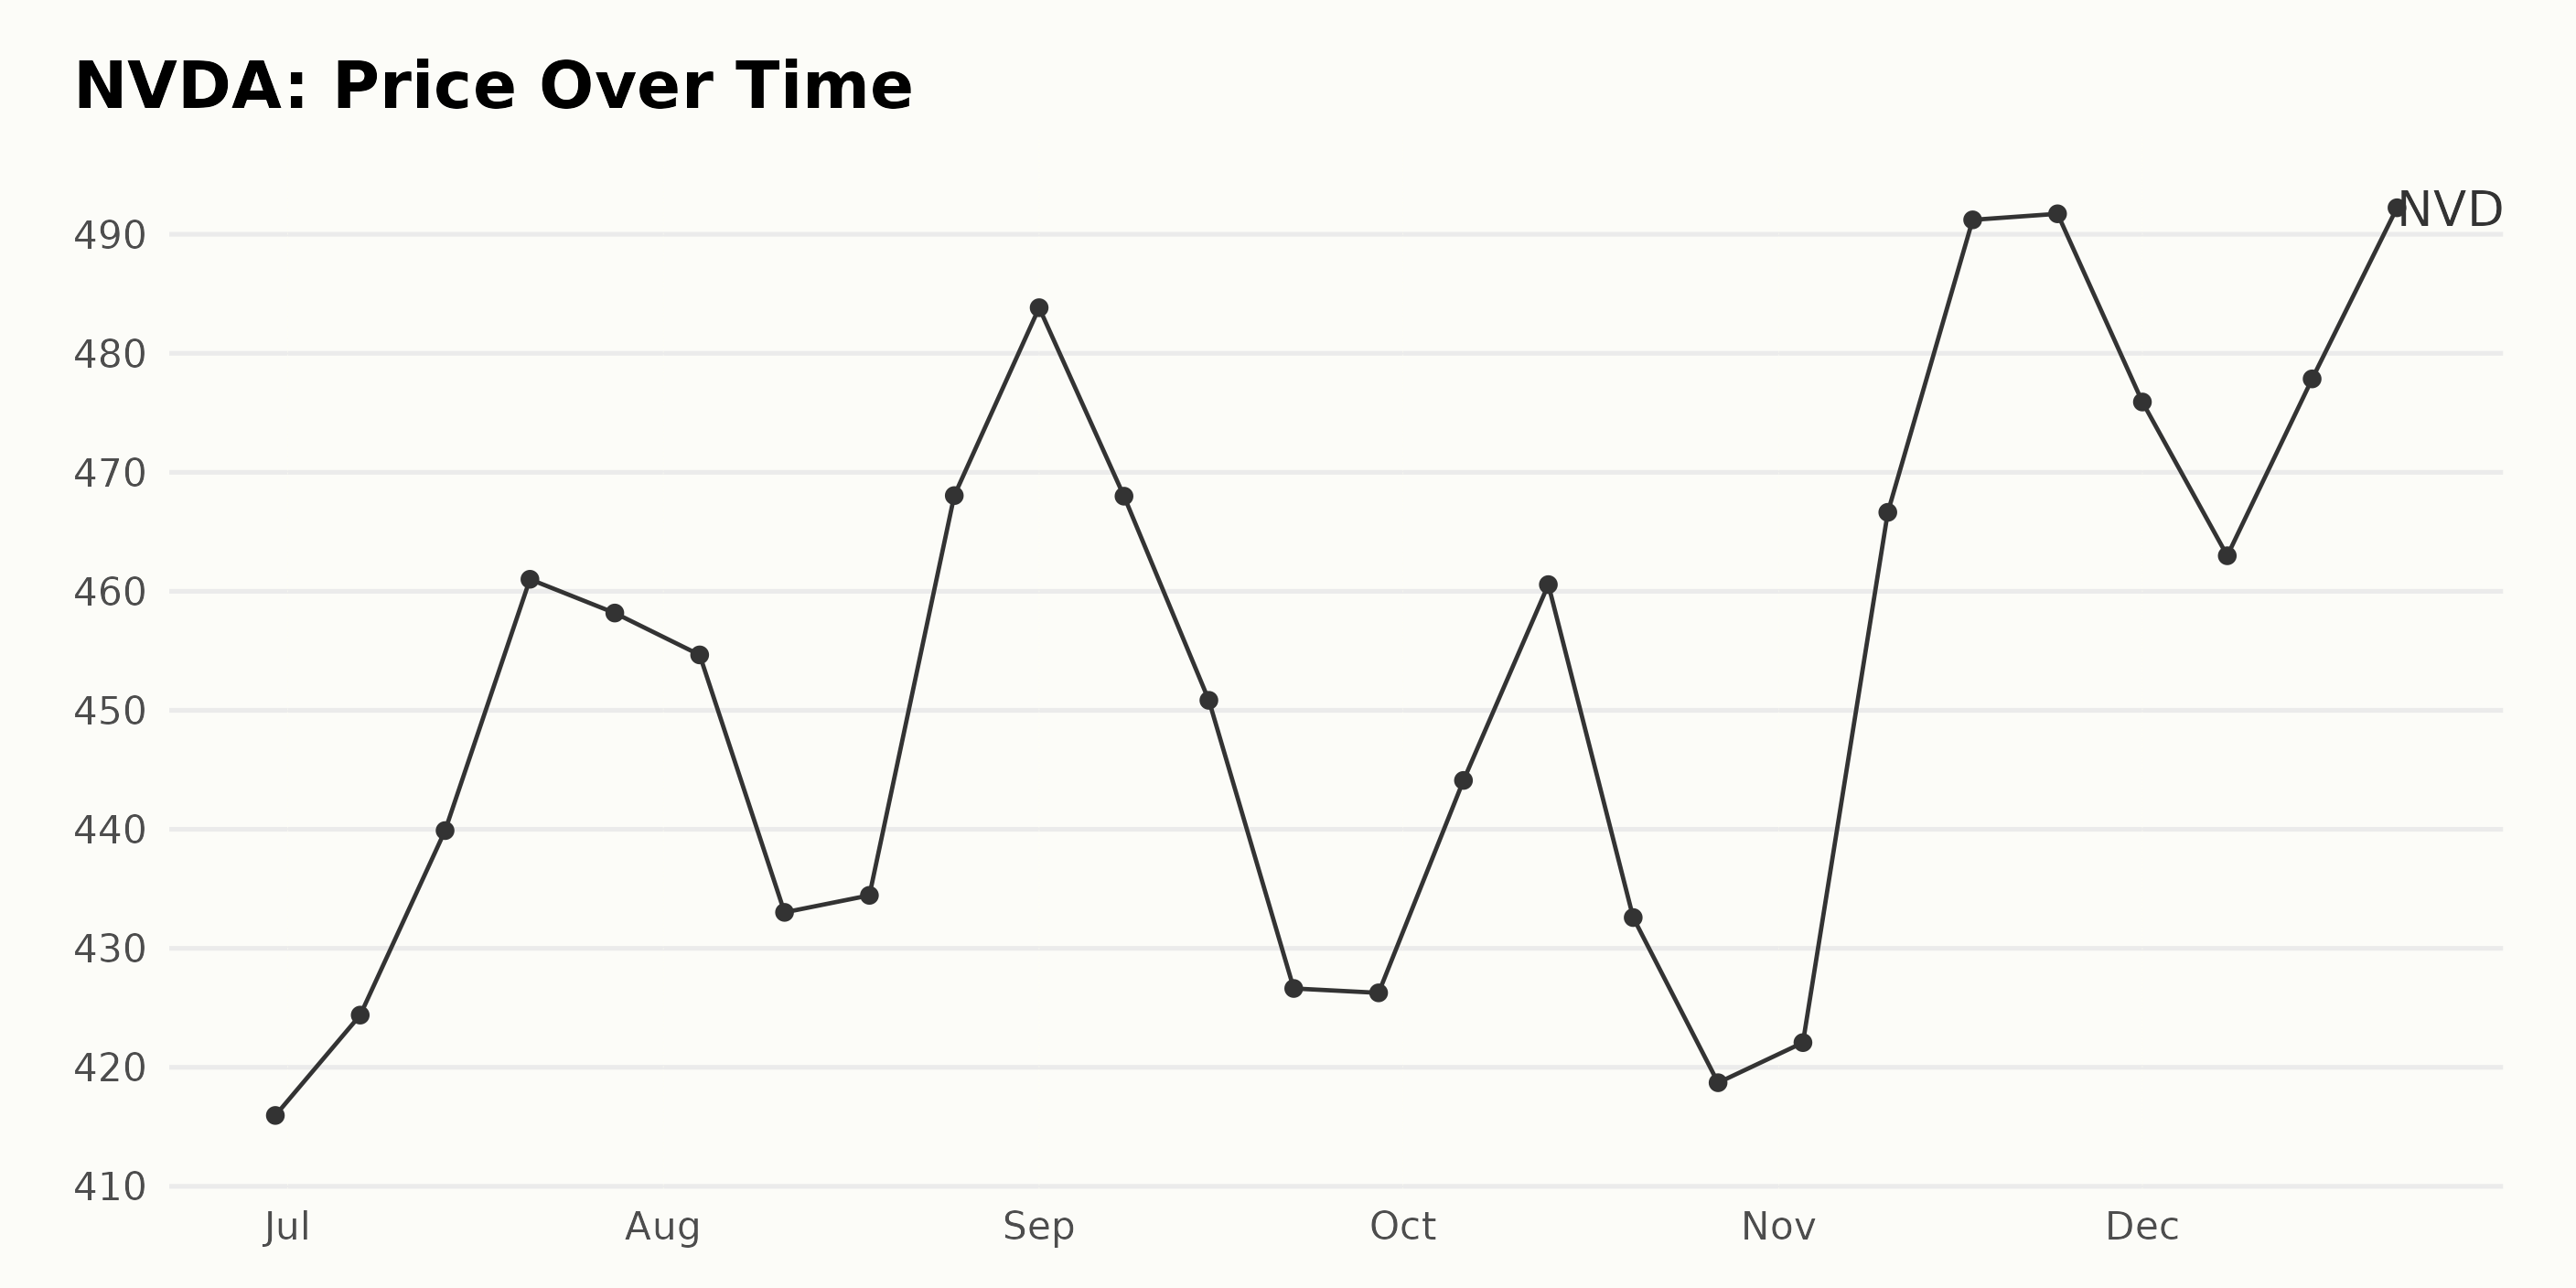
Based on the data provided, NVDA’s share price displays an overall rising trend from June to December 2023. Here is a more detailed breakdown:
- On June 30, 2023, NVDA’s share price was $415.96.
- Throughout July 2023, the share price saw a consistent increase, peaking at $461.01 on July 21 before slightly dipping to $454.66 by early August.
- In August, the share price fluctuated, starting at $454.66 and reaching a low of $433.02 on August 11. However, by the end of August, there was a notable surge to $468.04.
- September 2023 witnessed a gradual decline, with the share price getting down to $426.26 towards the end of the month.
- There was a short rebound in October, with the price rising from $426.26 to $460.56 by mid-October, but it dropped back down to $418.71 by the end of the month.
- In November, there was an impressive climb once again, culminating in a peak share price of $491.72 on November 24, 2023.
- The trend decelerated in December with slight fluctuations. The share price ended at $488.30 on December 22.
To summarize, the NVDA share price demonstrated an overall upward trajectory during this period despite some periods of volatility and deceleration. The share price escalated by approximately 18.34% from June to December 2023. Here is a chart of NVDA's price over the past 180 days.
Tracking NVIDIA's Exceptional Growth, Quality and Sentiment Ratings in 2023
The POWR Ratings grade for NVDA, a stock in the Semiconductor & Wireless Chip category, has held a steady C (Neutral) grade from July 2023 to December 2023. This category has a total of 91 stocks.
A noteworthy observation is NVDA's rank within its category during this period. Beginning at a rank of #44 out of 91 in early July 2023, the stock has seen slight fluctuations in its position, with the rank improving to #25 by November 10, 2023, and then standing at #29 on December 26, 2023. Here's a list of some key moments:
- July 1, 2023: Rank 44
- August 5, 2023: Rank 45
- August 26, 2023: Rank 39
- September 2, 2023: Rank 27
- October 14, 2023: Rank 26
- November 10, 2023: Rank 25
- December 16, 2023: Rank 30
- December 26, 2023: Rank 29
It’s important to note that NVDA managed to improve its standing significantly during this period. However, toward the end of the year, its rank dropped slightly to #30 before settling back to #29 in the final week of December 2023.
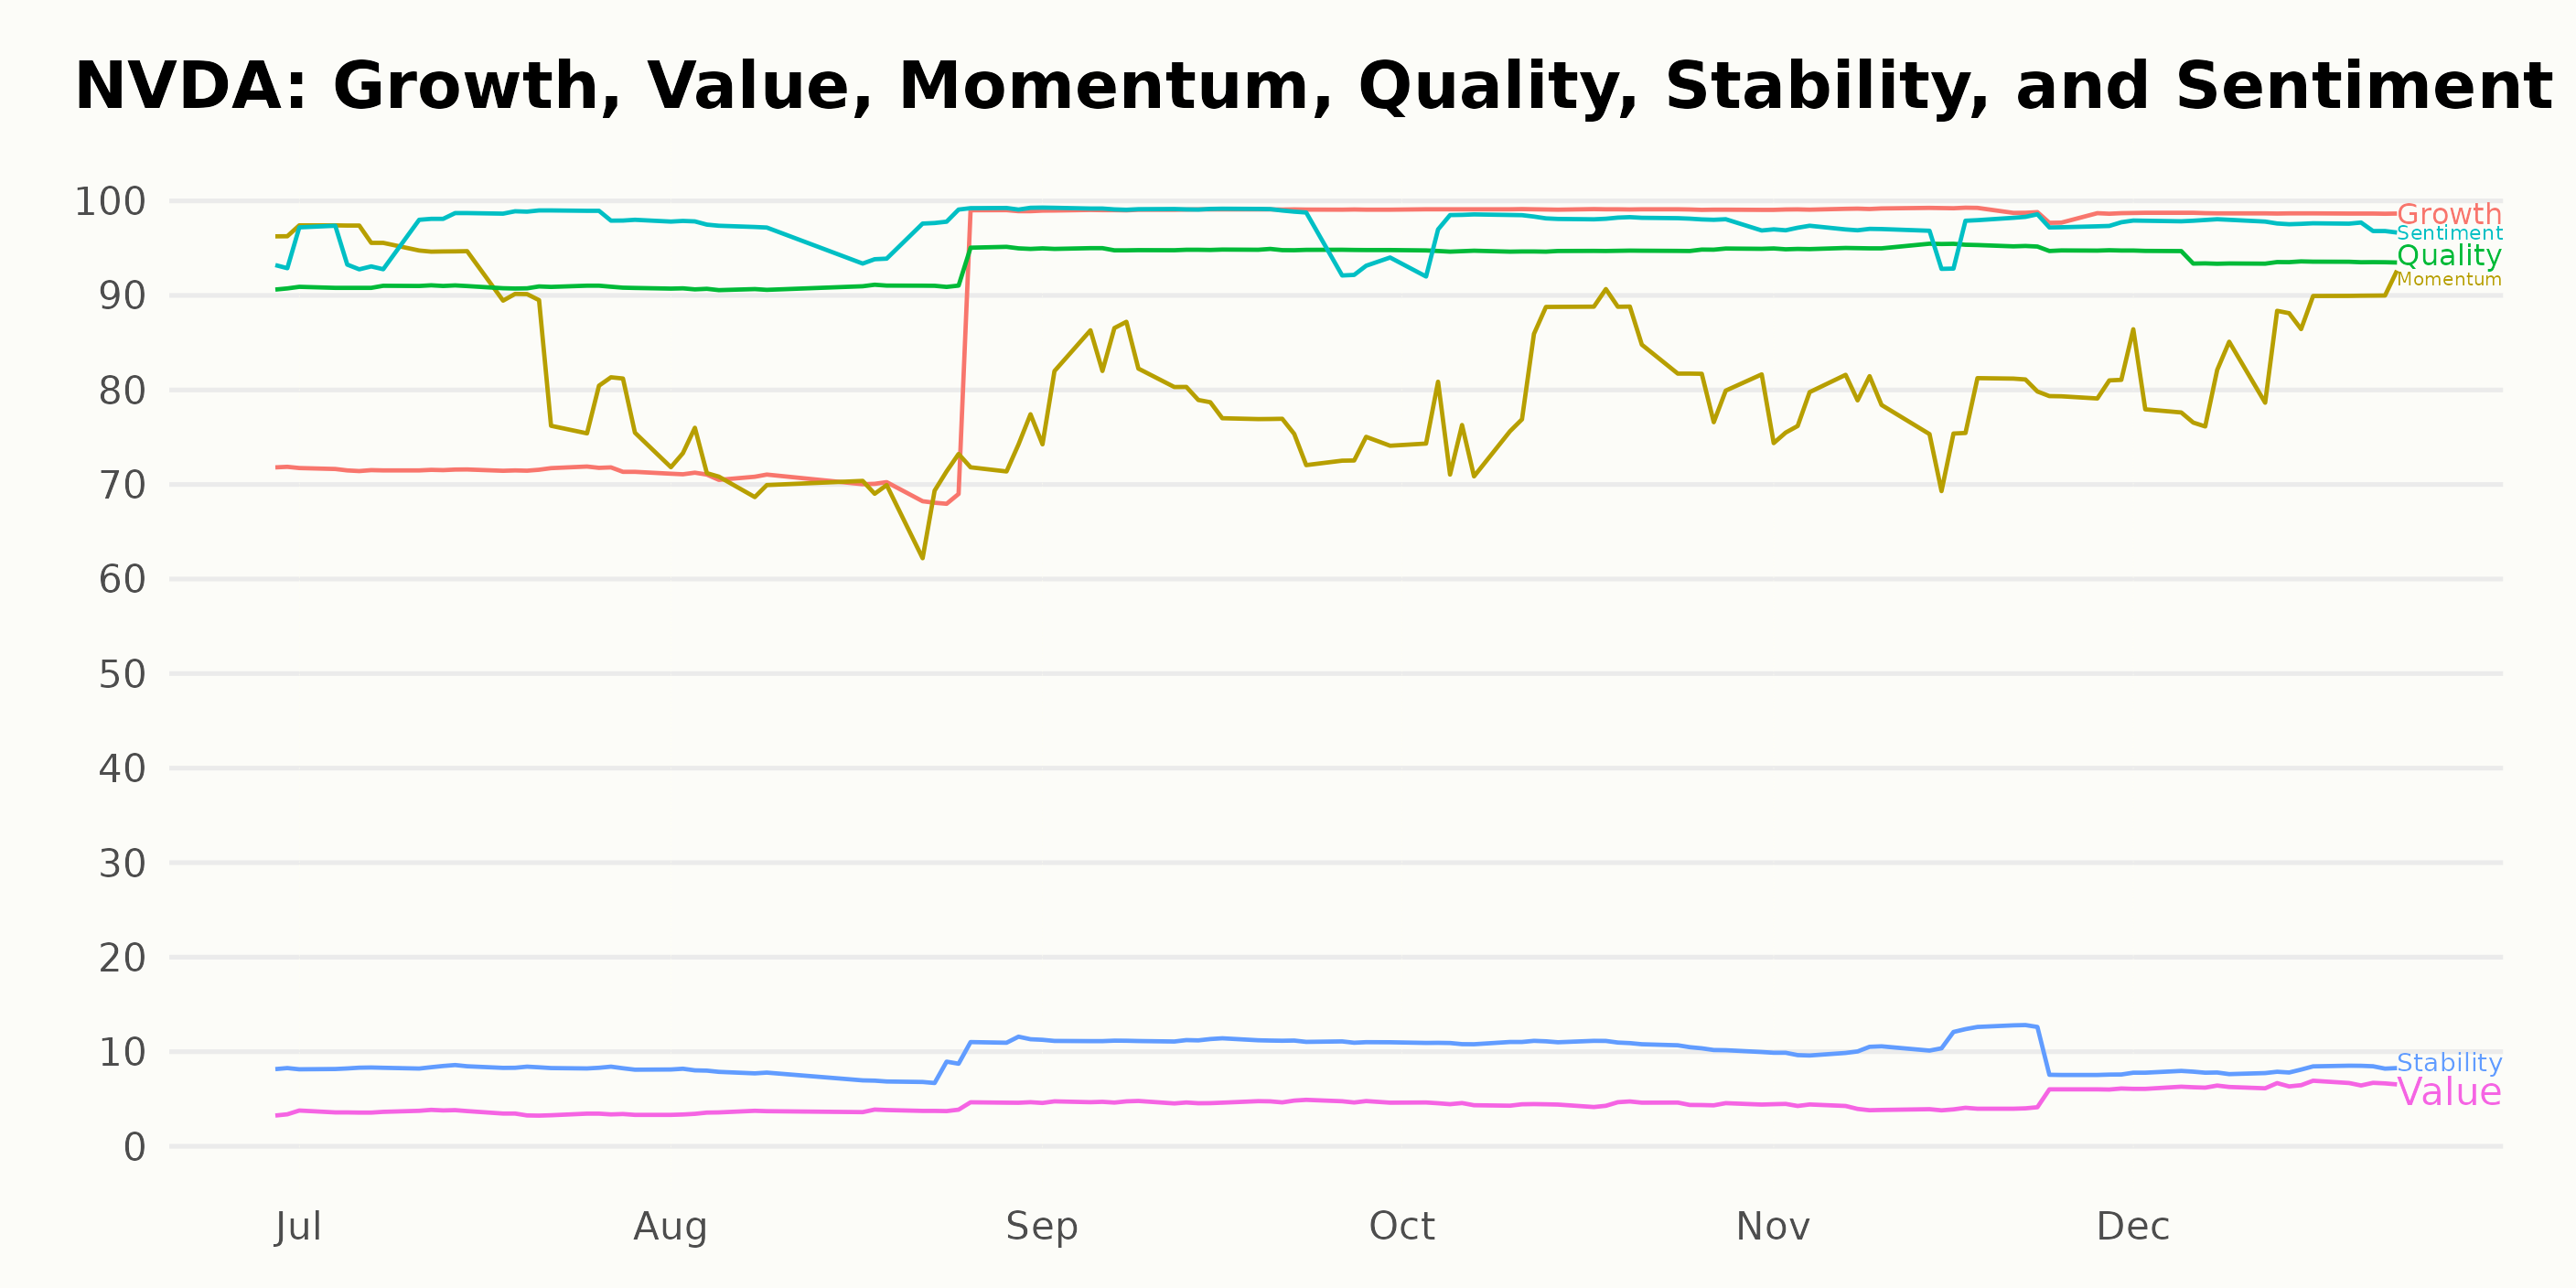
The POWR Ratings for NVDA, noteworthy along three dimensions: Growth, Quality, and Sentiment, have shown some interesting trends over time.
For the dimension of Growth:
- In June 2023, the Growth was rated at 72.
- It remained constant till July 2023, then increased to 76 in August.
- The growth rate had a significant leap to 99 in September, and it sustained this high value until the end of the year.
The Quality:
- Quality started at a high of 91 in June 2023.
- It then climbed slowly and continually, peaking at 95 in September, and maintained this rate through November. However, there was a slight drop to 94 by December.
Regarding Sentiment:
- The Sentiment rating began at 93 in June 2023.
- There was a consistent positive trend, reaching its highest mark at 98 in September and staying consistent until December, albeit with a slight dip to 97 in November.
These trends highlight a strong performance by NVDA throughout the latter part of 2023, particularly in terms of Growth in the later months. Also, in general, the company maintained high Quality and Sentiment ratings.
How does NVIDIA Corporation (NVDA) Stack Up Against its Peers?
Other stocks in the Semiconductor & Wireless Chip sector that may be worth considering are ChipMOS TECHNOLOGIES INC. (IMOS), Everspin Technologies, Inc. (MRAM), and Photronics, Inc. (PLAB) - they have better POWR Ratings. Click here to explore more Semiconductor & Wireless Chip stocks.
What To Do Next?
Discover 10 widely held stocks that our proprietary model shows have tremendous downside potential. Please make sure none of these “death trap” stocks are lurking in your portfolio:
NVDA shares were trading at $494.64 per share on Tuesday morning, up $6.34 (+1.30%). Year-to-date, NVDA has gained 238.62%, versus a 26.13% rise in the benchmark S&P 500 index during the same period.
About the Author: Anushka Dutta

Anushka is an analyst whose interest in understanding the impact of broader economic changes on financial markets motivated her to pursue a career in investment research.
The post NVIDIA (NVDA) Year-End Game: Buy or Sell Signals? appeared first on StockNews.com