HIGHLIGHTS OF THE PRESS RELEASE:
- Globally significant Mineral Resource with extensive mine life and first quartile cash costs driving significant Free Cash Flow (“FCF”) generation:
- Average annual copper equivalent (“CuEq”) production of over 300,000 tonnes in the first five years and over 240,000 tonnes during the first 15 years
- First quartile All-In Sustaining Cost (“AISC”) of US$0.85/lb of payable Cu for the first five years and US$1.07/lb of payable Cu during the first 15 years
- Post-tax net present value (“NPV”) (8%) of US$4,617M (pre-tax NPV8% of US$7,492M) and a post-tax internal rate of return (“IRR”) of 26% (pre-tax IRR of 34%)
- Average annual Earnings Before Interest, Taxes, Depreciation, and Amortization (“EBITDA”) of US$1.9bn for the first five years and US$1.4bn during the first 15 years
- Average annual post-tax Free Cash Flow (“FCF”) of US$1.3bn for the first five years and US$1.0bn over the first 15 years
- Initial capital costs (pre-production) of US$3.7bn (including 15.7% overall contingency)
- Attractive capital intensity of ~US$15,440/avg tpa-CuEq over the first 15 years
- 2.6 year post-tax payback period (1.9 year pre-tax payback)
- Maiden Mineral Reserve estimate of 1.3 billion tonnes (Proven and Probable) at 0.41% CuEq (0.31% Cu, 0.02% Mo, 0.04 g/t Au and 1.30 g/t Ag), providing a mine life of 22 years
- 2025 Mineral Resource Estimate (“MRE”) incorporates a 312% increase in Measured plus Indicated Mineral Resources, at a cut-off grade of 0.1% Cu and a net smelter return (“NSR”) cut-off value of US$6.30/t, compared with the published 2024 MRE
- Possibility of extending the mine life by a timeframe in the order of 25 to 30 years beyond the Mineral Reserves
- LOM average strip ratio of 0.53 to 1 (waste to ore) positions Warintza as one of the lowest strip ratio copper mines globally, underpinning a very favourable strip-adjusted grade
- Operational simplicity driven by conventional open pit mining methods operating at low elevation and using standard processing equipment
- Excellent access to infrastructure (water, power, roads, ports, etc.)
- Production of both a high-quality copper concentrate and a clean molybdenum concentrate, both products have non-material levels of deleterious elements
- Pre-Feasibility Study prepared in conjunction with highly experienced consultants Ausenco, Knight Piésold, and AMC
QUITO, Ecuador, Nov. 06, 2025 (GLOBE NEWSWIRE) -- Solaris Resources Inc. (“Solaris” or the “Company”) (TSX: SLS; NYSE: SLSR) is pleased to announce the results of a Pre-Feasibility Study (the “PFS”) with an updated Mineral Resource Estimate (“2025 MRE”) and maiden Mineral Reserves for its Warintza Project (“Warintza”, the “Project” or the “Warintza Project”), located in southeastern Ecuador.
The Company will host an investor presentation, covering the announcement, via the Investor Meet Company (“IMC”) platform today, November 6, 2025. Further details can be found below.
Matthew Rowlinson, CEO and President of Solaris Resources Inc. said: “Warintza checks every box: global scale, size, and longevity, technical simplicity in a supportive mining jurisdiction, exceptional economics driven by a world-class strip adjusted grade, and above all, optimal timing to production in a tightening copper market.
With over 3.7 billion tonnes of Measured and Indicated Resources, 2.1 billion tonnes of Inferred Resources, 1.3 billion tonnes of Mineral Reserves, a low strip ratio, and early access to high-grade material, Warintza stands as one of the most compelling copper development assets anywhere in the world. We are fully funded for a construction decision through a US$200 million non-dilutive financing from Royal Gold earlier this year, while importantly retaining 100% ownership and full strategic control.
In a copper market characterized by declining grades, few new discoveries, and increasingly complex permitting environments, Warintza is uniquely positioned to come online at the right moment, helping meet a critical global supply gap, while delivering strong returns to stakeholders.
This is a rare window of opportunity: a generational discovery in a mining-friendly jurisdiction, with deep community support and a proven management team driving it forward. The future is bright, and we look forward to unlocking Warintza's real value.”
A summary of key operating and financial metrics from the PFS is presented below.
| Metric | Units | First 5 years of Production Avg. | First 15 years of Production Avg. | LOM | ||
| Mining Summary | ||||||
| Strip ratio | t:t | 0.371 | 0.381 | 0.532 | ||
| Production Summary | ||||||
| Average Annual Throughput | Mt | 60.2 | ||||
| CuEq3 head grade | % | 0.58 | 0.47 | 0.41 | ||
| Cu head grade | % | 0.44 | 0.36 | 0.31 | ||
| Cu recovery | % | 89 | 86 | 84 | ||
| Average Annual CuEq3 Production | kt | 304 | 242 | 205 | ||
| Total CuEq3 Production | kt | 4,501 | ||||
| Average Annual Cu Production | kt | 230 | 183 | 156 | ||
| Total Cu Production | kt | 3,436 | ||||
| Average Annual Mo Production | kt | 10.8 | 8.6 | 7.0 | ||
| Total Mo Production | kt | 154 | ||||
| Average Annual Au Production | koz | 71 | 57 | 49 | ||
| Total Au Production | koz | 1,079 | ||||
| Average Annual Ag Production | Moz | 1.8 | 1.3 | 1.2 | ||
| Total Ag Production | Moz | 26.6 | ||||
| Operating Costs | ||||||
| Mine Operating Costs | US$/t-moved | 1.25 | 1.37 | 1.38 | ||
| Mine Operating Costs | US$/t-milled | 3.38 | 2.80 | 2.40 | ||
| Processing | US$/t-milled | 5.58 | 5.58 | 5.58 | ||
| G&A | US$/t-milled | 0.79 | 0.78 | 0.78 | ||
| Total Operating Costs | US$/t-milled | 9.74 | 9.16 | 8.75 | ||
| C1 Cash Costs4 | US$/lb-Cu payable | 0.59 | 0.83 | 1.01 | ||
| AISC5 | US$/lb-Cu payable | 0.85 | 1.07 | 1.25 | ||
| Capital Expenditure | ||||||
| Initial capital costs | US$M | 3,729 | ||||
| Capital Intensity6 | US$/Avg tpa-CuEq | 12,260 | 15,440 | 18,230 | ||
| Sustaining capital costs | US$M | 1,713 | ||||
| Closure cost | US$M | 200 | ||||
| Financial Metrics7 | ||||||
| Long term Copper Price | US$/lb | 4.50 | ||||
| Average Annual EBITDA | US$M | 1,912 | 1,427 | 1,156 | ||
| Total EBITDA | US$M | 25,433 | ||||
| Average Annual Free Cash Flow (Pre-tax)8 | US$M | 1,829 | 1,348 | 1,088 | ||
| Free Cash Flow (Pre-tax)8 | US$M | 23,936 | ||||
| Average Annual Free Cash Flow (Post-tax)8 | US$M | 1,341 | 985 | 792 | ||
| Free Cash Flow (Post-tax)8 | US$M | 17,431 | ||||
| Total Free Cash Flow (Pre-tax)9 | US$M | 20,007 | ||||
| Total Free Cash Flow (Post-tax)9 | US$M | 13,502 | ||||
| NPV8% (Pre-tax) | US$M | 7,492 | ||||
| IRR (Pre-tax) | % | 34% | ||||
| Payback10 (Pre-tax) | Years | 1.9 | ||||
| NPV8% (Post-tax) | US$M | 4,617 | ||||
| IRR (Post-tax) | % | 26% | ||||
| Payback10 (Post-tax) | Years | 2.6 | ||||
Notes:
1: Strip ratio calculated by dividing the tonnage of waste mined by the tonnage of mineralized material mined above the cut-off grade.
2: Strip ratio calculated by dividing the tonnage of waste mined plus mineralized material above the cut-off grade unreclaimed from stockpiles by the tonnage of ore processed.
3: CuEq grade calculation assumes metal prices of copper US$4.00/lb, molybdenum US$20.00/lb, gold US$1,850/troy oz, and silver US$20.00/troy oz. Sulphide material accounts for more than 99.9% of the Mineral Reserves. The CuEq formula for sulphide material is:
- Sulphide CuEq (%) = Cu (%) + 3.94 × Mo (%) + 0.52 × Au (g/t) + 0.01 x Ag (g/t).
4: C1 Cash Costs include mining, processing, general and administrative (“G&A”) costs; treatment and refining charges (“TCRCs”) for Cu & Mo concentrate; royalties; streaming; and allowance for byproduct credits.
5: AISC includes C1 cash costs and sustaining capital costs.
6: Capital intensity is calculated as initial capital costs divided by the average annual copper equivalent production.
7: Economic analysis assumes metal prices of copper US$4.50/lb, molybdenum US$20.00/lb, gold US$2,800/troy oz for the first three years and US$2,500/oz for the remainder of the life, and silver US$28.00/troy oz.
8: Free Cash Flow during production periods only.
9: Total life of mine Free Cash Flow, including initial capital costs and closure.
10: Payback period is calculated from the beginning of commercial production, after construction is completed.
Warintza exhibits significant potential to be a tier 1 asset, including:
1: Size, Scale & Longevity
The 1.3 billion tonnes of Mineral Reserves, 3.7 billion tonnes of Measured and Indicated Resources, and 2.1 billion tonnes of Inferred Resources offer potential to increase longevity and optionality. The Mineral Resources are inclusive of the Mineral Reserves. The current mine plan supports average annual copper equivalent production of over 240,000 tonnes over the first 15 years, and over 300,000 tonnes in the first five years (average annual copper production of 230,000 tonnes in the first five years, and over 180,000 tonnes during the first 15 years), placing Warintza firmly in the top tier of future global copper producers and amongst the largest copper development opportunities globally that remains independent of any cornerstone equity attachment from a major mining company.
The Mineral Reserves currently support a mine life of over 20 years, limited by the design storage of the Tailings Management Facility (“TMF”) of 1.3 billion tonnes. This engineering limitation, consistent with the Estudio de Impacto Ambiental - Environmental Impact Assessment (“EIA”) application, defines the maximum processing capacity and, therefore, the Mineral Reserves mine life, rather than a more complete realization of the potentially available Mineral Resources. The over 20 years of mine life projected in the PFS offer the Company significant time to complete the drilling and permitting required for a subsequent phase, with multiple potential locations for future TMFs already identified.
Subsequent to the establishment of criteria for the PFS, a conceptual expanded pit optimization exercise was completed in consideration of the possibility for a future increase in TMF capacity and without the limitation of the current Project footprint. The results of the conceptual exercise indicated a shell with a larger mineralized inventory at potentially similar grades to the PFS Mineral Reserves. Were such a shell to be ultimately realized, and contingent on all necessary supporting aspects being favourable, including with respect to any impact on key infrastructure, there could be a possibility to extend the mine life by a timeframe of the order of 25 to 30 years beyond the PFS Mineral Reserves. Improvements to the mine plan could also be possible that would reflect further resource benefit optimization, such as delaying the processing of the low-grade stockpile and deferring closure activities. Solaris again notes the conceptual nature of the expanded pit exercise and that it does not represent any increase in Mineral Reserve estimates over those presented in this 2025 Technical Report.
Warintza is a porphyry copper ore body with valuable by-products that diversify revenue. Over the first 15 years, the projected average annual by-product production includes:
- Over 8,600 tonnes per year of molybdenum;
- 57,000 ounces per year of gold; and
- 1.3 million ounces per year of silver.
The project will produce both a clean molybdenum concentrate and a high-quality copper concentrate, both with non-material levels of deleterious elements, such as arsenic, enhancing offtake flexibility and blending economics.
2: Technical Simplicity
Warintza will employ conventional open pit mining methods, with competent rock conditions allowing for favourable slope angles. Operating at an average elevation of 1,200 m with available fresh water and power infrastructure, the project will leverage conventional processing equipment. Further, the site’s natural topography enables a self-contained water basin and gravity-fed TMF design, enhancing water monitoring and management while reducing environmental risk and energy requirements.
3: Supportive Mining District
As an export-oriented nation, Ecuador has a strong existing infrastructure. Paved highways cover the majority of the 300km route to the port, with port facilities already handling similar products from a nearby copper mine.
Warintza is underpinned by a strong and structured social foundation, built through formal agreements, inclusive dialogue, and shared value creation with Indigenous communities and local stakeholders. In 2019, Solaris established a Strategic Alliance with the Shuar communities of Warints and Yawi, creating a participatory model for decision-making, oversight, and benefit sharing. This led to the signing of a long-term Impacts & Benefits Agreement (“IBA”) in 2020, later updated to reflect project growth. The IBA provides for employment, training, education, local procurement, infrastructure, and direct financial benefits.
Building on this foundation, as of September 2025, Solaris has now signed formal cooperation agreements with all Indigenous organizations surrounding Warintza, including PSHA and FICSH, Ecuador’s two largest Shuar representative bodies. These agreements, developed with the support of the Ecuadorian government, demonstrate Warintza’s commitment to inclusive, Indigenous-led resource development.
At the government level, Solaris maintains close engagement with central, provincial, and municipal authorities, and has collaborated transparently through key permitting and consultation processes, including the pilot implementation of Prior Consultation protocols.
4: Robust Economics
The Mineral Reserves have an average copper equivalent grade of 0.41% and a strip ratio of 0.53 to 1. Combining the two creates a highly competitive strip-adjusted grade, translating into lower costs, higher margins and reduced environmental impact. Further, the near-surface high-grade mineralization enables increased early production, minimizing pre-stripping, reducing upfront capital, and providing optimization opportunities for mine sequencing.
The key financial metrics include:
- First quartile All-In Sustaining Costs (“AISC”) of US$0.85/lb-Cu payable (first five years) and US$1.07/lb-Cu payable (first 15 years).
- Post-tax net present value (NPV8%) of US$4,617M (pre-tax NPV8% of US$7,492M) and a post-tax internal rate of return (“IRR”) of 26% (pre-tax IRR of 34%) using metal prices of US$4.50/lb copper, US$2,800/oz gold for the first three years and US$2,500/oz for the remainder of the life, US$20/lb molybdenum, and US$28/oz silver.
- Average annual Earnings before Interest, Tax, Depreciation and Amortization (“EBITDA”) of US$1.9bn per year (first five years) and US$1.4bn per year (first 15 years).
- Average annual post-tax Free Cash Flow (“FCF”) of US$1.3bn (first five years) and US$1.0bn (first 15 years).
- Capital Intensity of US$15,440/Avg tpa-CuEq over the first 15 years and total initial capital costs of US$3.7bn.
- Post-tax payback period of 2.6 years (1.9 years pre-tax payback).
5: District Exploration Hub
Warintza anchors what is emerging as a major new copper-producing district in southeastern Ecuador. The project sits within a highly prospective porphyry corridor that includes the San Carlos and Panantza deposits to the west, both hosting large, historical copper resources with similar geological settings and long-term development potential, and the Mirador mine to the south.
The 2025 MRE incorporates a 312% increase in Measured plus Indicated Mineral Resources compared to the 2024 MRE, with new mineralization defined on the western extension of the deposit. These areas demonstrate strong continuity, near-surface grades, and excellent potential for further growth. Beyond the Warintza West, Central, and East deposits, multiple satellite targets remain underexplored. The 2025 MRE supersedes the 2024 MRE with 142 additional diamond drill holes, resulting in an increase of 964 Mt in Measured and 1,418 Mt in Indicated Resources at Warintza Central and East. The additional drilling completed since the 2024 estimate has added additional material into the 2025 Mineral Resource in the form of Warintza West whilst also converting Mineral Resources previously classified as Inferred into the Indicated and Measured classes.
INVESTOR PRESENTATION
Solaris will host an investor presentation via the IMC platform on Thursday, November 6, 2025, covering today’s announcement. The online event will take place at 14:00 (Zug) / 08:00 (Toronto). The presentation is open to all existing and potential shareholders. Questions can be submitted at any time during the presentation.
Investors can sign up to IMC for free and add to meet Solaris Resources via:
https://www.investormeetcompany.com/solaris-resources-inc/register-investor
SUMMARY OF THE SOLARIS WARINTZA PROJECT PRE-FEASIBILITY STUDY
Overview
The Warintza Project is a copper-molybdenum porphyry deposit located in southeastern Ecuador. AMC Mining Consultants (Canada) Ltd (“AMC”) was commissioned by Solaris Resources Inc. to prepare the independent Technical Report summarizing the results of a Pre-Feasibility Study for the Project.
Drilling conducted between 2020 and 2024 has delineated Warintza (Central, East, and West), supporting the generation of a well-developed geological model. Extensive infill drilling, new metallurgical testing, and mine planning studies have been incorporated into the PFS, which includes a simplified process flowsheet and an optimized mine design.
The PFS contemplates a single-phase open pit operation with a planned 22-year LOM, based on flotation of copper sulphide mineralization. The LOM is currently limited by the design storage capacity of the Tailings Management Facility of 1.3 billion tonnes. This engineering limitation, consistent with the Environmental Impact Assessment application, defines the maximum processing capacity and, therefore, the reported LOM, rather than rather than a more complete realization of the potentially available Mineral Resources.
The PFS has been prepared in accordance with the requirements of National Instrument 43-101 (“NI 43-101”), “Standards of Disclosure for Mineral Projects” of the Canadian Securities Administrators (“CSA”) for lodgement on CSA’s “System for Electronic Data Analysis and Retrieval Plus” (“SEDAR+”).
The Warintza Project consists of porphyry copper–molybdenum deposits that are proposed to be developed using conventional open-pit mining methods. Mineral processing for the Project is planned to include crushing, grinding, and flotation to produce a copper concentrate, with gold and silver by-products, and a separate molybdenum concentrate.
The Property consists of nine metallic mineral concessions covering a total of 26,773 ha (268 km²). Solaris announced an option agreement to acquire up to 100% interest in ten additional concessions adjacent to the Warintza Property, totalling approximately ~40 km², which are considered prospective for porphyry copper and epithermal gold mineralization.
Solaris has signed a Cooperation, Benefits, and Access Agreement (Impact and Benefits Agreement) with local communities within the Project area. The agreement, originally signed in March 2022 and updated in April 2024, grants surface access and use rights necessary for exploration and development activities.
The EIA application was submitted by Solaris in August 2024 to the Ecuador Ministerio de Ambiente, Agua y Transición Ecológica - Ministry of Environment, Water, and Ecological Transition (“MAATE”), recently incorporated into the Ministerio de Ambiente y Energía - Ministry of Environment and Energy (“MAE”). Approval of the EIA will be required before operating and environmental permits can be issued. At the effective date of the PFS, the concessions are in good standing, and Solaris holds all permits required to conduct ongoing exploration activities, including Environmental Licenses for advanced exploration in the Caya 21, Caya 22, and Curigem 9 concessions and Environmental Registrations for initial exploration for the remaining concessions.
Accessibility, climate, infrastructure, and physiography
The Warintza Project is located in the Morona Santiago province, and is accessible by national and provincial highways, with a final 58 km along the Limón–Warints road.
Topography is rugged, with elevations between 800 m and 2,700 m above sea level and slopes of 25°–40°. The climate is tropical humid (Af, Köppen-Geiger) with an average temperature of 22.9°C and annual precipitation of ~1,900 mm, permitting year-round operations. The average elevation of the Warintza pit is 1,200 m.
The region has demonstrated mining viability under similar physiographic and climatic conditions, as evidenced by the nearby Mirador and Fruta del Norte operations.
Mineral Resources
The Warintza Mineral Resources have been reported at an NSR of US$6.30/t and a copper grade equal or greater than 0.1%, within an optimized pit shell at a revenue factor of 1. The Mineral Resources are reported from the regularized model used as the input to the optimization studies. Tonnages have been rounded to the nearest 1 Mt.
| Resource | Tonnage (Mt) | Grade | Contained metal | |||||||
| Classification | CuEq (%) | Cu (%) | Mo (%) | Au (g/t) | Ag (g/t) | Cu (Mt) | Mo (kt) | Au (Moz) | Ag (Moz) | |
| Measured | 1,196 | 0.45 | 0.35 | 0.02 | 0.04 | 1.31 | 4.1 | 231 | 1.7 | 51 |
| Indicated | 2,550 | 0.25 | 0.20 | 0.01 | 0.03 | 1.13 | 5.0 | 222 | 2.5 | 93 |
| Measured plus Indicated | 3,746 | 0.32 | 0.24 | 0.01 | 0.04 | 1.19 | 9.1 | 453 | 4.2 | 143 |
| Inferred | 2,092 | 0.20 | 0.16 | 0.01 | 0.02 | 1.11 | 3.3 | 141 | 1.6 | 75 |
Notes:
- The Mineral Resource Estimate was prepared in accordance with the Canadian Institute of Mining, Metallurgy and Petroleum (“CIM”) Definition Standards for Mineral Resources and Mineral Reserves (2014), and CIM MRMR Best Practice Guidelines (2019).
- Mineral Resources are reported within optimized open pit constraints and a net smelter return (NSR) cut-off value of US$6.30/t and 0.1% Cu cut-off grade, based on a US$5.30/t processing cost and US$1.00/t G&A cost, with a mining cost of US$1.50/t + incremental mining costs increasing by US$0.015/t for every bench below the reference level of 1,340 mRL for Warintza West, 1,145 mRL for Warintza Central, and 1,040 mRL for Warintza East; and US$0.010/t for every bench above these reference levels.
- Metal prices: copper US$4.00/lb, molybdenum US$20.00/lb, gold US$1,850/troy oz, and silver US$20.00/troy oz.
- Respective metal recoveries (Oxide, Mixed, Sulphide): copper 40,85,88%; molybdenum 0,60,65%; gold 0,60,65%; silver 0,60,65%.
- Copper-equivalent grade calculation assumes metal prices and recoveries as per above and includes provisions for downstream selling costs:
- Sulphide CuEq (%) = Cu (%) + 3.94 × Mo (%) + 0.52 × Au (g/t) + 0.01 x Ag (g/t).
- Mixed CuEq (%) = Cu (%) + 3.76 × Mo (%) + 0.50 × Au (g/t) + 0.005 x Ag (g/t).
- Oxide CuEq (%) = Cu (%).
- Oxide and mixed material account for less than 0.01% of the total Mineral Resources.
- Mineral Resources are inclusive of Mineral Reserves.
- Mineral Resources that are not Mineral Reserves do not have demonstrated economic viability.
- The Mineral Resource Estimate was supervised by Mr Nicholas Szebor, MCSM, MSc (Mining Geology), BSc, CGeol, EurGeol, FGS, Director and Global Lead – Geosciences at AMC Consultants, who takes responsibility for the estimate. Mr Szebor is an Independent Qualified Person as defined by NI 43-101. Mr Szebor is a European Chartered Geologist (European Federation of Geologists) and a Chartered Geologist and Fellow of the Geological Society of London.
- The Qualified Person is not aware of any known environmental, permitting, legal, taxation, socio-economic, marketing, political or other relevant factors which could materially affect the stated Mineral Resources.
- All figures are rounded to reflect the relative accuracy of the estimate and, therefore, may not appear to add precisely; this includes the rounding of Au and Mo to two decimal places.
- The effective date of the Mineral Resource estimate is 1 May 2025.
Since the release of the July 2024 MRE, an additional 75,000 metres of diamond drilling have been completed for a total of 177,118 metres in the 2025 MRE estimation. The principal objective of this campaign of drilling was to upgrade Mineral Resources from the Inferred category to the Measured and Indicated categories and to extend the Mineral Resources to Warintza West. The 2025 initial Mineral Resource declaration for the Warintza West area contributes tonnages of 455 Mt to the Indicated and 996 Mt to the Inferred Mineral Resource categories. In reporting the 2025 Mineral Resources a change was made to reporting at an NSR cut-off at US$6.30/t and 0.1% Cu cut-off grade rather than the 0.25% CuEq used in the 2024 MRE. A 0.25% CuEq was selected in 2024 to provide a conservative cut-off for reporting. The change to the NSR cut-off corresponds to reporting at a lower CuEq approximating 0.15% CuEq and therefore includes some material excluded as part of the 2024 estimate. The 2025 MRE also incorporates silver grades in the new estimation.
Mineral Reserves
The open pit Mineral Reserves are reported within an optimized pit design. The Mineral Reserves represent the economically mineable part of the Measured and Indicated Mineral Resources and are presented below.
| Classification | Tonnes | Grade | Contained Metal | |||||||
| (Mt) | Copper Equivalent (%) | Cu (%) | Mo (%) | Au (g/t) | Ag (g/t) | Cu (Mt) | Mo (kt) | Au (Moz) | Ag (Moz) | |
| Proven | 797 | 0.49 | 0.37 | 0.02 | 0.05 | 1.37 | 3.0 | 171 | 1.2 | 35.0 |
| Probable | 503 | 0.28 | 0.22 | 0.01 | 0.03 | 1.19 | 1.1 | 43 | 0.6 | 19.2 |
| Total | 1,300 | 0.41 | 0.31 | 0.02 | 0.04 | 1.30 | 4.1 | 214 | 1.8 | 54.1 |
Notes:
- CIM Definition Standards (2014) were used for reporting the Mineral Reserves.
- The Qualified Person is Eugene Tucker, P.Eng. of AMC Mining Consultants (Canada) Ltd.
- A NSR cut-off value of 6.30 US$/tonne and 0.1% copper cut-off grade were used.
- Metal prices: copper US$4.00/lb, molybdenum US$20.00/lb, gold US$1,850/troy oz, and silver US$20.00/troy oz.
- Respective metallurgical recoveries (oxide, mixed, sulphide): copper 40,85,88%; molybdenum 0,60,65%; gold 0,60,65%; silver 0,60,65%.
- Respective payable metal: copper 96.5%, gold 91%, silver 91%, molybdenum 100%
- Copper-equivalent grade calculation assumes metal prices and recoveries as per above and includes provisions for downstream selling costs:
- Sulphide CuEq (%) = Cu (%) + 3.94 × Mo (%) + 0.52 × Au (g/t) + 0.01 x Ag (g/t).
- Mixed CuEq (%) = Cu (%) + 3.76 × Mo (%) + 0.50 × Au (g/t) + 0.005 x Ag (g/t).
- Oxide CuEq (%) = Cu (%).
- Oxide and mixed material account for less than 0.02% of the total Mineral Reserves.
- Mineral Reserves are converted from Mineral Resources through the process of pit optimization, pit design, production scheduling, and are supported by a positive cash flow model.
- Numbers may not compute exactly due to rounding.
- Probable Mineral Reserves are based on Indicated Mineral Resources only.
- Proven Mineral Reserves are based on Measured Mineral Resources only.
- Mineral Reserve estimates are as of 1 May 2025. Mineral Reserve estimates are limited to the portion of the Measured and Indicated Resource estimates scheduled for milling and included in the financial model of the PFS.
Mining
Mining at Warintza will be undertaken by conventional open-pit, truck-and-shovel methods, with support from loaders for narrower working areas and stockpile reclaim. The operation will be developed through two main pits, Warintza Central and Warintza East, subdivided into eight phases to optimize grade sequencing and maintain low strip ratios in the early years of operation, with steady-state ore production of ~60.2 Mt per year to support a mine life of approximately 22 years.
The mining fleet will be owner-operated following a two-year pre-stripping period. Primary equipment will include 120-ton class cable shovels, 70-ton wheel loaders, and 320-ton haul trucks, supported by dozers, graders, and water trucks. Pit designs incorporate bench heights of 15–30 m, dual-lane haul roads at 40 m width, and slope angles ranging from 36° to 47°, depending on geotechnical domains. Drilling and blasting will be carried out on 15 m benches using 311 mm diameter holes, with annual explosives consumption ranging from 46,000–58,000 t at peak production.
The production schedule emphasizes high-grade ore delivery in the initial years, supported by the use of stockpiles. Approximately 221 Mt of low-grade ore is projected to be stockpiled for processing in the later years, with remaining low-grade balances constrained by tailings storage limits. Waste rock will be placed in engineered facilities designed to meet stability standards under static, pseudo-static, and post-earthquake conditions. In the final years of the mine life, ore supply will transition primarily to stockpile reclaim before progressing to closure and reclamation activities.
Annual production quantities
| Year | Mill Feed | Stockpile Movement | Waste (Mt) | Total Material Moved (Mt) | |||||||
| Ore (Mt) | Cu (%) | Mo (%) | Au (g/t) | Ag (g/t) | High-grade Stockpile (in) | High-grade Stockpile (out) | Low-grade Stockpile (in) | Low-grade Stockpile (out) | |||
| (Mt) | (Mt) | (Mt) | (Mt) | ||||||||
| Yr-2 | 4.16 | 4.16 | |||||||||
| Yr-1 | 8.35 | 29.26 | - | 38.23 | 75.84 | ||||||
| Yr01 | 54.20 | 0.43 | 0.02 | 0.05 | 1.45 | 14.81 | 3.55 | 41.54 | - | 49.45 | 160.00 |
| Yr02 | 60.23 | 0.51 | 0.03 | 0.05 | 2.22 | 48.21 | - | 26.35 | - | 25.22 | 160.00 |
| Yr03 | 60.23 | 0.45 | 0.02 | 0.06 | 1.74 | 22.54 | 17.80 | 36.07 | - | 41.16 | 160.00 |
| Yr04 | 60.23 | 0.44 | 0.03 | 0.05 | 1.26 | 33.52 | 9.77 | 46.49 | - | 19.76 | 160.00 |
| Yr05 | 60.23 | 0.35 | 0.02 | 0.05 | 1.30 | - | 27.00 | 54.47 | - | 45.30 | 160.00 |
| Yr06 | 60.23 | 0.37 | 0.02 | 0.05 | 1.18 | - | - | 48.32 | - | 51.45 | 160.00 |
| Yr07 | 60.23 | 0.38 | 0.02 | 0.05 | 1.18 | - | - | 32.81 | - | 36.97 | 130.00 |
| Yr08 | 60.23 | 0.33 | 0.02 | 0.04 | 1.30 | - | 13.09 | 23.43 | - | 36.35 | 120.00 |
| Yr09 | 60.23 | 0.33 | 0.02 | 0.04 | 1.40 | - | 20.00 | 26.85 | - | 13.75 | 100.82 |
| Yr10 | 60.23 | 0.29 | 0.02 | 0.04 | 1.57 | - | 25.00 | 15.29 | - | 24.48 | 100.00 |
| Yr11 | 60.23 | 0.24 | 0.01 | 0.04 | 1.04 | - | 5.00 | 13.18 | - | 26.59 | 100.00 |
| Yr12 | 60.23 | 0.25 | 0.01 | 0.04 | 1.08 | - | 3.00 | 1.22 | - | 28.55 | 90.00 |
| Yr13 | 60.23 | 0.32 | 0.02 | 0.04 | 1.19 | - | 3.00 | 2.96 | - | 21.82 | 85.00 |
| Yr14 | 60.23 | 0.33 | 0.02 | 0.04 | 1.12 | - | 0.23 | 0.00 | - | 19.77 | 80.00 |
| Yr15 | 60.23 | 0.32 | 0.02 | 0.04 | 1.18 | - | - | 0.05 | - | 13.31 | 73.58 |
| Yr16 | 60.23 | 0.26 | 0.01 | 0.04 | 1.22 | - | - | - | - | 9.77 | 70.00 |
| Yr17 | 60.23 | 0.27 | 0.01 | 0.04 | 1.19 | - | - | - | - | 4.15 | 64.37 |
| Yr18 | 60.23 | 0.31 | 0.02 | 0.04 | 1.27 | - | - | - | - | 1.14 | 61.37 |
| Yr19 | 60.23 | 0.21 | 0.01 | 0.03 | 1.18 | - | - | - | 59.65 | - | 60.23 |
| Yr20 | 60.23 | 0.17 | 0.01 | 0.03 | 1.16 | - | - | - | 60.23 | - | 60.23 |
| Yr21 | 60.23 | 0.15 | 0.01 | 0.03 | 1.17 | - | - | - | 60.23 | - | 60.23 |
| Yr22 | 41.30 | 0.14 | 0.00 | 0.03 | 1.02 | - | - | - | 41.30 | 41.30 | |
| Total | 1,300.00 | 0.31 | 0.02 | 0.04 | 1.30 | 127.43 | 127.43 | 398.30 | 221.40 | 511.39 | 2,337.12 |
Processing
The Warintza process plant feed will be a mix of supergene and hypogene ores, with the latter being prevalent. Supergene ore is mostly enriched secondary copper sulphide mineralization (chalcocite and bornite) with some primary copper sulphides (chalcopyrite), while hypogene ore is comprised of chalcopyrite.
The proposed processing method follows conventional porphyry copper-molybdenum (Cu-Mo) concentrator flowsheets. The processing facilities are designed for a throughput rate of 165,000 t/d (60.2 Mt/y).
Ore will be subject to primary crushing, followed by secondary crushing, SAG and ball milling to produce a milled product size with a P80 of 150 µm. Secondary crushing was selected, due to the projected high ore competency (high DWi), to increase SAG mill throughput. Two grinding lines will be installed, each comprising a dual pinion 24 MW SAG mill and two dual pinion 22 MW ball mills.
A rougher flotation circuit will produce a rougher flotation concentrate that will be reground to a P80 of 25 µm and floated through three stages of cleaning to produce a bulk copper-molybdenum concentrate.
Copper and molybdenum concentrates will be separated from the bulk copper-molybdenum concentrate, and both types of concentrate will be dewatered and dispatched to off-site smelters.
Flotation tailings will be dewatered in two tailings thickeners and the thickened slurry pumped to either the TMF or cyclone stations to produce sand for TMF embankment construction and slimes for deposition into the TMF.
The location of the process plant and associated facilities adjacent to the mine is in steep terrain requiring extensive and costly earthworks. Footprint optimization and terracing of the plant site may significantly reduce earthworks costs.
Infrastructure
The major support infrastructure includes access roads, concentrate storage for shipping, power supply and distribution, communications, water management, tailings facilities, and construction and operations accommodation facilities.
Access roads
Site access road designs from Gualaceo-Plan de Milagro national highway to the Project were developed. The concentrate transportation will follow a route from the site to the Port of Bolivar, located 4 km east of the city of Machala. The planned ports for transportation and shipment of heavy machinery, equipment, and materials are Bolivar in Machala and Posorja in Guayaquil.
Power supply
The power supply for the Warintza Project is based on a total power demand of 236 MW. The power supply system will be via a 62.1 km overhead 230 kV transmission line from the Bomboiza substation.
Water supply
Raw water supply for the project will be supplied from a rainwater intake on the North Diversion Channel. From this point, water will be transported by gravity through a pipeline system to a tank within the plant. Non-contact water will be managed through diversion channels and attenuation dams, while contact water will be directed to the TMF for recycling to the process plant.
Tailings storage
The TMF has been designed to store approximately 1.3 billion tonnes of tailings over the projected 22-year mine life within the natural drainage basin of the Warintza river. It will be contained by four dams within the Warints stream valley. The starter dams will be a rockfill embankment with a low-permeability core and a geomembrane liner on Dam No. 1. A drainage system at the base of the dam will manage seepage, with collected water returned to the TMF pond.
Following the construction of the starter dam, the TMF dams are designed using a centreline construction method with staged raises. The tailings conveyance system transports processed tailings via pipelines, where cycloning separates them into coarse and fine fractions. The coarse fraction will be used for dam raises, while the fine fraction will be discharged into the TMF. Based on current testing, geochemical modelling indicates that the TMF is expected to maintain a neutral pH at the final collection point.
The Waste Rock Facility (“WRF”) will be located upstream of the Tailings Management Facility, south of the Warintza pit, and is designed for approximately 670 million tonnes of waste material. Waste placement will occur from downstream to upstream for geotechnical stability.
Communication
The Project will establish a fibre optic line with leased internet and radio backup, redundant network switches, industrial Wi-Fi 6E (up to 40 Gbps), 100 4K CCTV cameras with NVR redundancy, biometric / RFID access control, TETRA radios, and a centralized monitoring centre to facilitate reliable operations.
Site accommodation
The strategy for the site accommodation has one main permanent camp for operations near the plant, and minor temporary camps in Piuntz, Yawi, and Warintz community areas for the construction phase.
Environmental studies, permitting and social or community impact
Baseline environmental, social, archaeological, and geochemical studies were completed between 2020 and 2021 to support advanced exploration activities. The results informed EIAs for the Caya 21, Caya 22, and Curigem 9 concessions, which were approved in June 2023, with corresponding licenses granted. The EIA for Curigem 9-1 was approved in November 2024, with the license pending.
During 2024–2025, Solaris advanced preparation of the exploitation-phase EIA for the Warintza Project. The EIA incorporates updated pit designs, site layout, water management, waste rock and tailings facilities, and processing plant design. The EIA has been submitted to MAATE (recently incorporated into MAE) and is under review at the effective date of the PFS.
Solaris has engaged in dialogue with Ecuador’s Ministry of Environment and Energy (formerly the Ministry of Energy and Mines and the Ministry of Environment, Water and Ecological Transition). The Company is understood to have formally addressed all inquiries and has confirmed that the final Technical EIA report has been submitted and is currently under government review.
Environmental and social baseline programs include biological surveys; cultural resource assessments; geochemical testing of waste rock, tailings and ore; and surface / groundwater studies. The social area of direct influence includes the Shuar Centre of Warintz and the Shuar Community of Yawi, where formal agreements and programs in employment, education, entrepreneurship, gender equity, and environmental stewardship have been established.
In July 2025, Solaris hosted a site visit by the Sub-Secretary of the Ministry of Environment and Energy, who met with Indigenous and local stakeholders to assess the project’s readiness for the Free, Prior and Informed Consultation (“FPIC”) process, a formal requirement under Ecuadorian Constitution and law for major resource developments.
Simultaneously, the Company is understood to be working alongside Ecuador’s Ministry of Environment and Energy to advance the Exploitation Agreement permits. To date, good progress is reported as having been made, focusing on the Engineering facilities and Water Management.
Marketing
Production from the project will be sold as copper concentrate with gold and silver by-products, and molybdenum concentrate. Solaris has entered into a gold streaming agreement with Royal Gold Inc. and a partial offtake agreement with Orion Resource Partners for copper and molybdenum concentrates. Remaining copper and molybdenum concentrates will be sold on the open market. Treatment and refining charges used are based on benchmark information for similar operations selling similar products in the region.
Capital and operating costs
Capital cost summary
| Area | Total (US$M) |
| Processing Plant (including earthworks) | 1,063 |
| Camp and Site Infrastructure | 273 |
| Engineering, Procurement & Construction Management | 256 |
| Mine Equipment | 304 |
| TMF and Water Management | 509 |
| Pre-Stripping and Haul Road Construction | 179 |
| Other (Preliminary works, project team and G&A, IT, and light vehicle fleet) | 89 |
| Indirect costs | 310 |
| Contingency | 505 |
| Value-added tax (“VAT”) | 242 |
| Total initial capital | 3,729 |
| Open pit | 736 |
| Infrastructure | 356 |
| TMF | 239 |
| Water management | 211 |
| Processing Plant | 65 |
| Indirect and studies | 106 |
| Total sustaining capital | 1,713 |
| Total capital (initial and sustaining capital) | 5,443 |
Note: The totals may not sum due to rounding.
Operating cost summary
| Operating cost category | Total US$M | ||
| Mining | 3,116 | US$/t-moved | 1.38 |
| Processing | 7,250 | US$/t-milled | 5.58 |
| G&A | 1,010 | US$/t-milled | 0.78 |
Economics analysis
Metal price assumptions for the economic analysis referenced long-term consensus forecasts and are presented below:
| Metal | Unit | Price |
| Copper | US$/lb | 4.50 |
| Gold | US$/oz | 2,500* |
| Silver | US$/oz | 28 |
| Molybdenum | US$/lb | 20 |
Note: *For the first three years of production US$2,800/oz is used, with US$2,500/oz for the remainder of the mine life.
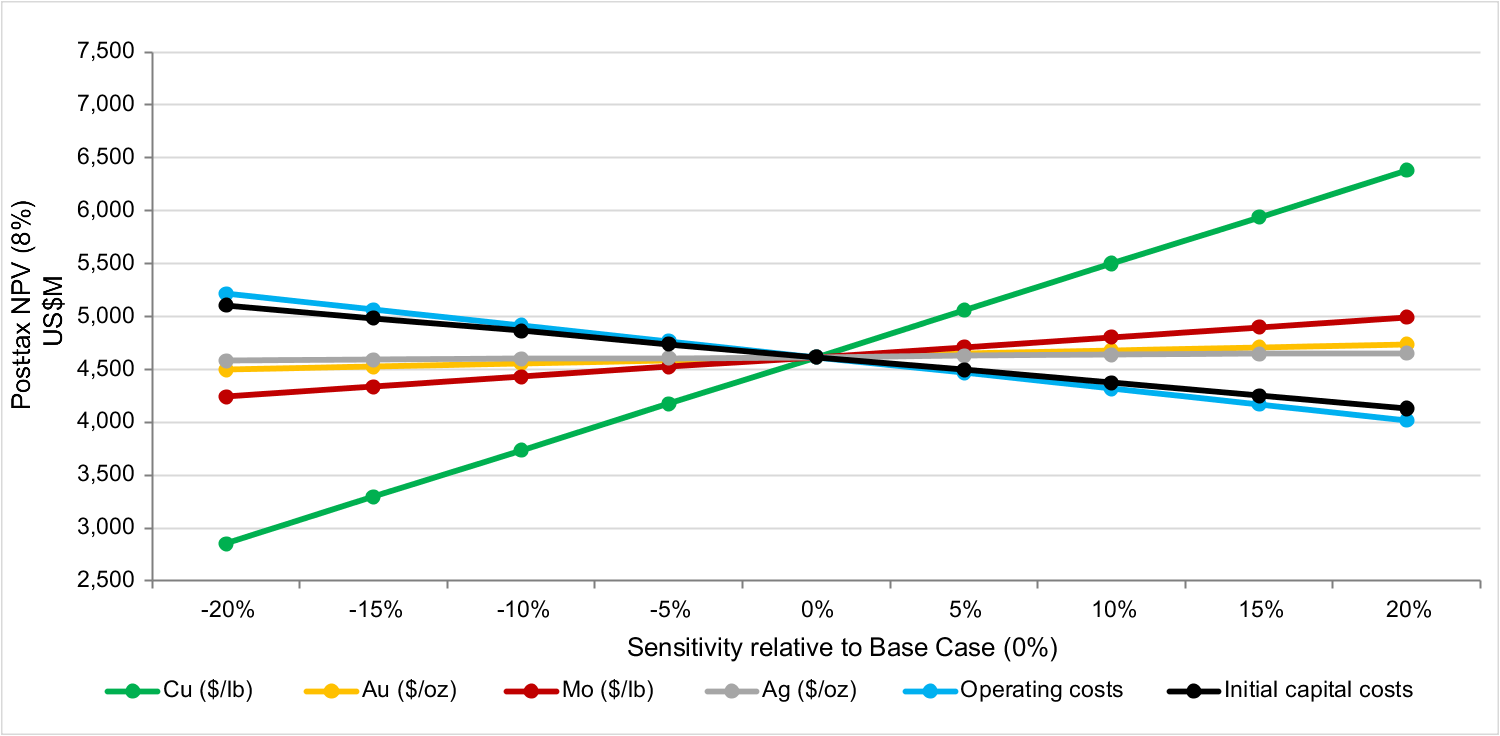
Post-tax NPV sensitivity
A comprehensive sensitivity analysis has been conducted for the Warintza Project to assess the potential impact of key variables on the project economics. The analysis was examined over individual variations of +/- 20% in Cu, Au, Mo, and Ag metal prices, along with operating costs and initial capital costs.
The results show that the Project NPV at an 8% discount rate is most sensitive to changes in copper prices (equivalent changes in Cu grades would produce effectively the same result). The LOM operating costs and the initial capital costs, incurred over the three-year construction period, are the second and third most influential factors affecting the NPV, followed by the price of molybdenum.
QUALIFIED PERSONS
A "Qualified Person" is as defined by the National Instrument 43-101 of the Canadian Securities Administrators. The named Qualified Person(s) have verified the data disclosed, including sampling, analytical, and test data underlying the information or opinions contained in this announcement in accordance with standards appropriate to their qualifications. The independent Qualified Persons are Mr. Nicholas Szebor, EurGeol, CGeol, Director and Global Lead – Geosciences at AMC Consultants, who supervised and approved the Mineral Resource Estimate; Mr. Roderick Carlson, FAIG (RPGeo), MAusIMM, Technical Lead – Geosciences at AMC Consultants, is responsible for the exploration, drilling, sample preparation, and assays. The preparation of the Mineral Reserve Estimate and mining aspects of the PFS was supervised and approved by Mr. Eugene Tucker, P.Eng., Director and Global Lead – Open Pit Mining at AMC Consultants. The costs (excluding process plant and site services) and economics of the PFS were prepared under the supervision of Ms. Mary Alejo Hito, P.Eng., Principal Mining Engineer at AMC Consultants. The preparation of the metallurgy, processing, and site infrastructure aspects (excluding TMF, WRF, and water management) of the PFS was supervised by Mr. Greg Lane, FAusIMM, Principal Consultant at Ausenco. Mr. Guillermo Hernán Barreda Flores, SME Registered Member, Regional Manager at Knight Piésold, prepared the TMF, WRF, and site water management aspects of the PFS. All are experts in their relevant disciplines and fulfil the requirements to be a "Qualified Person" as defined by National Instrument 43‐101.
The Qualified Persons have reviewed and approved the scientific and technical information contained in this news release and believe it fairly and accurately represents the information from the 2025 Technical Report.
The 2025 Pre-Feasibility Study Technical Report will be made available for review on the SEDAR+ system and on the Company’s website at www.solarisresources.com within 45 days of this news release.
On behalf of the Board of Solaris Resources Inc.
“Matthew Rowlinson”
President & CEO, Director
For Further Information
Patrick Chambers, VP Business Development & Investor Relations
Email: pchambers@solarisresources.com
About Solaris Resources Inc.
Solaris Resources is a copper-gold exploration and development company advancing a portfolio of high-quality assets across the Americas. Its flagship asset is the 100%-owned Warintza Project in southeast Ecuador, a Tier 1 copper porphyry deposit with over 1.3 billion tonnes of Mineral Reserves and outstanding economics driven by high-grade, near-surface mineralization and a world-class strip-adjusted grade. Warintza stands out for its scale, simplicity, and strong community partnerships built through formal agreements and inclusive engagement. Solaris is committed to responsible mining practices that prioritize environmental stewardship, shared value creation, and long-term benefits for local communities and stakeholders.
Cautionary Notes and Forward-looking Statements
This document contains certain forward-looking information and forward-looking statements within the meaning of applicable securities legislation (collectively “forward-looking statements”). The use of the words “will” and “expected” and similar expressions are intended to identify forward-looking statements. These statements include statements regarding the results of the Technical Report, including future Project opportunities, future operating and capital costs, closure costs, timelines, permit timelines, and the ability to obtain the requisite permits; the outcome of the governmental review of the Technical EIA report; the outcome of the FPIC process; life of mine estimates for Warintza, including, but not limited to, copper production, grades, mining rates, strip ratios and the costs thereof; economics and associated returns of the Project; the technical viability of the Project; the ability to establish lines of communication at the Project, including but not limited to, the fibre optic line with leased internet and radio; the environmental impact of the Project, the ongoing ability to work cooperatively with stakeholders; the estimation of Mineral Reserves and Mineral Resources; the conversion of Mineral Resources to Mineral Reserves; and the filing and effective date of the Technical Report. Although Solaris believes that the expectations reflected in such forward-looking statements and/or information are reasonable, readers are cautioned that actual results may vary from the forward-looking statements. The Company has based these forward-looking statements and information on the Company’s current expectations and assumptions about future events including assumptions regarding the exploration and regional programs. These statements also involve known and unknown risks, uncertainties and other factors that may cause actual results or events to differ materially from those anticipated in such forward-looking statements, including the risks, uncertainties and other factors identified in the Solaris Management’s Discussion and Analysis, for the year ended December 31, 2024 available at www.sedarplus.ca. Furthermore, the forward-looking statements contained in this news release are made as at the date of this news release and Solaris does not undertake any obligation to publicly update or revise any of these forward-looking statements except as may be required by applicable securities laws.
A photo accompanying this announcement is available at https://www.globenewswire.com/NewsRoom/AttachmentNg/a6b3456f-c0e8-43d0-b344-52f6ab92a58e

![]()


