

Wheat futures took a robust spike from mid-May through June 2023, rising over 15%. That rally fizzled as shares fell back down (11%) in the last week of June. The Teucrium Wheat Fund (NYSEARCA: WEAT) tracks the price of the underlying commodity. Wheat prices were initially elevated in 2022 with the onset of the Russia-Ukraine war. As prices steadily came down, While wheat prices have pulled back, Russian exports have been very strong, despite sanctions.
A threat of the Black Sea grain deal falling through caused wheat prices to surge. Investors may want to play stocks that benefit from rising wheat prices and consider stepping in on the pullbacks. If you are one of those investors, here are two agriculture stocks to consider for playing the wheat rally.
Archer-Daniels-Midland Company (NYSE: ADM)
Archer-Daniels-Midland benefits from higher wheat and grain prices as one of the world’s largest. The company processes wheat into products like pasta, flour and bakery products. Additionally, it processes oilseeds like soybean into oil and biodiesel.
It processes corn into corn syrup, animal feed and ethanol. ADM’s net profits rose 10% YoY from elevated wheat and grain prices. It is one of the world’s largest wheat traders, with a 10% global market share. The company processes 50 million bushels of wheat daily, generating $10 billion annually. ADM uses wheat futures to hedge risk and protect itself from price fluctuations. Shares have been trading near the lower range of its weekly rectangle.
ADM shares are down (15.7%) year-to-date (YTD) and pay a 2.38% annual percentage yield. Roth MKM initiated coverage of ADM with a Buy rating and $92 price target on June 22, 2023.
Archer-Daniels-Midland analyst ratings and price targets are at MarketBeat.
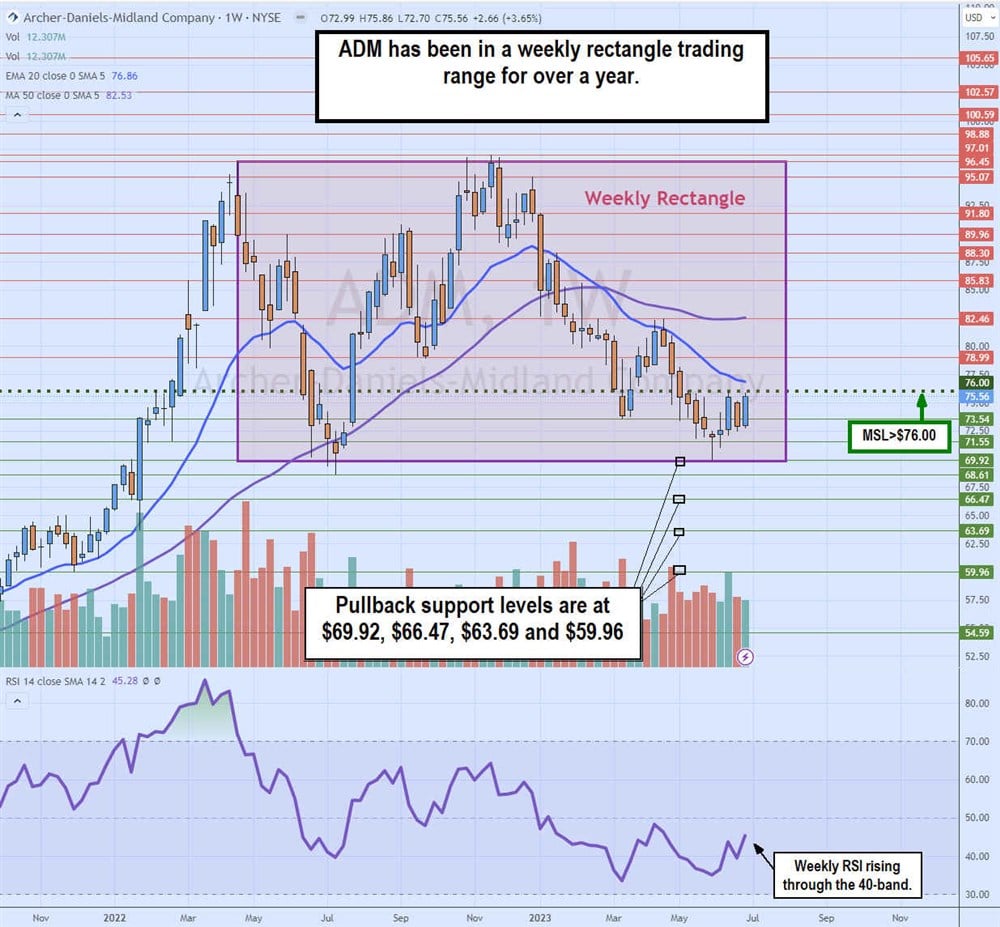
Weekly Rectangle
The ADM weekly candlestick chart has been in a weekly rectangle trading range between $96.45 and $69.92 since April 2022. The rectangle commenced after peaking at $96.45 in April 2022. Shares fell to a low of $68.61 in July 2022. It’s worth noting the weekly RSI was extremely overbought around the 87-band at the peak and fell to the 40-band by the lows.
Shares rallied on a weekly market structure low (MSL) buy trigger breakout through $76.00, sending shares up to retest the upper flat-top trendline around $97 in November 2022. Shares proceeded to sell off all the way back down to retest the flat-bottom trendline at $69.92 by May 2023 as it staged a rally coinciding with the rally in wheat futures. Pullback support levels are at $69.92, $66.47, $63.69 and $59.96.
The Andersons Inc. (NASDAQ: ANDE)
The Andersons is an American agribusiness operating mostly in North America. The company operates a network of grain elevators and storage facilities. It also provides rail transportation services for other agribusinesses. The company also owns and operates ethanol plants and plant nutrients manufacturing business.
The wheat segment falls under its grain handling business, generating over half its total revenues. It generated profits of $0.20 per share in its Q1 2023 earnings report released on May 2, 2023. Revenues fell (2.4%) year-over-year (YoY) to $3.88 billion, which also fell short of analyst expectations of $3.94 billion. Diversifying its business lines has helped keep shares strong in 2023 with YTD gains of $25.8%. ANDE stock pays a 1.6% annual dividend yield. On June 22, 2023, Roth MKM initiated coverage of ANDE with a Buy rating and a $55 price target.
The Andersons analyst ratings and price targets are at MarketBeat.
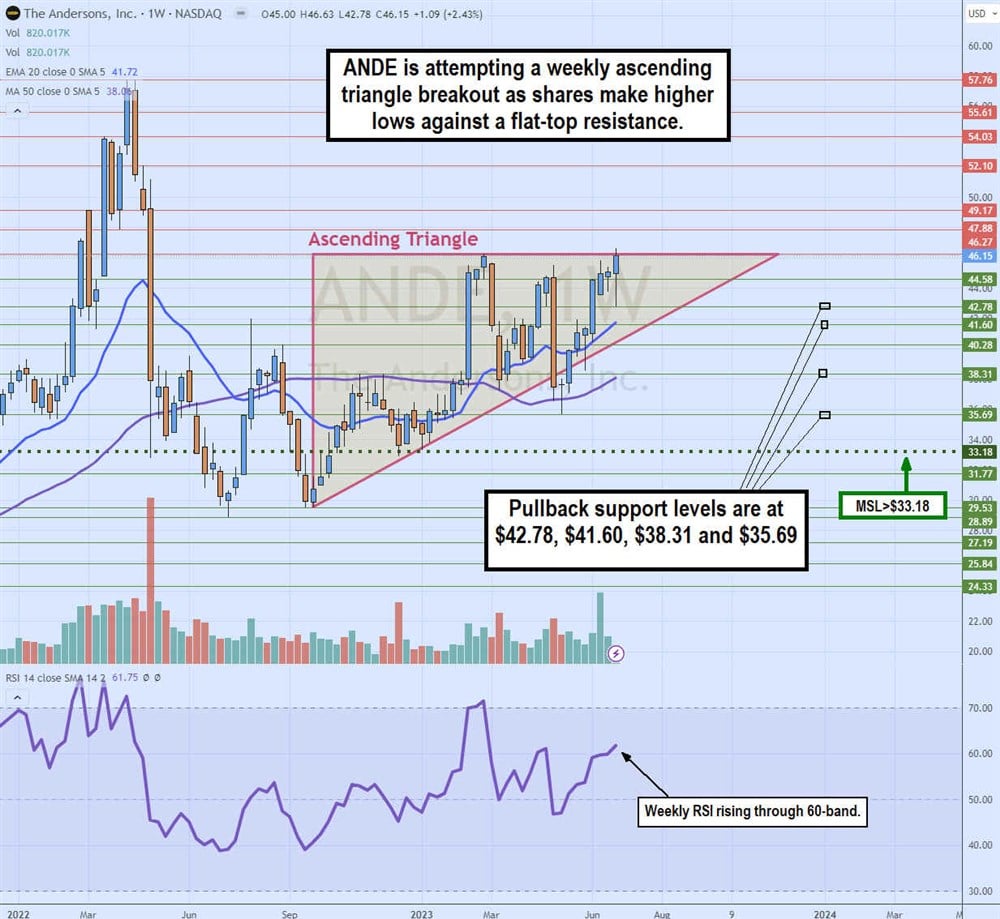
Weekly Ascending Triangle
The weekly candlestick chart on ANDE shows the weekly triangle that formed after making a swing low of $29.53 in September 2022. ANDE staged a rally on the breakout through the $33.18 market structure low (MSL) trigger. Shares reached a peak at $46.15 in February 2023 before falling to retest the ascending trendline in May 2023.
Shares actually fell under the diagonal trendline, holding support at the weekly 50-period moving average (MA) at $36.84. ANDE spent the first week in May 2023 under the trendline, appearing as if it would form a breakdown out of the triangle until shares shot back up into the triangle range in the middle of May 2023. ANDE grinded higher or six straight weeks to rest the $46.15 upper trendline as the weekly RSI rose through the 60-band.
A potential breakout can form if shares can hold above the $46.15 trendline. Pullback support levels are at $42.78, $41.60, $38.31 and $35.69.


