
Over the past six months, Synchrony Financial’s shares (currently trading at $74.51) have posted a disappointing 11% loss, well below the S&P 500’s 10.9% gain. This was partly due to its softer quarterly results and may have investors wondering how to approach the situation.
Following the pullback, is this a buying opportunity for SYF? Find out in our full research report, it’s free.
Why Are We Positive on Synchrony Financial?
Powering over 73 million active accounts and partnerships with major brands like Amazon, PayPal, and Lowe's, Synchrony Financial (NYSE: SYF) provides credit cards, installment loans, and banking products through partnerships with retailers, healthcare providers, and digital platforms.
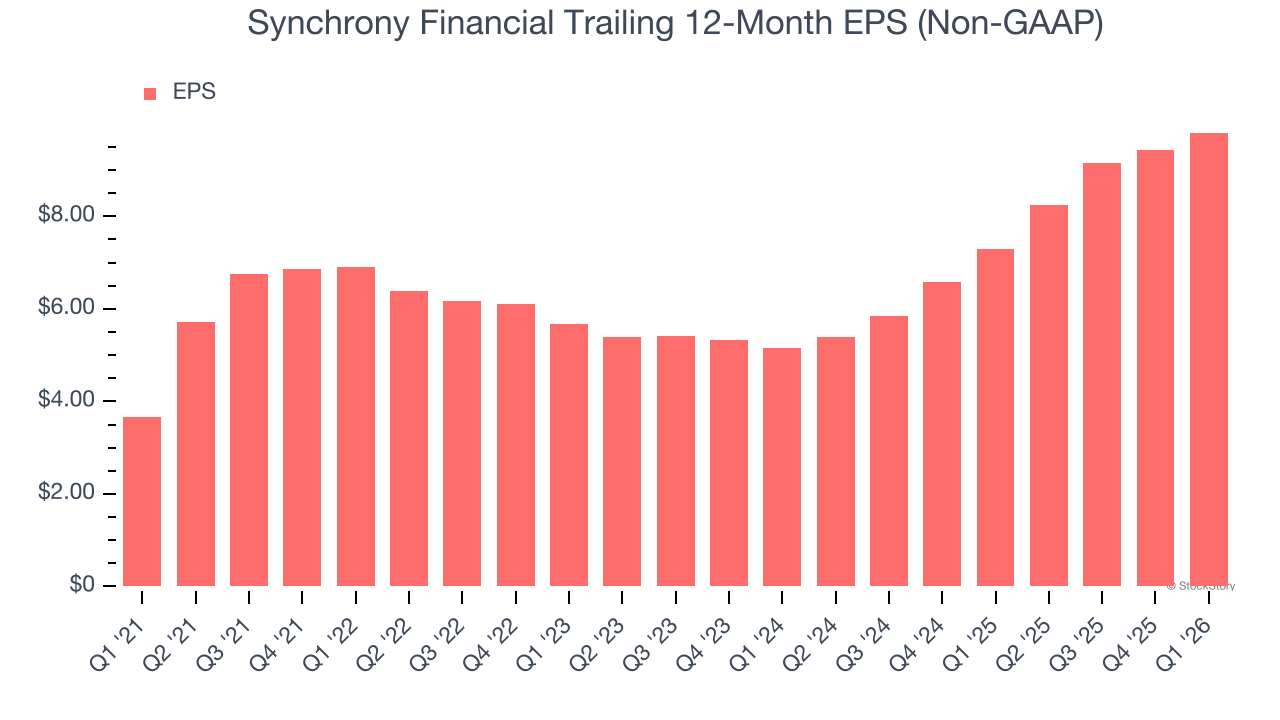
1. Outstanding Long-Term EPS Growth
We track the long-term change in earnings per share (EPS) because it highlights whether a company’s growth is profitable.
Synchrony Financial’s EPS grew at 21.8% compounded annual growth rate over the last five years, higher than its 7% annualized revenue growth. This tells us the company became more profitable on a per-share basis as it expanded.
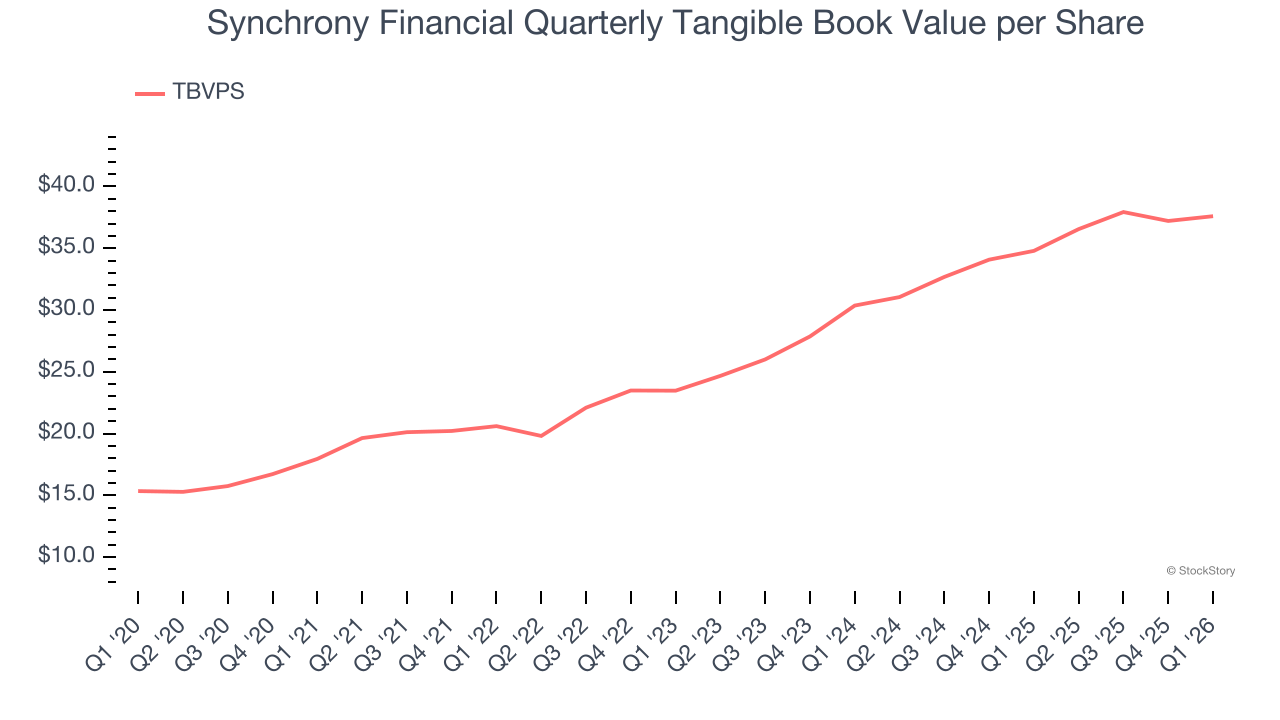
2. Steady Increase in TBVPS Highlights Solid Asset Growth
We consider tangible book value per share (TBVPS) an important metric for financial firms. TBVPS represents the real, liquid net worth per share of a company, excluding intangible assets that have debatable value upon liquidation.
Synchrony Financial’s TBVPS increased by 15.9% annually over the last five years, and although its annualized growth has recently decelerated to 11.3% over the last two years (from $30.36 to $37.59 per share), we still think its performance was solid.
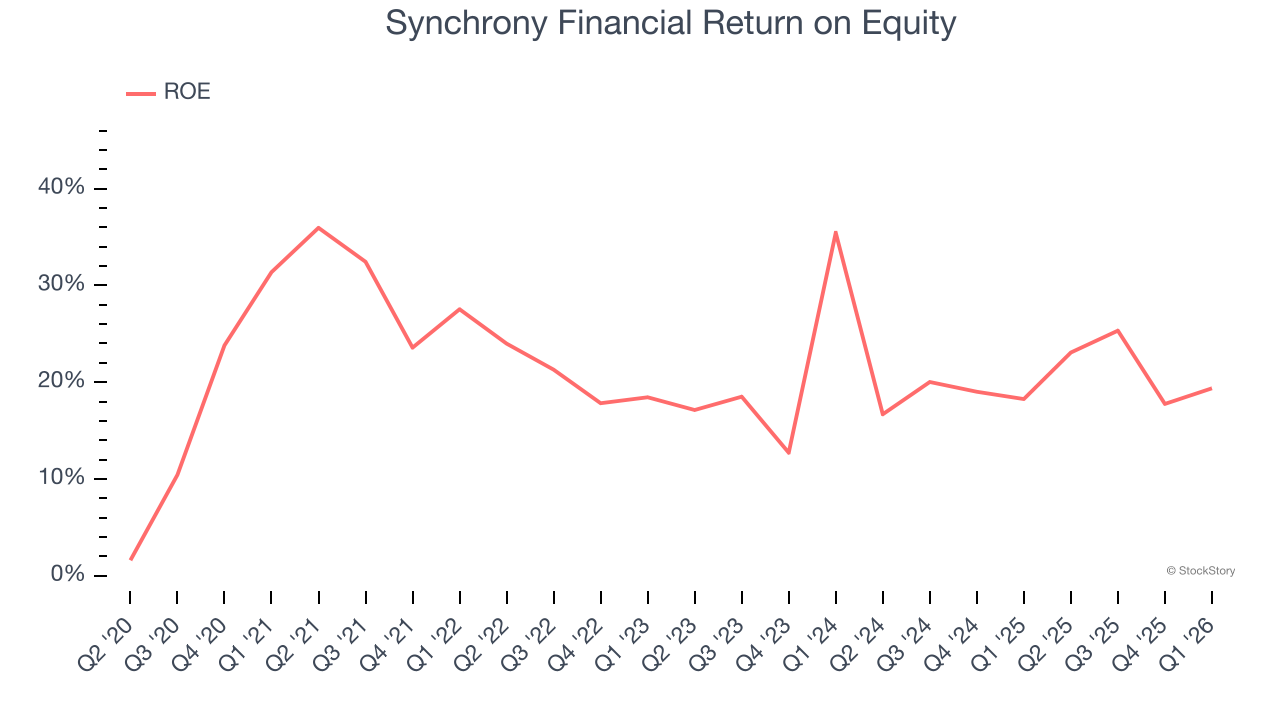
3. Stellar ROE Showcases Lucrative Growth Opportunities
Return on equity, or ROE, quantifies financial firm profitability relative to shareholder equity — an essential capital source for these institutions. Over extended periods, superior ROE performance drives faster shareholder wealth compounding through reinvestment, share repurchases, and dividend growth.
Over the last five years, Synchrony Financial has averaged an ROE of 22.2%, exceptional for a company operating in a sector where the average shakes out around 10% and those putting up 25%+ are greatly admired. This shows Synchrony Financial has a strong competitive moat.
Final Judgment
These are just a few reasons Synchrony Financial is a high-quality business worth owning. With the recent decline, the stock trades at 7.8× forward P/E (or $74.51 per share). Is now the right time to buy? See for yourself in our in-depth research report, it’s free.
High-Quality Stocks for All Market Conditions
WHILE YOU’RE HERE: Top 9 Market-Beating Stocks. The best stocks don’t just beat the market once. They do it again. And again. Robust revenue growth, rising free cash flow, returns on capital that leave their competition in the dust. The market has already rewarded these businesses.
But our AI platform says the party isn’t over. Find out which 9 stocks made the cut this week — FREE. Get Our Top 9 Market-Beating Stocks for Free HERE.
Stocks that have made our list include now familiar names such as Nvidia (+1,326% between June 2020 and June 2025) as well as under-the-radar businesses like the once-micro-cap company Kadant (+351% five-year return). Find your next big winner with StockStory today.