

The rideshare industry has come a long way since its beginnings over a decade ago. While the business models make sense, the reality is that making profits is extremely hard for rideshare companies. It's also turning out to have very high barriers to entry. Ridesharing can be categorized as the Transportation sector. However, the leader will argue that it's a technology company in the Computer and Technology sector since it manages the mobile app platform that matches customers with service providers.
The incumbent king of the mountain is Uber, as the NASDAQ: LYFT">ridesharing company closes its second consecutive quarter of GAAP profitability after 14 years. The race for second and third place falls in the hands of many. If Uber shares are pricing in profits, could it mean the other players have more upside on their way to profitability sometime in the future? If Lyft has a 24% market share and $4 billion market cap compared to Uber's 74% market share and $106 billion market cap, wouldn't Lyft have more upside potential from an investor's point of view? Here's a comparison of three rideshare stocks.
Uber Technologies Inc. (NYSE: UBER)
The name is synonymous with ridesharing. It's so well branded that the name has become a verb, as in "to Uber home or someplace." The company was founded in 2009 and is experiencing GAAP profitability 14 years later. The company diversified beyond rideshare to include Uber Eats and Postmates food delivery, e-scooter rentals and freight. The pandemic reopening supercharged its business, and unlike most other industries, it hasn't shown much negative normalization for Uber. The company provides a leasing program for its drivers to lease cars to drive for a weekly fee. They also have electric vehicle (EV) incentives and options to lease a Tesla Inc. (NASDAQ: TSLA) Model 3 EV through its partnership with Hertz Global Holdings Inc. (NASDAQ: HTZ). However, its latest earnings report shows some deceleration relative to analyst estimates.
Robust Q3 2023 metrics
Uber reported its second quarter of GAAP profitability. On November 7, 2023, Uber reported its Q3 2023 earnings for September 2023. The company earned 11 cents per share, beating analyst estimates of 7 cents a share by 4 cents. Net income was $221 million, which includes a $96 million pre-tax headwind for net unrealized losses related to the revaluation of Uber's equity investments. Revenues rose 11.4% YoY to $9.29 billion, falling short of the $9.54 billion estimates.
Uber's gross bookings rose 21% YoY at $35.3 billion. Trips for the quarter rose 25% YoY to 2.4 billion. Monthly active platform customers grew 15% to 142 million. Adjusted EBITDA was $1.1 billion, up $576 million from the year-ago period. Uber generated $905 million in free cash flow and ended the quarter with $5.2 billion in cash and cash equivalents.
Forward guidance for Q4 2023
Uber expects Q4 2023 gross bookings of $36.5 billion to $37.5 billion. Uber expects Q4 2023 adjusted EBITDA in the range of $1.18 billion to $1.24 billion.
Uber CEO Dara Khosrowshahi commented, "Our relentless focus on improving the product experience for both consumers and drivers continued to power profitable growth, with trip growth accelerating to 25%. Uber's core business is stronger than ever as we enter the year's busiest period."
Uber Technologies analyst ratings and price targets are at MarketBeat. Uber Technologies peers and competitor stocks can be found with the MarketBeat stock screener.
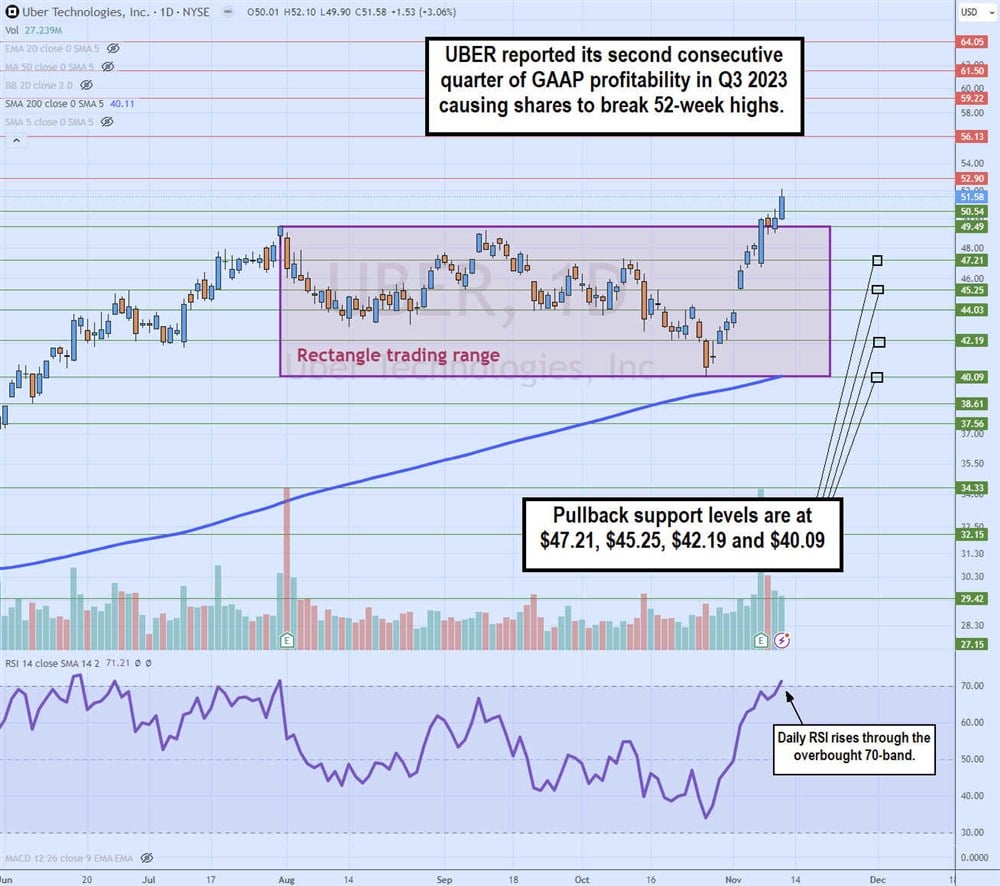
Daily rectangle breakout
The daily candlestick chart on Uber illustrates the daily rectangle breakout pattern. The rectangle trading range started after peaking at $49.49 on July 31, 2023, into its Q2 2023 earnings release. Shares fell to the lower range of the triangle, overlapping with the daily 200-period moving average at $ 40.09 on October 26, 2023. The Q3 2023 earnings release initially caused some profit-taking, but buyers swooped back in to drive shares through the upper trendline into the new 52-week high territory at $52.10. The daily relative strength index (RSI) ground through the overbought 70-band. Check out the sector heatmap on MarketBeat.
Lyft Inc. (NASDAQ: LYFT)
It's hard to believe that Lyft was a close second in the duopoly with Uber when the rideshare industry was in its infancy. Both companies waged a price war in a race to the bottom to see how to underprice their way to the larger network of drivers and passengers. Rumor has it that amidst all the regulatory scrutiny and scandals in 2016, Uber and Lyft were in merger talks, but the deal fell through. Uber has monopolized the game seven years later, as Lyft disappeared so far in the rearview mirror due to arrogance and mismanagement. It's hard to believe that Lyft had a higher stock price than Uber until just a year ago.
A new beginning and three new total company metrics
Lyft has a new CEO, David Risher, spearheading the turnaround effort. The company is making some progress in regaining some market share. They also introduced three new metrics, of which Gross Bookings is the key indicator that the old management reluctantly reported in its early earnings reports but left out shortly after. Gross bookings are the total dollar value of transactions invoiced to riders and Express Drive car rentals. Adjusted EBITDA margin is measured as a percentage of the Gross Bookings. Rides is the total number of rides used on its multimodal platform.
Q3 2023 improving metrics moving in the right direction.
On November 8, 2023, Lyft reported its Q3 2023 adjusted EPS of 24 cents, beating analyst estimates of 13 cents by 11 cents. Revenues rose 9.8% YoY to $1.16 billion, beating $1.14 billion analyst estimates. Adjusted EBITDA was $92 million vs. prior guidance of $75 million to $85 million. Total Rides rose 20% YoY to 187 million. This is a fraction of the 2.4 billion trips done by Uber in Q3 2023. Total bookings were $3.55 billion, about 1/10th of the $35.3 billion in bookings by Uber.
CEO Insights
CEO Risher stated that more drivers are choosing Lyft and driving more. He said, "In Q3, this resulted in an almost 45% year-over-year increase in the number of hours drivers spent using Lyft with not incentivize driver hours gone even faster." This could also mean Lyft was paying less to drivers, so they had to drive more to make the same money. However, the new CEO has made a concerted effort to focus on its drivers.
Women+ Connect service
The company launched Women+ Connect, which matches women riders with women drivers, making a big splash as more cities ask for the service. Lyft is accelerating the rollout to an additional 50 cities in the prior week and full nationwide availability by year's end.
Lyft Media in-app advertising
Lyft Media was launched in-app advertising, tailoring ads to where riders are heading. Risher pointed out, "So imagine you on the way to the movies and getting an ad that allows you to preorder your drinks and popcorn. Great experience means you are even ready to go by the time you get there. This is what's opening up conversations with partners like Universal Pictures. We want to help design and co-launch new ad products, including in-app video advertising, which will roll out this quarter." These impressive innovations will certainly add up to a cumulative effect in time.
Lyft analyst ratings and price targets are at MarketBeat.
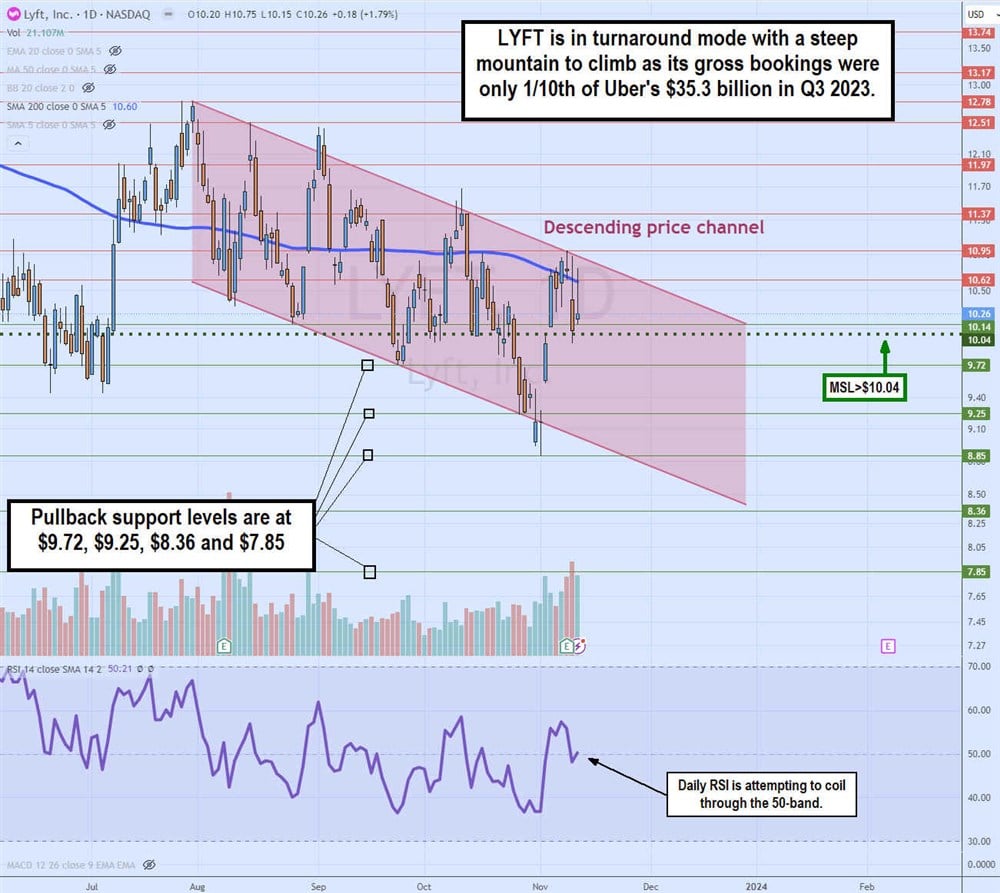
Daily descending price channel
The daily candlestick chart on LYFT depicts a descending price channel. The upper descending trendline formed after peaking at $12.78 on July 31, 2023. It moves parallel to the lower descending triangle, illustrating the lower highs and lower lows since July for LYFT shares. The daily MSL trigger sits at $10.04. The daily 200-period moving average continues to be a resistance at $10.60. The weekly RSI may be attempting to bounce at the 50-band. Pullback support levels are at $9.72, $9.25, $8.36 and $7.85.
Grab Holdings Inc. (NASDAQ: GRAB)
Grab is a Singapore ride-hailing multimodal, food delivery and digital payments platform. Users can access the services through its "super" "pp. The company is like the Uber of Southeast Asia, operating in eight countries and over 480 cities with over 214 million registered users and 12 million active users. 2018 Grab acquired Uber's Southeast Asian business in exchange for a 27.5% stake. Grab operates in Indonesia, Cambodia, Malaysia, Myanmar, Singapore, the Philippines, Thailand and Vietnam.
Grab services
SuperApp is how Grab describes its mobile app, which is understandable when listing all its services. Grab offers a multimodal ride-hailing including GrabCar (rideshare), GrabShare (shared ride), GrabBike (on-demand motorcycle service) and GrabFood (food delivery). GrabPay offers digital payments, enabling users to make cashless payments for Grab and other services. GrabMart is a grocery delivery service. GrabExpress is a package delivery service. GrabInsure offers insurance products like motor vehicles, travel and health insurance. GrabInvest lets users invest in stocks and financial products. GrabFin disperses loans.
Strong growth
On November 9, 2023, Grab reported a Q3 2023 EPS loss of 2 cents per share, missing estimates by 1 cent. Group adjusted EBITDA grew to $29 million, marking its first adjusted EBITDA profitable quarter. Revenues spiked 61% YoY to $615 million, beating $595 million consensus analyst estimates. Mobility and Deliveries gross merchandise value (GMV) rose 14% YoY. Deliveries grew to all-time highs in Q3, 2023, at $2.61 billion and expanded to 3.4% adjusted EBITDA margin.
Raised Outlook
Full-year 2023 Revenue and Group adjusted EBITDA outlook was raised to $2.31 billion and a loss of 20 million to $25 million, respectively. Grab CEO Anthony Tan commented, "So looking ahead, we are focused on driving the steady pace of adjusted EBITDA growth and generating resilient free cash flows. And we have -- and we will continue to focus on investing and developing hyper-local solutions that solve real problems in this region."
Grab Holdings analyst ratings and price targets are at MarketBeat.
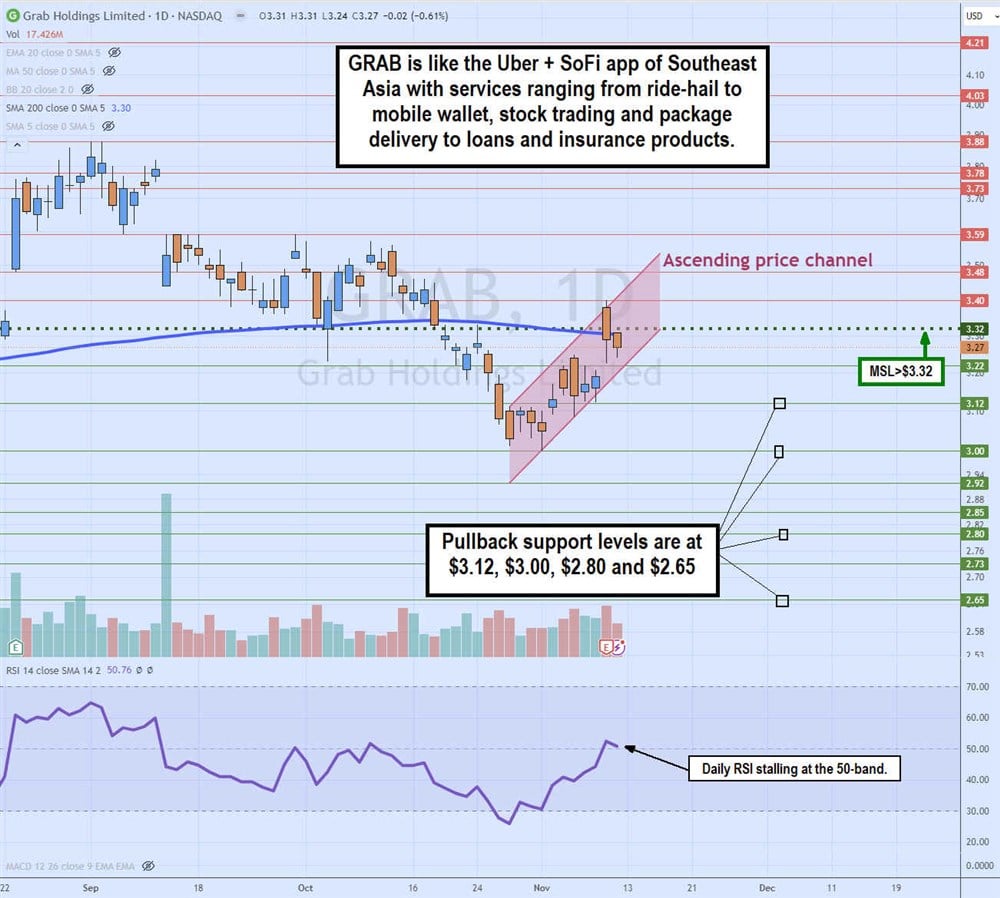
Daily ascending price channel
The daily candlestick chart on the GRAB illustrates an ascending price channel. The upper trendline commenced on October 27, 2023, making higher highs and lower. The daily MSL trigger overlaps with the daily 200-period moving average near $3.32. The daily RSI bounced and stalled near the 50-band. Pullback support levels are at $3.12, $3.00, $2.80 and $2.65.


