
Fluid and coating equipment company Graco (NYSE: GGG) missed Wall Street’s revenue expectations in Q2 CY2026 as sales rose 3.3% year on year to $590.6 million. Its GAAP profit of $0.87 per share was 6.8% above analysts’ consensus estimates.
Is now the time to buy Graco? Find out by accessing our full research report, it’s free.
Graco (GGG) Q2 CY2026 Highlights:
- Revenue: $590.6 million vs analyst estimates of $608.8 million (3.3% year-on-year growth, 3% miss)
- EPS (GAAP): $0.87 vs analyst estimates of $0.81 (6.8% beat)
- Operating Margin: 29.6%, up from 27.5% in the same quarter last year
- Free Cash Flow Margin: 27.3%, down from 28.5% in the same quarter last year
- Market Capitalization: $12.14 billion
Company Overview
Founded in 1926, Graco (NYSE: GGG) is an industrial company specializing in the development and manufacturing of fluid-handling systems and products.
Revenue Growth
A company’s long-term sales performance can indicate its overall quality. Any business can put up a good quarter or two, but many enduring ones grow for years. Over the last five years, Graco grew its sales at a sluggish 3.9% compounded annual growth rate. This fell short of our benchmark for the industrials sector and is a poor baseline for our analysis.
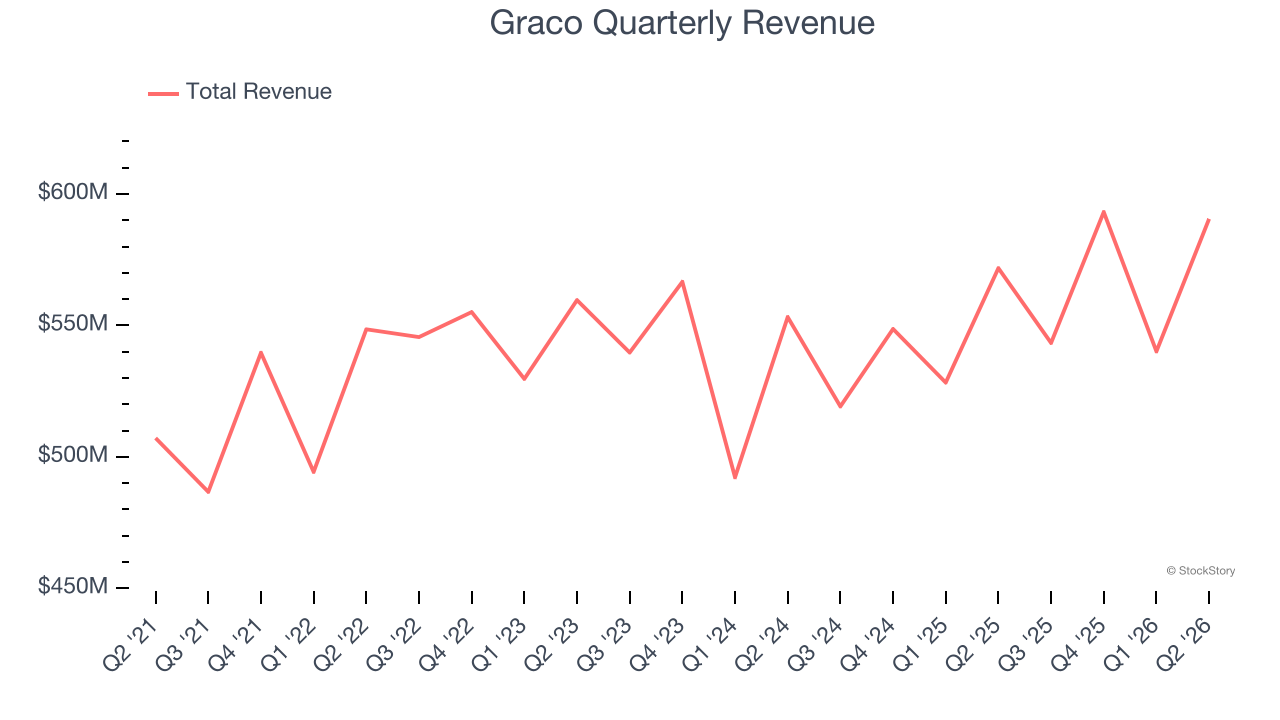
We at StockStory place the most emphasis on long-term growth, but within industrials, a half-decade historical view may miss cycles, industry trends, or a company capitalizing on catalysts such as a new contract win or a successful product line. Graco’s recent performance shows its demand has slowed as its annualized revenue growth of 2.6% over the last two years was below its five-year trend. We’re wary when companies in the sector see decelerations in revenue growth, as it could signal changing consumer tastes aided by low switching costs. 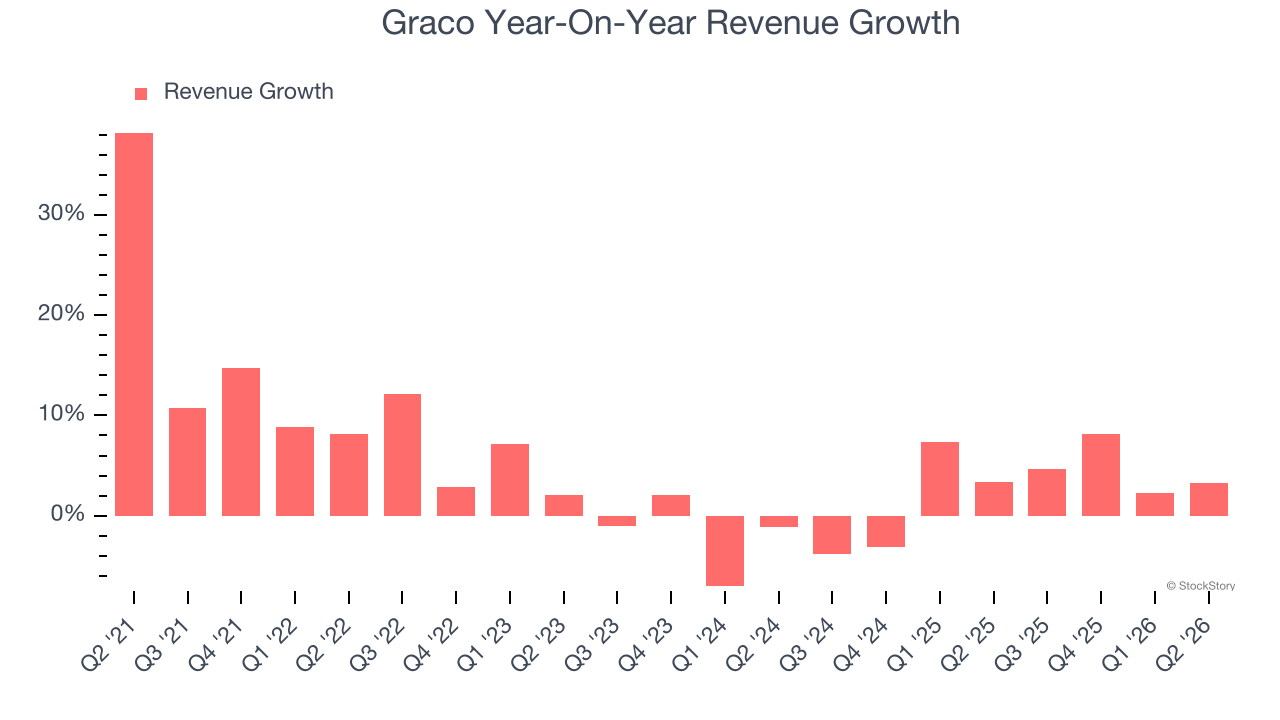
Graco also breaks out the revenue for its most important segments, Contractor and Process, which are 50.7% and 42.2% of revenue. Over the last two years, Graco’s Contractor revenue averaged 6.6% year-on-year growth while its Process revenue (pumps, valves, hoses) averaged 55.3% growth. 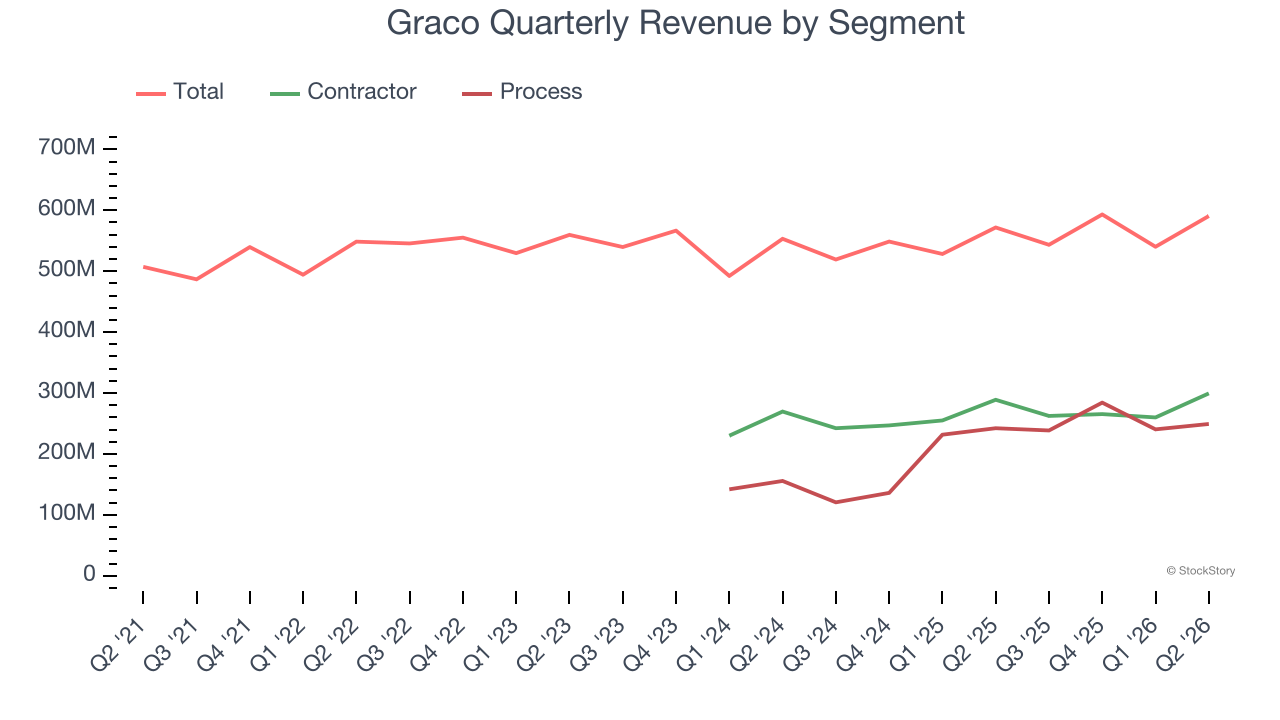
This quarter, Graco’s revenue grew by 3.3% year on year to $590.6 million, falling short of Wall Street’s estimates.
Looking ahead, sell-side analysts expect revenue to grow 7.1% over the next 12 months. Although this projection implies its newer products and services will catalyze better top-line performance, it is still below average for the sector.
ALSO WORTH WATCHING: Nvidia’s Quiet Partner. Nvidia’s chips cost a hundred grand. The connectors that make them work cost even more. One company makes them all.
Every AI server needs specialized infrastructure the chip companies don’t make. High-speed cables. Power connectors. Thermal sensors. This 90-year-old company built a monopoly on it. The AI boom just started. This stock is still flying under the radar. Claim The Stock Ticker Here for FREE.
Operating Margin
Graco has been a well-oiled machine over the last five years. It demonstrated elite profitability for an industrials business, boasting an average operating margin of 27.6%. This result isn’t surprising as its high gross margin gives it a favorable starting point.
Looking at the trend in its profitability, Graco’s operating margin rose by 1.7 percentage points over the last five years, as its sales growth gave it operating leverage.
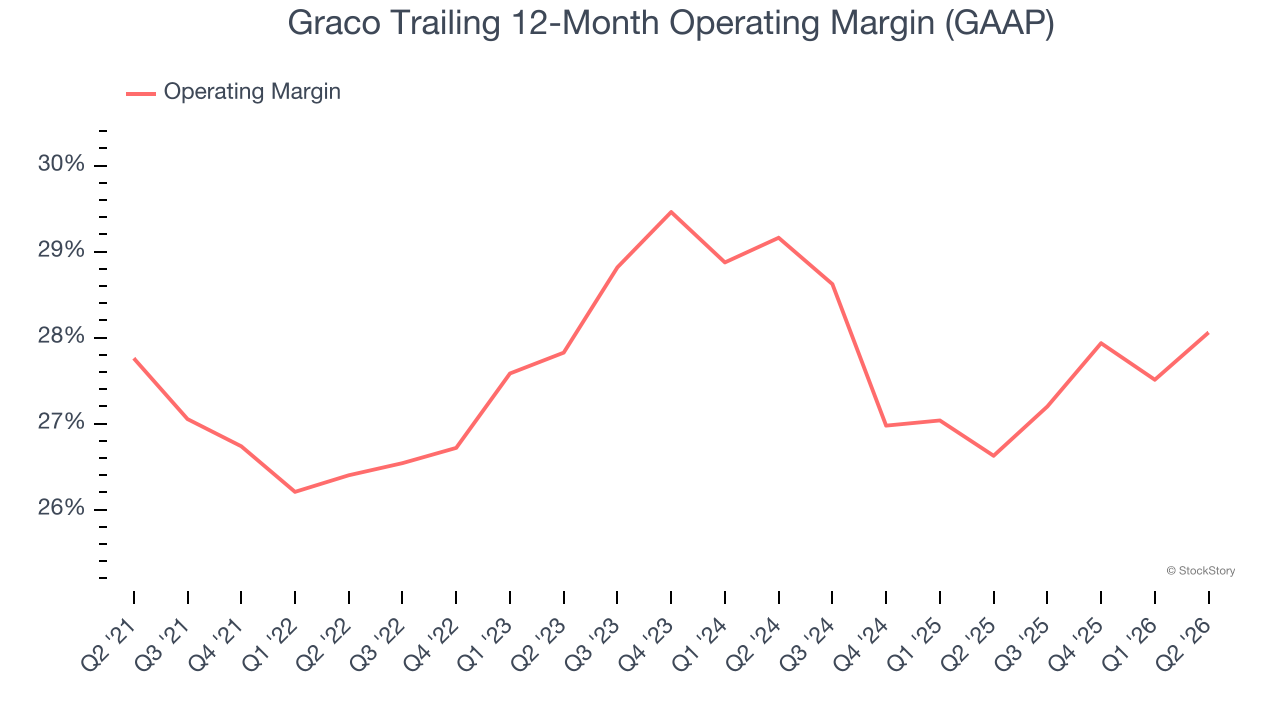
In Q2, Graco generated an operating margin profit margin of 29.6%, up 2.1 percentage points year on year. The increase was encouraging, and because its operating margin rose more than its gross margin, we can infer it was more efficient with expenses such as marketing, R&D, and administrative overhead.
Earnings Per Share
Revenue trends explain a company’s historical growth, but the long-term change in earnings per share (EPS) points to the profitability of that growth — for example, a company could inflate its sales through excessive spending on advertising and promotions.
Graco’s unimpressive 4.4% annual EPS growth over the last five years aligns with its revenue performance. On the bright side, this tells us its incremental sales were profitable.
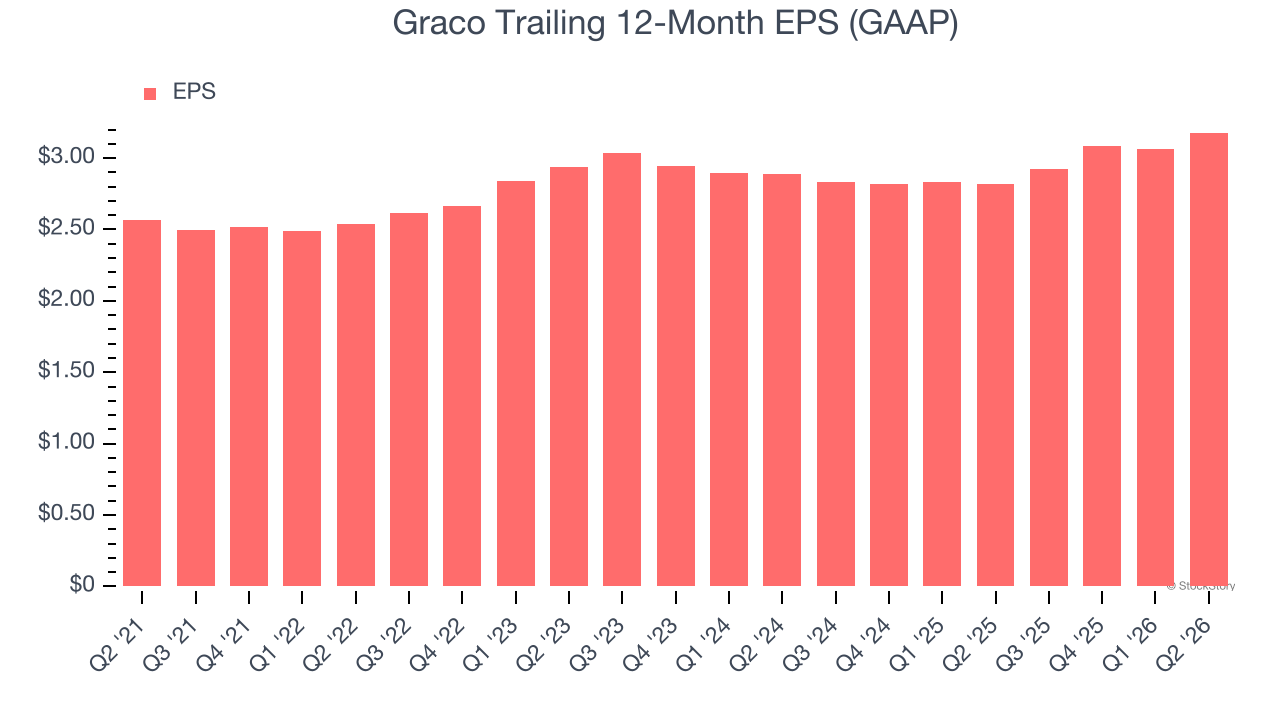
Like with revenue, we analyze EPS over a more recent period because it can provide insight into an emerging theme or development for the business.
Although it wasn’t great, Graco’s two-year annual EPS growth of 4.9% topped its 2.6% two-year revenue growth.
Diving into the nuances of Graco’s earnings can give us a better understanding of its performance. A two-year view shows that Graco has repurchased its stock, shrinking its share count by 3.9%. This tells us its EPS outperformed its revenue not because of increased operational efficiency but financial engineering, as buybacks boost per share earnings. 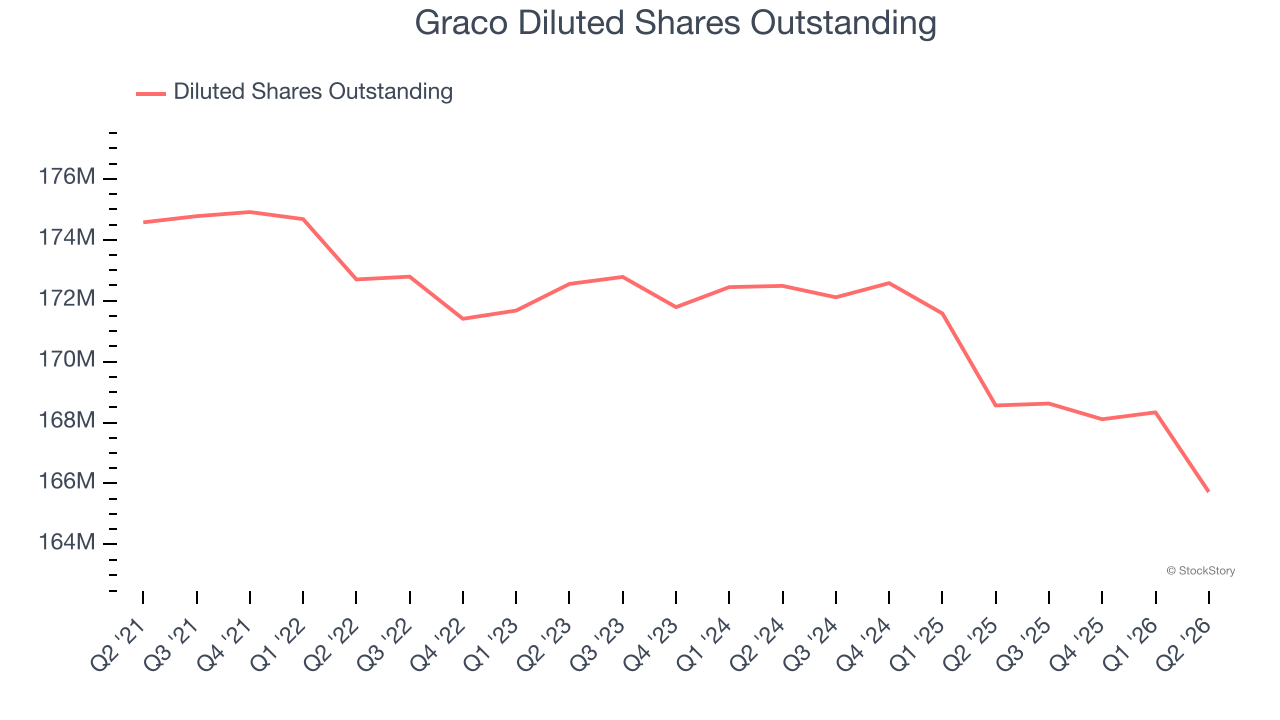
In Q2, Graco reported EPS of $0.87, up from $0.76 in the same quarter last year. This print beat analysts’ estimates by 6.8%. Over the next 12 months, Wall Street expects Graco’s full-year EPS to grow 4.7% from $3.18 to $3.33.
Key Takeaways from Graco’s Q2 Results
Although revenue missed, EPS beat analysts’ expectations this quarter. Overall, this was a mixed quarter. The stock traded up 4% to $76.89 immediately following the results.
Is Graco an attractive investment opportunity right now? We think that the latest quarter is only one piece of the longer-term business quality puzzle. Quality, when combined with valuation, can help determine if the stock is a buy. We cover that in our actionable full research report which you can read here (it’s free).