Industrial conglomerate 3M (NYSE: MMM) met Wall Street’s revenue expectations in Q1 CY2026, with sales up 4.3% year on year to $6.03 billion. Its non-GAAP profit of $2.14 per share was 7.9% above analysts’ consensus estimates.
Is now the time to buy 3M? Find out by accessing our full research report, it’s free.
3M (MMM) Q1 CY2026 Highlights:
- Revenue: $6.03 billion vs analyst estimates of $6.01 billion (4.3% year-on-year growth, in line)
- Adjusted EPS: $2.14 vs analyst estimates of $1.98 (7.9% beat)
- Adjusted Operating Income: $1.40 billion vs analyst estimates of $1.42 billion (23.2% margin, 1.3% miss)
- Management reiterated its full-year Adjusted EPS guidance of $8.60 at the midpoint
- Operating Margin: 23.2%, up from 21.6% in the same quarter last year
- Free Cash Flow Margin: 5.8%, down from 8.5% in the same quarter last year
- Organic Revenue rose 1.2% year on year (miss)
- Market Capitalization: $79.09 billion
Company Overview
Producers of the first asthma inhaler, 3M Company (NYSE: MMM) is a global conglomerate known for products in industries like healthcare, safety, electronics, and consumer goods.
Revenue Growth
A company’s long-term performance is an indicator of its overall quality. Any business can put up a good quarter or two, but many enduring ones grow for years. 3M struggled to consistently generate demand over the last five years as its sales dropped at a 5.5% annual rate. This wasn’t a great result and is a sign of poor business quality.
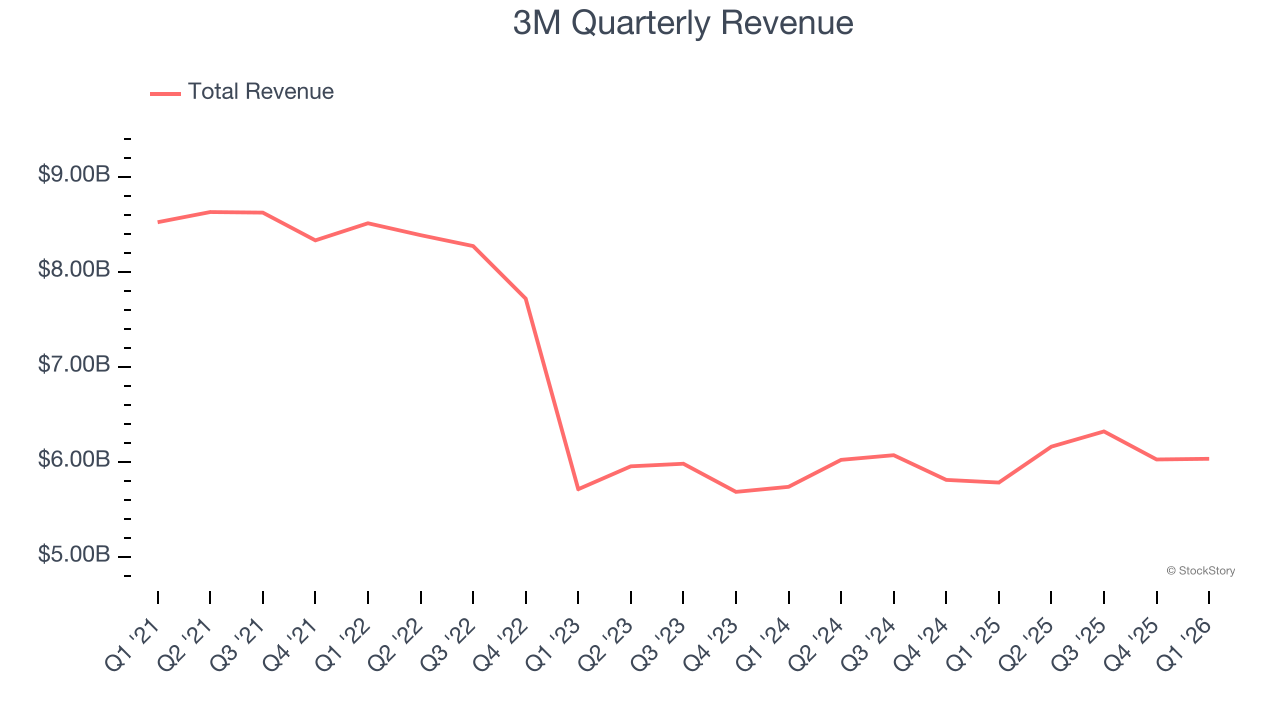
Long-term growth is the most important, but within industrials, a half-decade historical view may miss new industry trends or demand cycles. 3M’s annualized revenue growth of 2.5% over the last two years is above its five-year trend, which is encouraging. 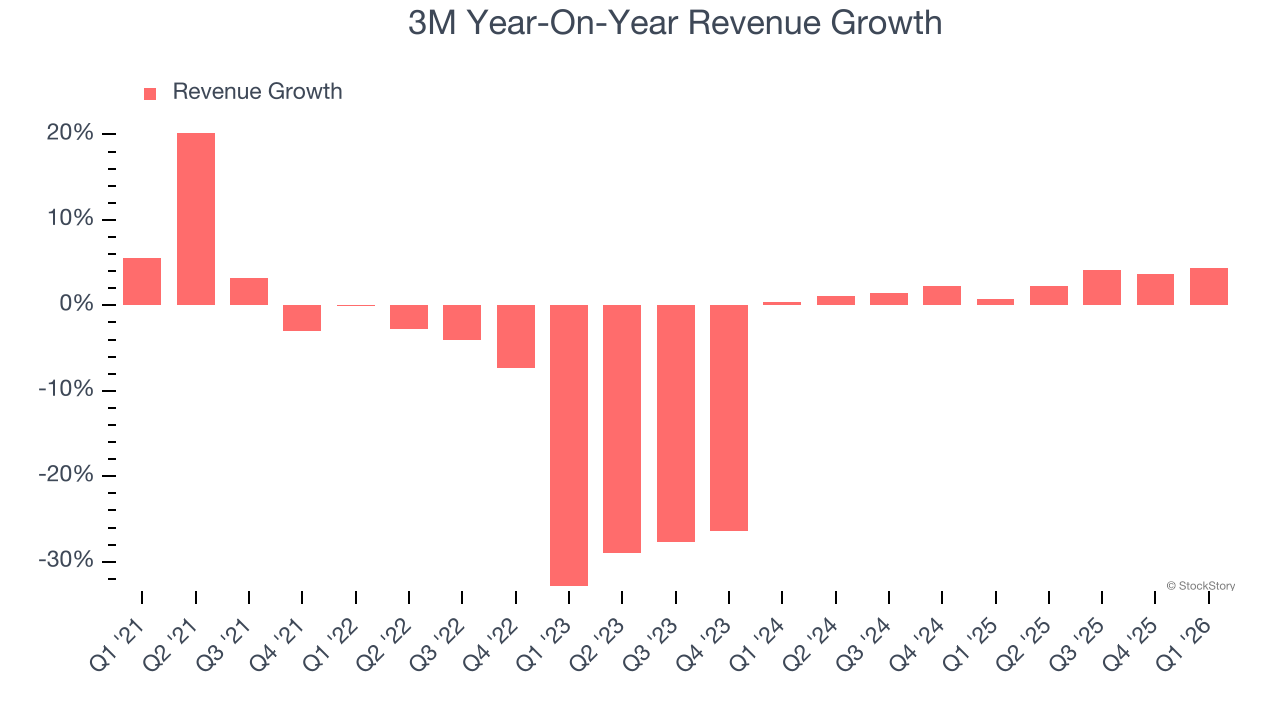
3M also reports organic revenue, which strips out one-time events like acquisitions and currency fluctuations that don’t accurately reflect its fundamentals. Over the last two years, 3M’s organic revenue averaged 1.4% year-on-year growth. Because this number aligns with its two-year revenue growth, we can see the company’s core operations (not acquisitions and divestitures) drove most of its results. 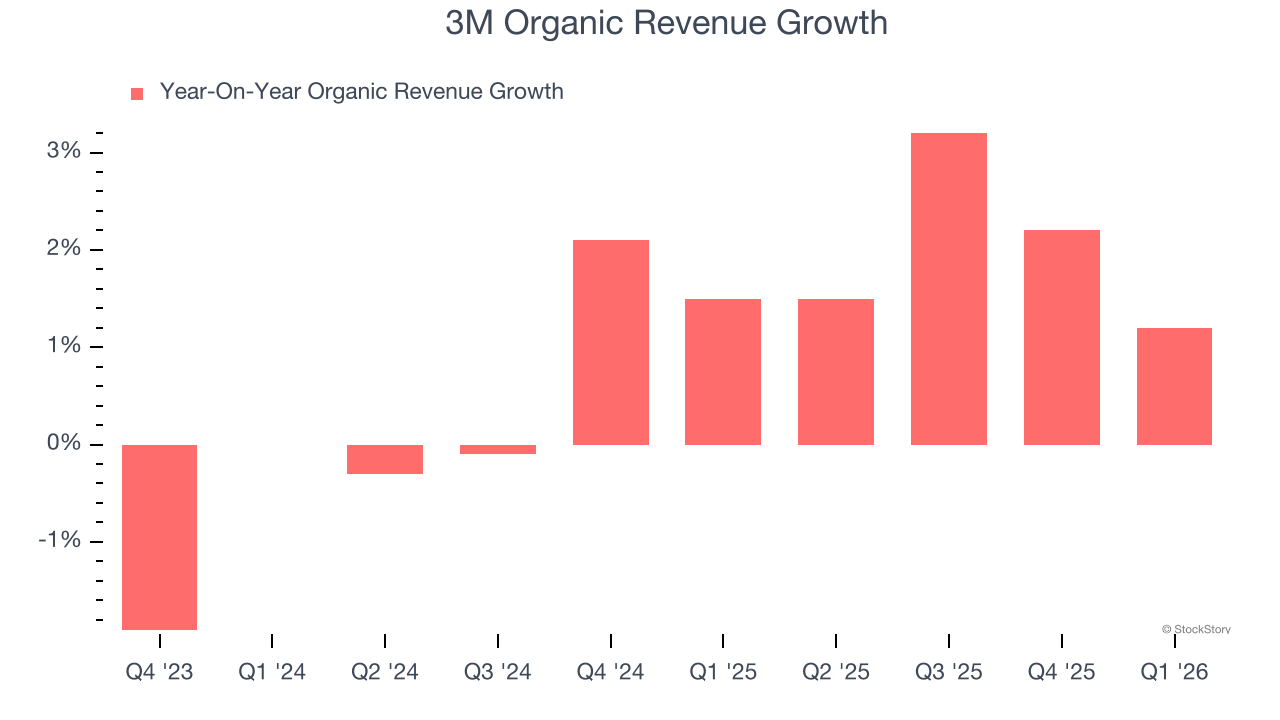
This quarter, 3M grew its revenue by 4.3% year on year, and its $6.03 billion of revenue was in line with Wall Street’s estimates.
Looking ahead, sell-side analysts expect revenue to grow 3% over the next 12 months, similar to its two-year rate. This projection is underwhelming and indicates its newer products and services will not lead to better top-line performance yet.
ALSO WORTH WATCHING: Nvidia’s Quiet Partner. Nvidia’s chips cost a hundred grand. The connectors that make them work cost even more. One company makes them all.
Every AI server needs specialized infrastructure the chip companies don’t make. High-speed cables. Power connectors. Thermal sensors. This 90-year-old company built a monopoly on it. The AI boom just started. This stock is still flying under the radar. Claim The Stock Ticker Here for FREE.
Operating Margin
Operating margin is one of the best measures of profitability because it tells us how much money a company takes home after procuring and manufacturing its products, marketing and selling those products, and most importantly, keeping them relevant through research and development.
3M has done a decent job managing its cost base over the last five years. The company has produced an average operating margin of 9.2%, higher than the broader industrials sector.
Looking at the trend in its profitability, 3M’s operating margin decreased by 1.1 percentage points over the last five years. Even though its historical margin was healthy, shareholders will want to see 3M become more profitable in the future.
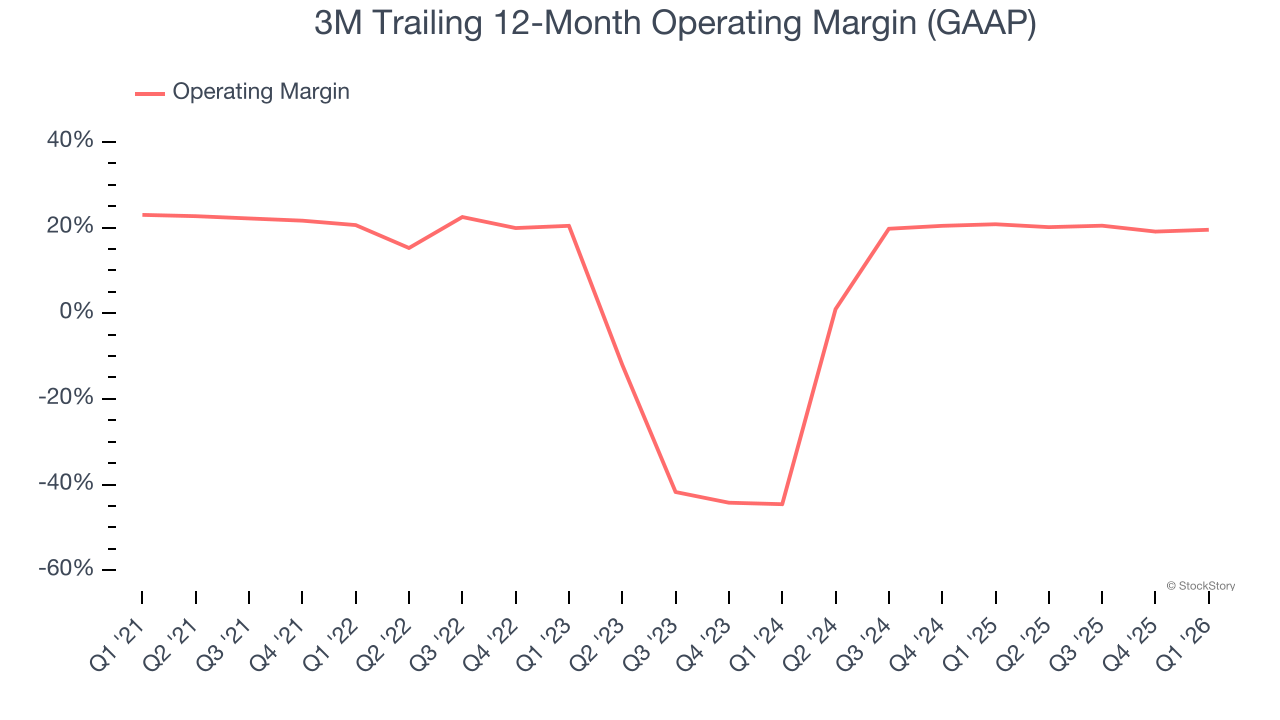
In Q1, 3M generated an operating margin profit margin of 23.2%, up 1.6 percentage points year on year. The increase was encouraging, and because its operating margin rose more than its gross margin, we can infer it was more efficient with expenses such as marketing, R&D, and administrative overhead.
Earnings Per Share
Revenue trends explain a company’s historical growth, but the long-term change in earnings per share (EPS) points to the profitability of that growth – for example, a company could inflate its sales through excessive spending on advertising and promotions.
Sadly for 3M, its EPS and revenue declined by 2.3% and 5.5% annually over the last five years. We tend to steer our readers away from companies with falling revenue and EPS, where diminishing earnings could imply changing secular trends and preferences. If the tide turns unexpectedly, 3M’s low margin of safety could leave its stock price susceptible to large downswings.
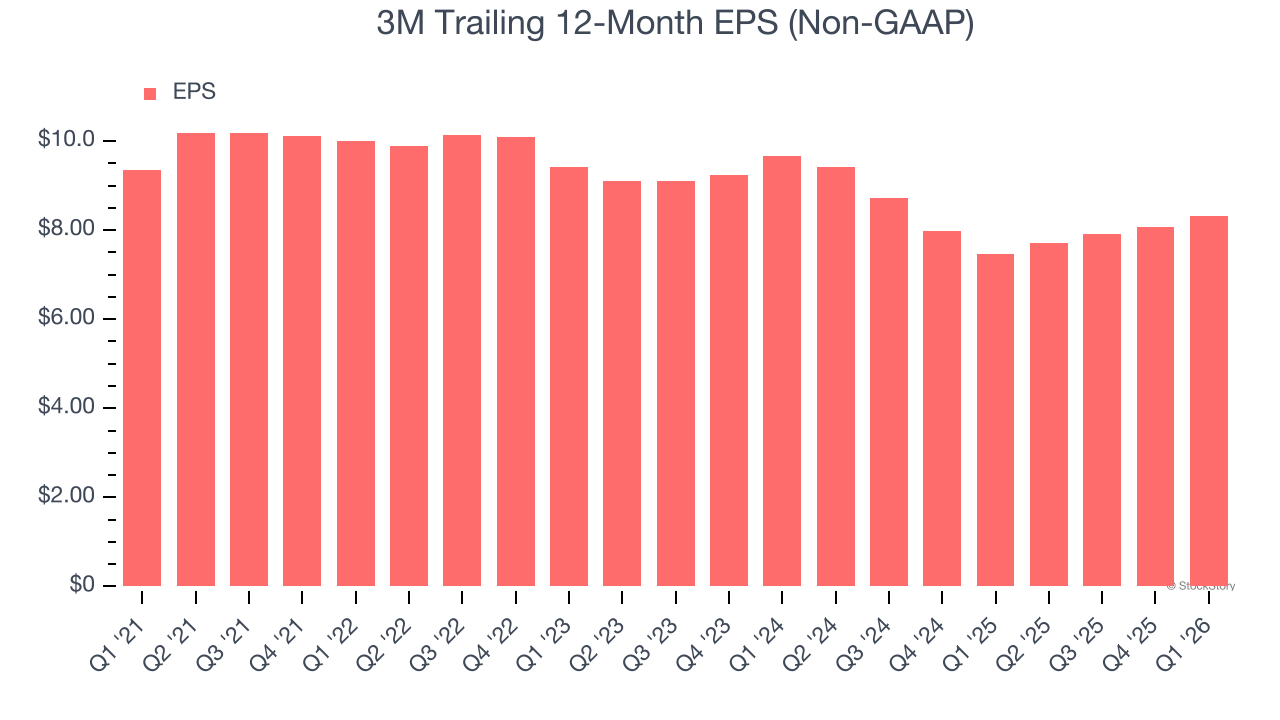
Like with revenue, we analyze EPS over a shorter period to see if we are missing a change in the business.
For 3M, its two-year annual EPS declines of 7.2% show it’s continued to underperform. These results were bad no matter how you slice the data.
In Q1, 3M reported adjusted EPS of $2.14, up from $1.88 in the same quarter last year. This print beat analysts’ estimates by 7.9%. Over the next 12 months, Wall Street expects 3M’s full-year EPS of $8.32 to grow 5%.
Key Takeaways from 3M’s Q1 Results
It was good to see 3M beat analysts’ EPS expectations this quarter. On the other hand, its organic revenue slightly missed and its adjusted operating income fell slightly short of Wall Street’s estimates. Overall, this was a softer quarter. The stock traded down 1.3% to $149.50 immediately following the results.
The latest quarter from 3M’s wasn’t that good. One earnings report doesn’t define a company’s quality, though, so let’s explore whether the stock is a buy at the current price. We think that the latest quarter is only one piece of the longer-term business quality puzzle. Quality, when combined with valuation, can help determine if the stock is a buy. We cover that in our actionable full research report which you can read here (it’s free).