
Security and aerospace company Northrop Grumman (NYSE: NOC) reported Q1 CY2026 results exceeding the market’s revenue expectations, with sales up 4.4% year on year to $9.88 billion. The company expects the full year’s revenue to be around $43.75 billion, close to analysts’ estimates. Its GAAP profit of $6.14 per share was 1% above analysts’ consensus estimates.
Is now the time to buy Northrop Grumman? Find out by accessing our full research report, it’s free.
Northrop Grumman (NOC) Q1 CY2026 Highlights:
- Revenue: $9.88 billion vs analyst estimates of $9.76 billion (4.4% year-on-year growth, 1.2% beat)
- EPS (GAAP): $6.14 vs analyst estimates of $6.08 (1% beat)
- Adjusted EBITDA: $1.38 billion vs analyst estimates of $1.39 billion (14% margin, in line)
- The company reconfirmed its revenue guidance for the full year of $43.75 billion at the midpoint
- Operating Margin: 10%, up from 6.1% in the same quarter last year
- Free Cash Flow was -$1.82 billion compared to -$1.82 billion in the same quarter last year
- Backlog: $95.61 billion at quarter end, up 3% year on year
- Organic Revenue rose 5% year on year (beat)
- Market Capitalization: $93.31 billion
Company Overview
Responsible for the development of the first stealth bomber, Northrop Grumman (NYSE: NOC) specializes in providing aerospace, defense, and security solutions for various industry applications.
Revenue Growth
A company’s long-term performance is an indicator of its overall quality. Any business can put up a good quarter or two, but the best consistently grow over the long haul. Over the last five years, Northrop Grumman grew its sales at a sluggish 2.6% compounded annual growth rate. This fell short of our benchmarks and is a tough starting point for our analysis.
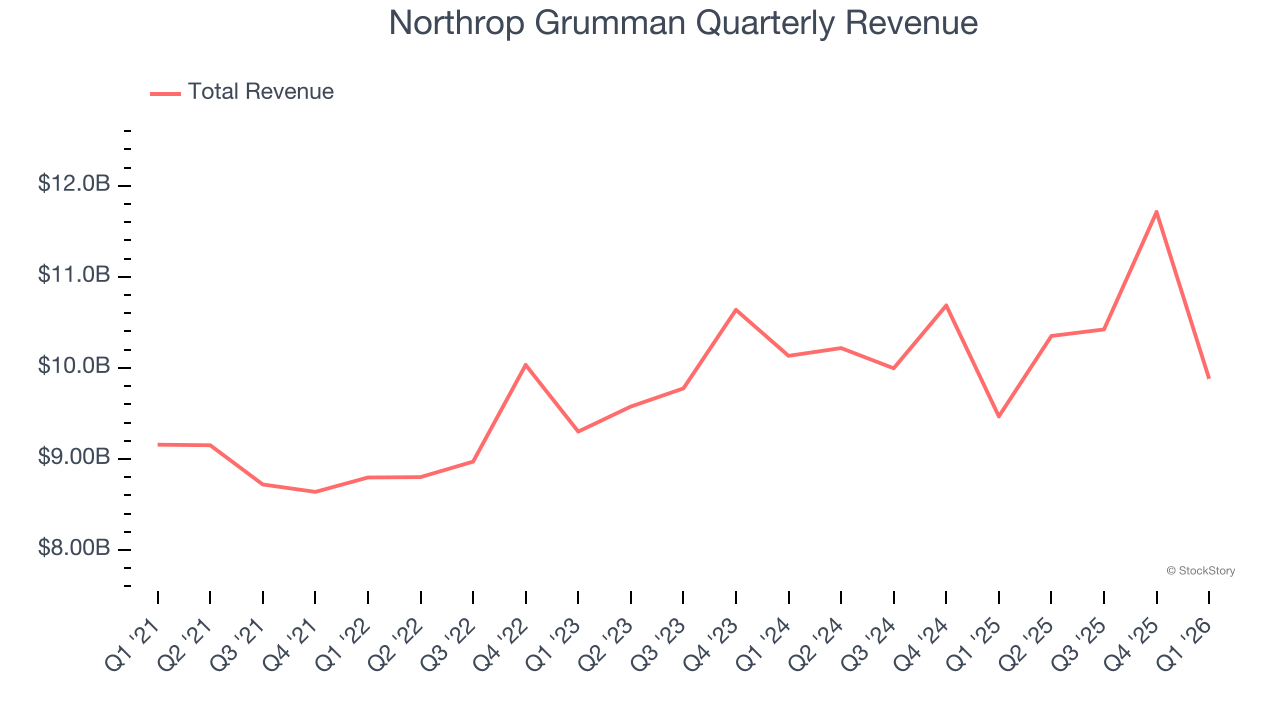
Long-term growth is the most important, but within industrials, a half-decade historical view may miss new industry trends or demand cycles. Northrop Grumman’s annualized revenue growth of 2.8% over the last two years aligns with its five-year trend, suggesting its demand was consistently weak. 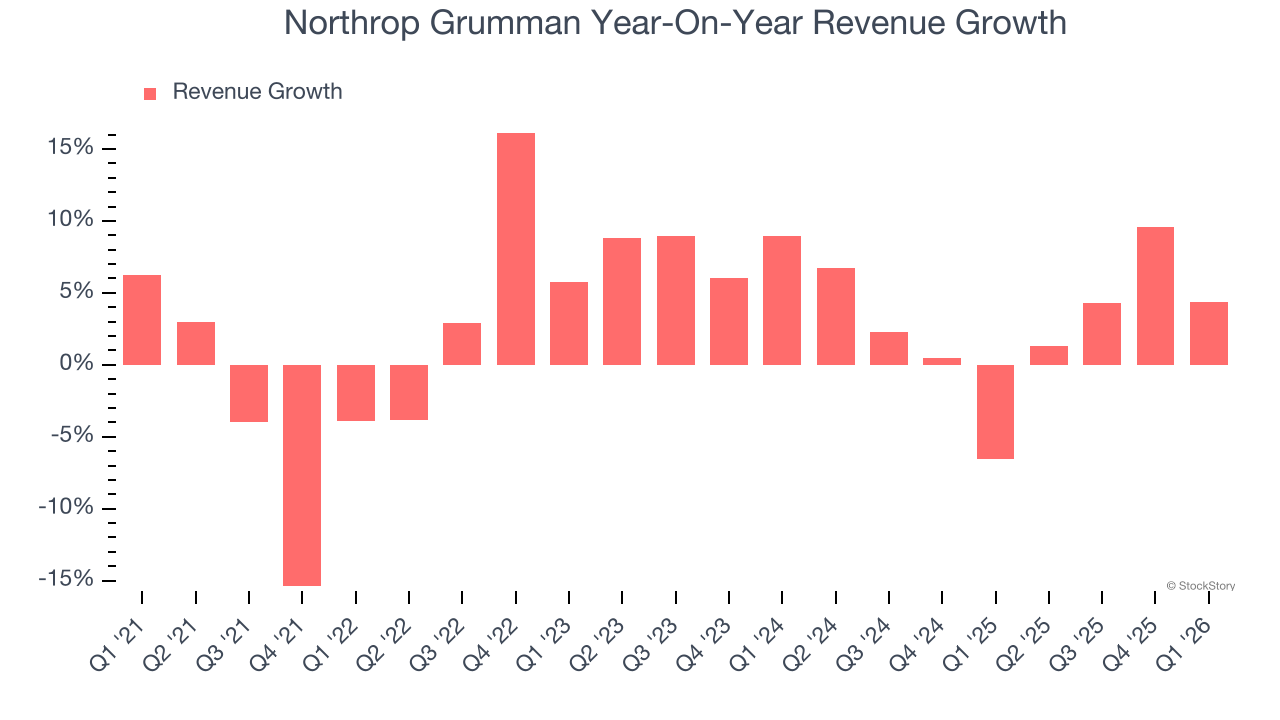
This quarter, Northrop Grumman reported modest year-on-year revenue growth of 4.4% but beat Wall Street’s estimates by 1.2%.
Looking ahead, sell-side analysts expect revenue to grow 5.3% over the next 12 months. Although this projection implies its newer products and services will fuel better top-line performance, it is still below average for the sector.
WHILE YOU’RE HERE: The Next Palantir? One satellite company captures images of every point on Earth. Every single day. The Pentagon wants it. Hedge funds are using it to beat earnings. You’ve probably never heard of it.
This is what the early days of Palantir looked like before it became a $437 billion giant. Same playbook. Different technology. If you missed Palantir, you need to see this. Claim The Stock Ticker for Free HERE.
Operating Margin
Northrop Grumman has done a decent job managing its cost base over the last five years. The company has produced an average operating margin of 9.6%, higher than the broader industrials sector.
Analyzing the trend in its profitability, Northrop Grumman’s operating margin rose by 1.1 percentage points over the last five years, as its sales growth gave it operating leverage.
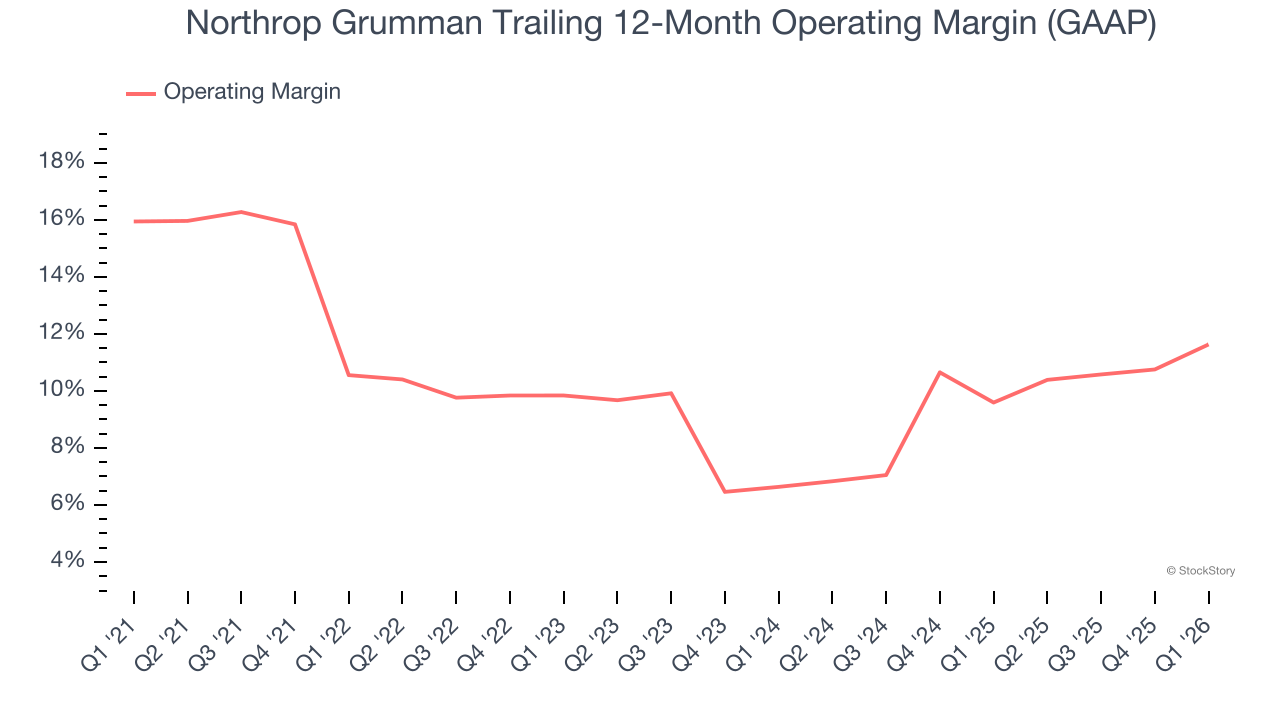
In Q1, Northrop Grumman generated an operating margin profit margin of 10%, up 4 percentage points year on year. This increase was a welcome development and shows it was more efficient.
Earnings Per Share
Revenue trends explain a company’s historical growth, but the long-term change in earnings per share (EPS) points to the profitability of that growth – for example, a company could inflate its sales through excessive spending on advertising and promotions.
Northrop Grumman’s weak 3.2% annual EPS growth over the last five years aligns with its revenue performance. On the bright side, this tells us its incremental sales were profitable.
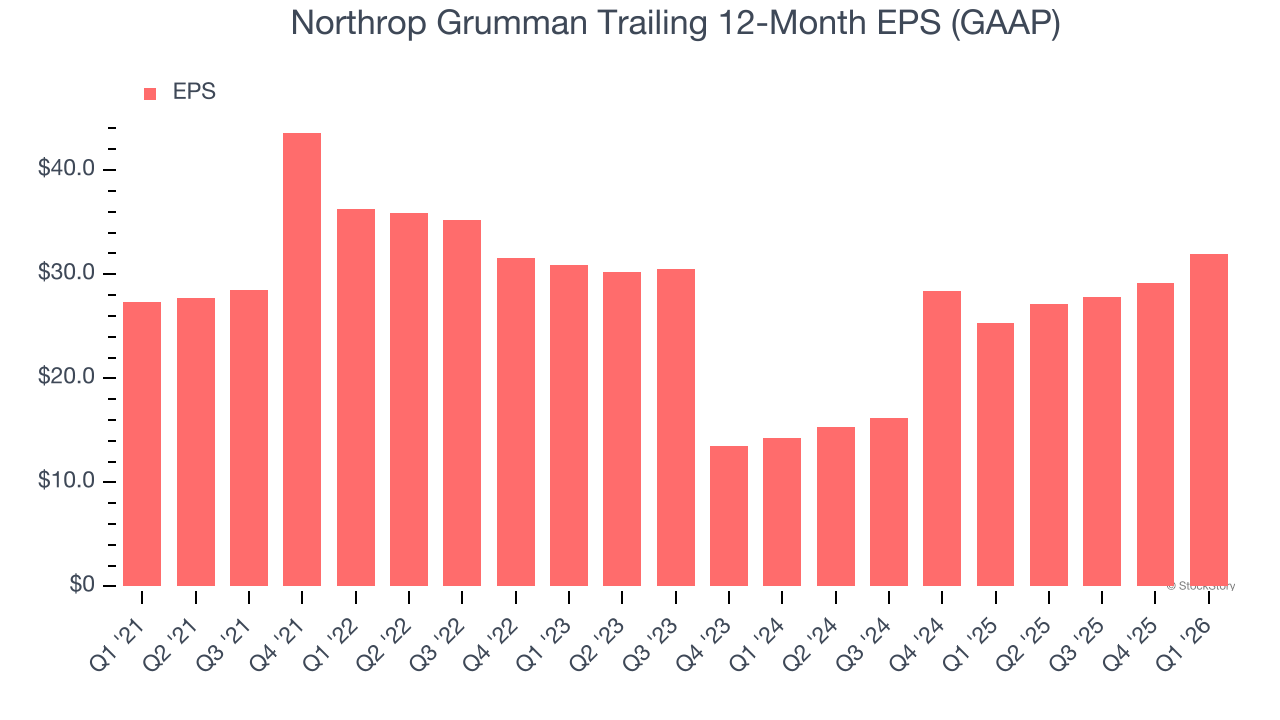
Like with revenue, we analyze EPS over a shorter period to see if we are missing a change in the business.
Northrop Grumman’s two-year annual EPS growth of 49.5% was fantastic and topped its 2.8% two-year revenue growth.
Diving into the nuances of Northrop Grumman’s earnings can give us a better understanding of its performance. A two-year view shows that Northrop Grumman has repurchased its stock, shrinking its share count by 4.6%. This tells us its EPS outperformed its revenue not because of increased operational efficiency but financial engineering, as buybacks boost per share earnings. 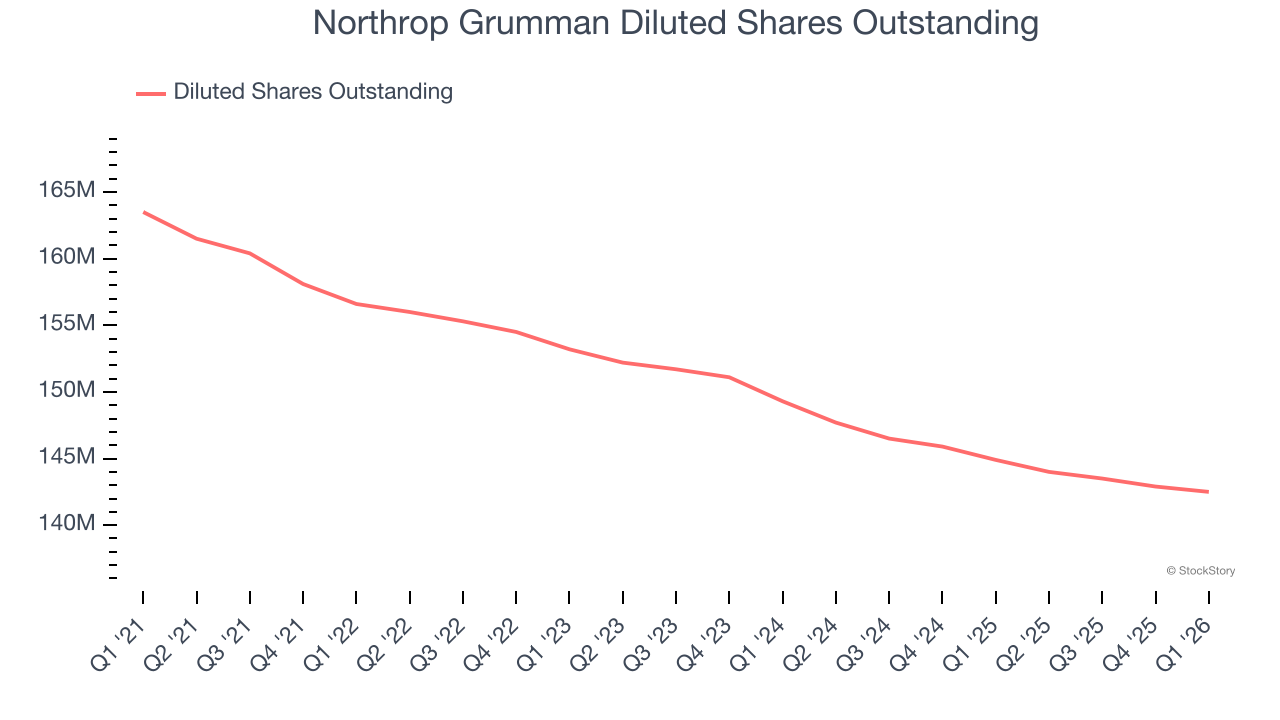
In Q1, Northrop Grumman reported EPS of $6.14, up from $3.32 in the same quarter last year. This print beat analysts’ estimates by 1.1%. Over the next 12 months, Wall Street expects Northrop Grumman’s full-year EPS of $31.94 to shrink by 10.8%.
Key Takeaways from Northrop Grumman’s Q1 Results
It was good to see Northrop Grumman narrowly top analysts’ organic revenue expectations this quarter. We were also happy its revenue narrowly outperformed Wall Street’s estimates. On the other hand, its adjusted operating income slightly missed and its full-year revenue guidance was in line with Wall Street’s estimates. Zooming out, we think this was a mixed quarter. The stock remained flat at $654.08 immediately after reporting.
Is Northrop Grumman an attractive investment opportunity at the current price? When making that decision, it’s important to consider its valuation, business qualities, as well as what has happened in the latest quarter. We cover that in our actionable full research report which you can read here (it’s free).