-- Revenues are $15.0 billion, an increase of 24% in U.S. dollars and 28% in local currency --
-- EPS are $2.54, a 14% increase from $2.23 for the second quarter last year, which included $0.21 in gains on an investment; excluding these gains, EPS are up 25% from adjusted EPS of $2.03 in the second quarter last year --
-- Operating income increases 25% to $2.06 billion, with operating margin of 13.7% --
-- Record new bookings of $19.6 billion are up 22% from the second quarter last year, with record bookings in both consulting and outsourcing of $10.9 billion and $8.7 billion, respectively --
-- Company declares quarterly cash dividend of $0.97 per share, up 10% from a year ago --
-- Accenture updates business outlook for fiscal 2022; raises range for full-year revenue growth to 24-26% in local currency; raises EPS to $10.61 to $10.81; updates operating margin expansion to 10 basis points; raises free cash flow to $8.0 billion to $8.5 billion; and raises cash returned to shareholders to at least $6.5 billion --
Accenture (NYSE: ACN) reported financial results for the second quarter of fiscal 2022, ended Feb. 28, 2022, with revenues of $15.0 billion, an increase of 24% in U.S. dollars and 28% in local currency over the same period last year.
This press release features multimedia. View the full release here: https://www.businesswire.com/news/home/20220317005194/en/
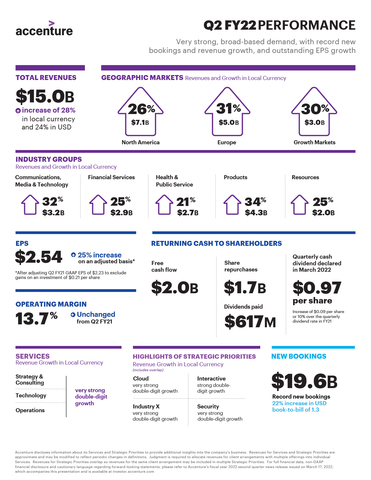
2QFY22 Earnings Infographic (Graphic: Business Wire)
Diluted earnings per share were $2.54, a 14% increase from $2.23 for the second quarter last year, which included $0.21 in gains on an investment. Excluding these gains, EPS increased 25% from adjusted EPS of $2.03 for the second quarter last year.
Operating income was $2.06 billion, a 25% increase over the same period last year, and operating margin was 13.7%, consistent with the second quarter last year.
New bookings for the quarter were a record $19.6 billion, with record bookings in both consulting and outsourcing of $10.9 billion and $8.7 billion, respectively.
Julie Sweet, Accenture’s Chair & CEO, said, “Our outstanding second-quarter financial performance demonstrates continued strong, broad-based demand across all our markets, services and industries. We continue to take significant market share as clients increasingly turn to Accenture as the partner uniquely positioned to help them navigate today’s accelerating pace of change. Our core strength is the diversity of our business that enables us to digitally transform across the enterprise through the depth and breadth of our services.
“At the same time, our clients also have access to talent at scale through our nearly 700,000 incredible people who deliver for them every day. The trust we have earned from our clients and partners, our continuous innovation and our ability to consistently attract the best people are directly linked to our commitment to creating 360° value for all our stakeholders — clients, people, partners, shareholders and communities.”
Financial Review
Revenues for the second quarter of fiscal 2022 were $15.05 billion, compared with $12.09 billion for the second quarter of fiscal 2021, an increase of 24% in U.S. dollars and 28% in local currency. Revenues were approximately $300 million above the top end of the company’s guided range of $14.30 billion to $14.75 billion. The foreign-exchange impact for the quarter was approximately negative 4%, consistent with the assumption provided in the company’s first-quarter earnings release.
- Consulting revenues for the quarter were $8.32 billion, an increase of 29% in U.S. dollars and 34% in local currency compared with the second quarter of fiscal 2021.
- Outsourcing revenues were $6.72 billion, an increase of 19% in U.S. dollars and 23% in local currency compared with the second quarter of fiscal 2021.
Diluted EPS for the quarter were $2.54, a 14% increase from $2.23, for the second quarter last year, which included pre-tax gains on an investment of $151 million, or $0.21 per share. Excluding these gains, EPS increased 25% from adjusted EPS of $2.03 for the second quarter of fiscal 2021. The $0.51 increase in EPS on an adjusted basis reflects:
- a $0.52 increase from higher revenue and operating results; and
- a $0.04 increase from lower non-operating expense;
partially offset by
- a $0.05 decrease from a higher effective tax rate.
Gross margin (gross profit as a percentage of revenues) for the quarter was 30.1%, compared with 29.7% for the second quarter last year. Selling, general and administrative (SG&A) expenses for the quarter were $2.46 billion, or 16.4% of revenues, compared with $1.94 billion, or 16.1% of revenues, for the second quarter last year.
Operating income for the quarter increased 25%, to $2.06 billion, or 13.7% of revenues, compared with $1.65 billion, or 13.7% of revenues, for the second quarter of fiscal 2021.
The company’s effective tax rate for the quarter was 19.2%, compared with 17.1% for the second quarter last year. Excluding the investment gains and the related tax expense of $19 million, the effective tax rate for the second quarter of fiscal 2021 was 17.5%.
Net income for the quarter was $1.66 billion, compared with $1.46 billion for the second quarter last year. Excluding after-tax investment gains of $133 million, net income for the second quarter of fiscal 2021 was $1.33 billion.
Operating cash flow for the quarter was $2.16 billion, and property and equipment additions were $165 million. Free cash flow, defined as operating cash flow net of property and equipment additions, was $1.99 billion. For the same period last year, operating cash flow was $2.53 billion; property and equipment additions were $93 million; and free cash flow was $2.44 billion.
Days services outstanding, or DSOs, were 41 days at Feb. 28, 2022, compared with 38 days at Aug. 31, 2021 and 34 days at Feb. 28, 2021.
Accenture’s total cash balance at Feb. 28, 2022 was $5.5 billion, compared with $8.2 billion at Aug. 31, 2021.
New Bookings
New bookings for the second quarter were a record $19.6 billion, an increase of 22% in U.S. dollars and 26% in local currency from the second quarter last year.
- Consulting new bookings were a record $10.9 billion, or 56% of total new bookings.
- Outsourcing new bookings were a record $8.7 billion, or 44% of total new bookings.
Revenues by Geographic Market
Revenues by geographic market were as follows:
- North America: $7.08 billion, an increase of 26% in both U.S. dollars and local currency compared with the second quarter of fiscal 2021.
- Europe: $5.01 billion, an increase of 24% in U.S. dollars and 31% in local currency compared with the second quarter of fiscal 2021.
- Growth Markets: $2.96 billion, an increase of 22% in U.S. dollars and 30% in local currency compared with the second quarter of fiscal 2021.
Revenues by Industry Group
Revenues by industry group were as follows:
- Communications, Media & Technology: $3.19 billion, an increase of 29% in U.S. dollars and 32% in local currency compared with the second quarter of fiscal 2021.
- Financial Services: $2.87 billion, an increase of 21% in U.S. dollars and 25% in local currency compared with the second quarter of fiscal 2021.
- Health & Public Service: $2.69 billion, an increase of 19% in U.S. dollars and 21% in local currency compared with the second quarter of fiscal 2021.
- Products: $4.33 billion, an increase of 30% in U.S. dollars and 34% in local currency compared with the second quarter of fiscal 2021.
- Resources: $1.97 billion, an increase of 21% in U.S. dollars and 25% in local currency compared with the second quarter of fiscal 2021.
Returning Cash to Shareholders
Accenture continues to return cash to shareholders through cash dividends and share repurchases.
Dividend
On Feb. 15, 2022, a quarterly cash dividend of $0.97 per share was paid to shareholders of record at the close of business on Jan. 13, 2022. These cash dividend payments totaled $617 million, bringing dividend payments for the year to date to $1.23 billion.
Accenture plc has declared another quarterly cash dividend of $0.97 per share for shareholders of record at the close of business on April 14, 2022. This dividend, which is payable on May 13, represents a 10% increase over the quarterly dividend rate of $0.88 per share in fiscal 2021.
Share Repurchase Activity
During the second quarter of fiscal 2022, Accenture repurchased or redeemed 4.6 million shares for a total of $1.69 billion, including approximately 2.9 million shares repurchased in the open market. This brings Accenture’s total share repurchases and redemptions for the first half of fiscal 2022 to 7.0 million shares for a total of $2.54 billion, including approximately 4.8 million shares repurchased in the open market.
Accenture’s total remaining share repurchase authority at Feb. 28, 2022 was approximately $4.6 billion.
At Feb. 28, 2022, Accenture had approximately 634 million total shares outstanding.
Business Outlook
The invasion of Ukraine by Russia and the sanctions and other measures being imposed in response to this conflict have increased the level of economic and political uncertainty. Accenture’s third-quarter and full-year 2022 business outlook does not include assumptions for a significant escalation or expansion of economic disruption or the conflict’s current scope, which could have a material adverse effect on the company’s results of operations.
Third Quarter Fiscal 2022
Accenture expects revenues for the third quarter of fiscal 2022 to be in the range of $15.70 billion to $16.15 billion, an increase of 22% to 26% in local currency, reflecting the company’s assumption of a negative 4% foreign-exchange impact compared with the third quarter of fiscal 2021.
Fiscal Year 2022
Accenture’s business outlook for the full 2022 fiscal year continues to assume that the foreign-exchange impact on its results in U.S. dollars will be approximately negative 3% compared with fiscal 2021.
For fiscal 2022, the company now expects revenue growth to be in the range of 24% to 26% in local currency, compared with 19% to 22% previously.
Accenture now expects operating margin for the full fiscal year to be 15.2%, an expansion of 10 basis points from fiscal 2021. The company previously expected operating margin to expand 10 to 30 basis points.
The company continues to expect its annual effective tax rate to be in the range of 23.0% to 25.0%.
The company now expects diluted EPS to be in the range of $10.61 to $10.81, an increase of 21% to 23% over adjusted FY21 diluted EPS of $8.80 — which exclude gains on an investment of $0.36 from FY21 GAAP diluted EPS of $9.16. The company previously expected fiscal 2022 diluted EPS to be in the range of $10.32 to $10.60.
For fiscal 2022, the company now expects operating cash flow to be in the range of $8.7 billion to $9.2 billion, compared with $8.4 billion to $8.9 billion previously; continues to expect property and equipment additions to be $700 million; and now expects free cash flow to be in the range of $8.0 billion to $8.5 billion, compared with $7.7 billion to $8.2 billion previously.
The company now expects to return at least $6.5 billion in cash to shareholders through dividends and share repurchases, compared with at least $6.3 billion previously.
360° Value Reporting
Accenture’s goal is to create 360° value for our clients, people, shareholders, partners, and communities. To enhance transparency and provide a comprehensive view for all stakeholders, we have combined our financial and environmental, social and governance (ESG) reporting into a digital-first experience. To access our goals, progress and performance, please visit the Accenture 360° Value Reporting Experience (Accenture.com/reportingexperience).
Conference Call and Webcast Details
Accenture will host a conference call at 8:00 a.m. EDT today to discuss its second-quarter financial results. To participate, please dial +1 (877) 692-8955 [+1 (234) 720-6979 outside the United States, Puerto Rico and Canada] and enter access code 6450548 approximately 15 minutes before the scheduled start of the call. The conference call will also be accessible live on the Investor Relations section of the Accenture Web site at accenture.com.
A replay of the conference call will be available online at accenture.com beginning at 11:00 a.m. EDT today, March 17, and continuing through Wednesday, June 22, 2022. The replay will also be available via telephone by dialing +1 (866) 207-1041 [+1 (402) 970-0847 outside the United States, Puerto Rico and Canada] and entering access code 6300496 from 11:00 a.m. EDT today, March 17, through Wednesday, June 22, 2022.
About Accenture
Accenture is a global professional services company with leading capabilities in digital, cloud and security. Combining unmatched experience and specialized skills across more than 40 industries, we offer Strategy and Consulting, Interactive, Technology and Operations services — all powered by the world’s largest network of Advanced Technology and Intelligent Operations centers. Our 699,000 people deliver on the promise of technology and human ingenuity every day, serving clients in more than 120 countries. We embrace the power of change to create value and shared success for our clients, people, shareholders, partners and communities. Visit us at accenture.com.
Non-GAAP Financial Information
This news release includes certain non-GAAP financial information as defined by Securities and Exchange Commission Regulation G. Pursuant to the requirements of this regulation, reconciliations of this non-GAAP financial information to Accenture’s financial statements as prepared under generally accepted accounting principles (GAAP) are included in this press release. Financial results “in local currency” are calculated by restating current-period activity into U.S. dollars using the comparable prior-year period’s foreign-currency exchange rates. Accenture’s management believes providing investors with this information gives additional insights into Accenture’s results of operations. While Accenture’s management believes that the non-GAAP financial measures herein are useful in evaluating Accenture’s operations, this information should be considered as supplemental in nature and not as a substitute for the related financial information prepared in accordance with GAAP. Accenture provides full-year revenue guidance on a local-currency basis and not in U.S. dollars because the impact of foreign exchange rate fluctuations could vary significantly from the company’s stated assumptions.
Forward-Looking Statements
Except for the historical information and discussions contained herein, statements in this news release may constitute forward-looking statements within the meaning of the Private Securities Litigation Reform Act of 1995. Words such as “may,” “will,” “should,” “likely,” “anticipates,” “expects,” “intends,” “plans,” “projects,” “believes,” “estimates,” “positioned,” “outlook” and similar expressions are used to identify these forward-looking statements. These statements involve a number of risks, uncertainties and other factors that could cause actual results to differ materially from those expressed or implied. Many of the following risks, uncertainties and other factors identified below may be amplified by the invasion of Ukraine by Russia, the sanctions (including their duration), and other measures being imposed in response to this conflict, as well as any escalation or expansion of economic disruption or the conflict’s current scope. These risks include, without limitation, risks that: Accenture’s results of operations have been, and may in the future be, adversely affected by volatile, negative or uncertain economic and political conditions and the effects of these conditions on the company’s clients’ businesses and levels of business activity; Accenture faces legal, reputational and financial risks from any failure to protect client and/or company data from security incidents or cyberattacks; Accenture’s business depends on generating and maintaining ongoing, profitable client demand for the company’s services and solutions including through the adaptation and expansion of its services and solutions in response to ongoing changes in technology and offerings, and a significant reduction in such demand or an inability to respond to the evolving technological environment could materially affect the company’s results of operations; if Accenture is unable to match people and skills with client demand around the world and attract and retain professionals with strong leadership skills, the company’s business, the utilization rate of the company’s professionals and the company’s results of operations may be materially adversely affected; the COVID-19 pandemic has impacted Accenture’s business and operations, and the extent to which it will continue to do so and its impact on the company’s future financial results are uncertain; the markets in which Accenture operates are highly competitive, and Accenture might not be able to compete effectively; Accenture’s ability to attract and retain business and employees may depend on its reputation in the marketplace; if Accenture does not successfully manage and develop its relationships with key alliance partners or fails to anticipate and establish new alliances in new technologies, the company’s results of operations could be adversely affected; Accenture’s profitability could materially suffer if the company is unable to obtain favorable pricing for its services and solutions, if the company is unable to remain competitive, if its cost-management strategies are unsuccessful or if it experiences delivery inefficiencies or fail to satisfy certain agreed-upon targets or specific service levels; changes in Accenture’s level of taxes, as well as audits, investigations and tax proceedings, or changes in tax laws or in their interpretation or enforcement, could have a material adverse effect on the company’s effective tax rate, results of operations, cash flows and financial condition; Accenture’s results of operations could be materially adversely affected by fluctuations in foreign currency exchange rates; changes to accounting standards or in the estimates and assumptions Accenture makes in connection with the preparation of its consolidated financial statements could adversely affect its financial results; Accenture might be unable to access additional capital on favorable terms or at all and if the company raises equity capital, it may dilute its shareholders’ ownership interest in the company; as a result of Accenture’s geographically diverse operations and its growth strategy to continue to expand in its key markets around the world, the company is more susceptible to certain risks; if Accenture is unable to manage the organizational challenges associated with its size, the company might be unable to achieve its business objectives; Accenture might not be successful at acquiring, investing in or integrating businesses, entering into joint ventures or divesting businesses; Accenture’s business could be materially adversely affected if the company incurs legal liability; Accenture’s global operations expose the company to numerous and sometimes conflicting legal and regulatory requirements; Accenture’s work with government clients exposes the company to additional risks inherent in the government contracting environment; if Accenture is unable to protect or enforce its intellectual property rights or if Accenture’s services or solutions infringe upon the intellectual property rights of others or the company loses its ability to utilize the intellectual property of others, its business could be adversely affected; Accenture’s results of operations and share price could be adversely affected if it is unable to maintain effective internal controls; Accenture may be subject to criticism and negative publicity related to its incorporation in Ireland; as well as the risks, uncertainties and other factors discussed under the “Risk Factors” heading in Accenture plc’s most recent Annual Report on Form 10-K and other documents filed with or furnished to the Securities and Exchange Commission. Statements in this news release speak only as of the date they were made, and Accenture undertakes no duty to update any forward-looking statements made in this news release or to conform such statements to actual results or changes in Accenture’s expectations.
Accenture plc Consolidated Income Statements (In thousands of U.S. dollars, except share and per share amounts) (Unaudited) |
||||||||||||||||||||
|
|
Three Months Ended |
|
Six Months Ended |
||||||||||||||||
|
|
February 28,
|
|
% of Revenues |
|
February 28,
|
|
% of Revenues |
|
February 28,
|
|
% of Revenues |
|
February 28,
|
|
% of Revenues |
||||
REVENUES: |
|
|
|
|
|
|
|
|
|
|
|
|
|
|
|
|
||||
Revenues |
|
$ |
15,046,693 |
|
100.0 % |
|
$ |
12,088,125 |
|
100.0 % |
|
$ |
30,011,846 |
|
100.0 % |
|
$ |
23,850,310 |
|
100.0 % |
OPERATING EXPENSES: |
|
|
|
|
|
|
|
|
|
|
|
|
|
|
|
|
||||
Cost of services |
|
|
10,522,734 |
|
69.9 % |
|
|
8,492,893 |
|
70.3 % |
|
|
20,571,098 |
|
68.5 % |
|
|
16,356,782 |
|
68.6 % |
Sales and marketing |
|
|
1,414,814 |
|
9.4 % |
|
|
1,139,486 |
|
9.4 % |
|
|
2,869,239 |
|
9.6 % |
|
|
2,366,662 |
|
9.9 % |
General and administrative costs |
|
|
1,047,565 |
|
7.0 % |
|
|
802,231 |
|
6.6 % |
|
|
2,075,635 |
|
6.9 % |
|
|
1,582,682 |
|
6.6 % |
Total operating expenses |
|
|
12,985,113 |
|
|
|
|
10,434,610 |
|
|
|
|
25,515,972 |
|
|
|
|
20,306,126 |
|
|
OPERATING INCOME |
|
|
2,061,580 |
|
13.7 % |
|
|
1,653,515 |
|
13.7 % |
|
|
4,495,874 |
|
15.0 % |
|
|
3,544,184 |
|
14.9 % |
Interest income |
|
|
7,269 |
|
|
|
|
8,407 |
|
|
|
|
13,319 |
|
|
|
|
19,092 |
|
|
Interest expense |
|
|
(11,216) |
|
|
|
|
(8,922) |
|
|
|
|
(22,399) |
|
|
|
|
(17,776) |
|
|
Other income (expense), net |
|
|
(7,183) |
|
|
|
|
109,443 |
|
|
|
|
(30,212) |
|
|
|
|
203,810 |
|
|
INCOME BEFORE INCOME TAXES |
|
|
2,050,450 |
|
13.6 % |
|
|
1,762,443 |
|
14.6 % |
|
|
4,456,582 |
|
14.8 % |
|
|
3,749,310 |
|
15.7 % |
Income tax expense |
|
|
392,921 |
|
|
|
|
300,950 |
|
|
|
|
979,323 |
|
|
|
|
765,760 |
|
|
NET INCOME |
|
|
1,657,529 |
|
11.0 % |
|
|
1,461,493 |
|
12.1 % |
|
|
3,477,259 |
|
11.6 % |
|
|
2,983,550 |
|
12.5 % |
Net income attributable to noncontrolling interest in Accenture Canada Holdings Inc. |
|
|
(1,742) |
|
|
|
|
(1,602) |
|
|
|
|
(3,676) |
|
|
|
|
(3,302) |
|
|
Net income attributable to noncontrolling interests – other (1) |
|
|
(20,845) |
|
|
|
|
(19,032) |
|
|
|
|
(47,617) |
|
|
|
|
(39,113) |
|
|
NET INCOME ATTRIBUTABLE TO ACCENTURE PLC |
|
$ |
1,634,942 |
|
10.9 % |
|
$ |
1,440,859 |
|
11.9 % |
|
$ |
3,425,966 |
|
11.4 % |
|
$ |
2,941,135 |
|
12.3 % |
CALCULATION OF EARNINGS PER SHARE: |
|
|
|
|
|
|
|
|
|
|
|
|
|
|
|
|
||||
Net income attributable to Accenture plc |
|
$ |
1,634,942 |
|
|
|
$ |
1,440,859 |
|
|
|
$ |
3,425,966 |
|
|
|
$ |
2,941,135 |
|
|
Net income attributable to noncontrolling interest in Accenture Canada Holdings Inc. (2) |
|
|
1,742 |
|
|
|
|
1,602 |
|
|
|
|
3,676 |
|
|
|
|
3,302 |
|
|
Net income for diluted earnings per share calculation |
|
$ |
1,636,684 |
|
|
|
$ |
1,442,461 |
|
|
|
$ |
3,429,642 |
|
|
|
$ |
2,944,437 |
|
|
EARNINGS PER SHARE: |
|
|
|
|
|
|
|
|
|
|
|
|
|
|
|
|
||||
Basic |
|
$ |
2.58 |
|
|
|
$ |
2.27 |
|
|
|
$ |
5.41 |
|
|
|
$ |
4.63 |
|
|
Diluted |
|
$ |
2.54 |
|
|
|
$ |
2.23 |
|
|
|
$ |
5.32 |
|
|
|
$ |
4.55 |
|
|
WEIGHTED AVERAGE SHARES: |
|
|
|
|
|
|
|
|
|
|
|
|
|
|
|
|
||||
Basic |
|
|
633,956,712 |
|
|
|
|
635,993,980 |
|
|
|
|
633,108,627 |
|
|
|
|
635,137,704 |
|
|
Diluted |
|
|
644,127,093 |
|
|
|
|
646,321,916 |
|
|
|
|
644,622,602 |
|
|
|
|
646,803,693 |
|
|
Cash dividends per share |
|
$ |
0.97 |
|
|
|
$ |
0.88 |
|
|
|
$ |
1.94 |
|
|
|
$ |
1.76 |
|
|
- Comprised primarily of noncontrolling interest attributable to the noncontrolling shareholders of Avanade, Inc.
- Diluted earnings per share assumes the exchange of all Accenture Canada Holdings Inc. exchangeable shares for Accenture plc Class A ordinary shares on a one-for-one basis. The income effect does not take into account “Net income attributable to noncontrolling interests — other,” since those shares are not redeemable or exchangeable for Accenture plc Class A ordinary shares.
| Accenture plc
Summary of Revenues (In thousands of U.S. dollars) (Unaudited) |
||||||||||
|
|
Three Months Ended |
|
Percent Increase U.S. Dollars |
|
Percent Increase Local Currency |
||||
|
|
February 28, 2022 |
|
February 28, 2021 |
|
|
||||
GEOGRAPHIC MARKETS |
|
|
|
|
|
|
|
|
||
North America |
|
$ |
7,077,036 |
|
$ |
5,631,968 |
|
26 % |
|
26 % |
Europe |
|
|
5,009,885 |
|
|
4,030,043 |
|
24 |
|
31 |
Growth Markets |
|
|
2,959,772 |
|
|
2,426,114 |
|
22 |
|
30 |
Total Revenues |
|
$ |
15,046,693 |
|
$ |
12,088,125 |
|
24 % |
|
28 % |
INDUSTRY GROUPS |
|
|
|
|
|
|
|
|
||
Communications, Media & Technology |
|
$ |
3,192,742 |
|
$ |
2,480,169 |
|
29 % |
|
32 % |
Financial Services |
|
|
2,872,158 |
|
|
2,377,555 |
|
21 |
|
25 |
Health & Public Service |
|
|
2,686,853 |
|
|
2,261,901 |
|
19 |
|
21 |
Products |
|
|
4,329,195 |
|
|
3,340,894 |
|
30 |
|
34 |
Resources |
|
|
1,965,745 |
|
|
1,627,606 |
|
21 |
|
25 |
Total Revenues |
|
$ |
15,046,693 |
|
$ |
12,088,125 |
|
24 % |
|
28 % |
TYPE OF WORK |
|
|
|
|
|
|
|
|
||
Consulting |
|
$ |
8,322,202 |
|
$ |
6,439,392 |
|
29 % |
|
34 % |
Outsourcing |
|
|
6,724,491 |
|
|
5,648,733 |
|
19 |
|
23 |
Total Revenues |
|
$ |
15,046,693 |
|
$ |
12,088,125 |
|
24 % |
|
28 % |
|
|
Six Months Ended |
|
Percent Increase U.S. Dollars |
|
Percent Increase Local Currency |
||||
|
|
February 28, 2022 |
|
February 28, 2021 |
|
|
||||
GEOGRAPHIC MARKETS |
|
|
|
|
|
|
|
|
||
North America |
|
$ |
13,984,251 |
|
$ |
11,112,931 |
|
26 % |
|
26 % |
Europe |
|
|
10,109,953 |
|
|
7,997,451 |
|
26 |
|
30 |
Growth Markets |
|
|
5,917,642 |
|
|
4,739,928 |
|
25 |
|
30 |
Total Revenues |
|
$ |
30,011,846 |
|
$ |
23,850,310 |
|
26 % |
|
28 % |
INDUSTRY GROUPS |
|
|
|
|
|
|
|
|
||
Communications, Media & Technology |
|
$ |
6,276,347 |
|
$ |
4,813,814 |
|
30 % |
|
32 % |
Financial Services |
|
|
5,789,878 |
|
|
4,723,846 |
|
23 |
|
25 |
Health & Public Service |
|
|
5,416,887 |
|
|
4,473,790 |
|
21 |
|
22 |
Products |
|
|
8,610,782 |
|
|
6,547,019 |
|
32 |
|
34 |
Resources |
|
|
3,917,952 |
|
|
3,291,841 |
|
19 |
|
21 |
Total Revenues |
|
$ |
30,011,846 |
|
$ |
23,850,310 |
|
26 % |
|
28 % |
TYPE OF WORK |
|
|
|
|
|
|
|
|
||
Consulting |
|
$ |
16,714,611 |
|
$ |
12,771,964 |
|
31 % |
|
33 % |
Outsourcing |
|
|
13,297,235 |
|
|
11,078,346 |
|
20 |
|
22 |
Total Revenues |
|
$ |
30,011,846 |
|
$ |
23,850,310 |
|
26 % |
|
28 % |
Accenture plc Operating Income by Geographic Market (In thousands of U.S. dollars) (Unaudited) |
||||||||||||
|
Three Months Ended |
|
|
|||||||||
|
February 28, 2022 |
|
February 28, 2021 |
|
|
|||||||
|
Operating Income |
|
Operating Margin |
|
Operating Income |
|
Operating Margin |
|
Increase |
|||
North America |
$ |
1,090,910 |
|
15 % |
|
$ |
772,144 |
|
14 % |
|
$ |
318,766 |
Europe |
|
531,629 |
|
11 |
|
|
502,933 |
|
12 |
|
|
28,696 |
Growth Markets |
|
439,041 |
|
15 |
|
|
378,438 |
|
16 |
|
|
60,603 |
Total Operating Income |
$ |
2,061,580 |
|
13.7 % |
|
$ |
1,653,515 |
|
13.7 % |
|
$ |
408,065 |
|
Six Months Ended |
|
|
|||||||||
|
February 28, 2022 |
|
February 28, 2021 |
|
|
|||||||
|
Operating Income |
|
Operating Margin |
|
Operating Income |
|
Operating Margin |
|
Increase |
|||
North America |
$ |
2,335,327 |
|
17 % |
|
$ |
1,660,953 |
|
15 % |
|
$ |
674,374 |
Europe |
|
1,276,485 |
|
13 |
|
|
1,132,363 |
|
14 |
|
|
144,122 |
Growth Markets |
|
884,062 |
|
15 |
|
|
750,868 |
|
16 |
|
|
133,194 |
Total Operating Income |
$ |
4,495,874 |
|
15.0 % |
|
$ |
3,544,184 |
|
14.9 % |
|
$ |
951,690 |
Accenture plc Reconciliation of Net Income and Diluted Earnings Per Share, as Reported (GAAP), to Net Income and Diluted Earnings Per Share, as Adjusted (Non-GAAP) (In thousands of U.S. dollars, except per share amounts) (Unaudited) |
||||||||||
|
Three Months Ended |
|||||||||
|
February 28, 2022 |
|
February 28, 2021 |
|||||||
|
As Reported (GAAP) |
|
As Reported (GAAP) |
Investment Gains (1) |
|
Adjusted (Non-GAAP) |
||||
Income before income taxes |
$ |
2,050,450 |
|
$ |
1,762,443 |
$ |
(151,309) |
|
$ |
1,611,134 |
Income tax expense |
|
392,921 |
|
|
300,950 |
|
(18,534) |
|
|
282,416 |
Net Income |
$ |
1,657,529 |
|
$ |
1,461,493 |
$ |
(132,775) |
|
$ |
1,328,718 |
Effective tax rate |
|
19.2 % |
|
|
17.1 % |
|
|
|
17.5 % |
|
Diluted earnings per share |
$ |
2.54 |
|
$ |
2.23 |
$ |
(0.21) |
|
$ |
2.03 |
|
Six Months Ended |
|||||||||
|
February 28, 2022 |
|
February 28, 2021 |
|||||||
|
As Reported (GAAP) |
|
As Reported (GAAP) |
Investment Gains (1) |
|
Adjusted (Non-GAAP) |
||||
Income before income taxes |
$ |
4,456,582 |
|
$ |
3,749,310 |
$ |
(271,009) |
|
$ |
3,478,301 |
Income tax expense |
|
979,323 |
|
|
765,760 |
|
(41,440) |
|
|
724,320 |
Net Income |
$ |
3,477,259 |
|
$ |
2,983,550 |
$ |
(229,569) |
|
$ |
2,753,981 |
Effective tax rate |
|
22.0 % |
|
|
20.4 % |
|
|
|
20.8 % |
|
Diluted earnings per share |
$ |
5.32 |
|
$ |
4.55 |
$ |
(0.35) |
|
$ |
4.20 |
Amounts in table may not total due to rounding.
(1) Represents gains related to our investment in Duck Creek Technologies.
Accenture plc Consolidated Balance Sheets (In thousands of U.S. dollars) |
||||||
|
|
February 28, 2022 |
|
August 31, 2021 |
||
ASSETS |
|
(Unaudited) |
|
|
||
CURRENT ASSETS: |
|
|
|
|
||
Cash and cash equivalents |
|
$ |
5,466,116 |
|
$ |
8,168,174 |
Short-term investments |
|
|
6,031 |
|
|
4,294 |
Receivables and contract assets |
|
|
11,590,876 |
|
|
9,728,212 |
Other current assets |
|
|
2,122,107 |
|
|
1,765,831 |
Total current assets |
|
|
19,185,130 |
|
|
19,666,511 |
NON-CURRENT ASSETS: |
|
|
|
|
||
Contract assets |
|
|
39,442 |
|
|
38,334 |
Investments |
|
|
336,876 |
|
|
329,526 |
Property and equipment, net |
|
|
1,656,792 |
|
|
1,639,105 |
Lease assets |
|
|
3,248,912 |
|
|
3,182,519 |
Goodwill |
|
|
12,427,823 |
|
|
11,125,861 |
Other non-current assets |
|
|
7,422,862 |
|
|
7,193,987 |
Total non-current assets |
|
|
25,132,707 |
|
|
23,509,332 |
TOTAL ASSETS |
|
$ |
44,317,837 |
|
$ |
43,175,843 |
LIABILITIES AND SHAREHOLDERS’ EQUITY |
|
|
|
|
||
CURRENT LIABILITIES: |
|
|
|
|
||
Current portion of long-term debt and bank borrowings |
|
$ |
9,092 |
|
$ |
12,080 |
Accounts payable |
|
|
2,229,221 |
|
|
2,274,057 |
Deferred revenues |
|
|
4,663,024 |
|
|
4,229,177 |
Accrued payroll and related benefits |
|
|
6,151,644 |
|
|
6,747,853 |
Lease liabilities |
|
|
728,381 |
|
|
744,164 |
Other accrued liabilities |
|
|
1,758,760 |
|
|
1,701,536 |
Total current liabilities |
|
|
15,540,122 |
|
|
15,708,867 |
NON-CURRENT LIABILITIES: |
|
|
|
|
||
Long-term debt |
|
|
52,152 |
|
|
53,473 |
Lease liabilities |
|
|
2,763,519 |
|
|
2,696,917 |
Other non-current liabilities |
|
|
4,805,065 |
|
|
4,619,472 |
Total non-current liabilities |
|
|
7,620,736 |
|
|
7,369,862 |
Total Accenture plc shareholders’ equity |
|
|
20,560,023 |
|
|
19,529,454 |
Noncontrolling interests |
|
|
596,956 |
|
|
567,660 |
Total shareholders’ equity |
|
|
21,156,979 |
|
|
20,097,114 |
TOTAL LIABILITIES AND SHAREHOLDERS’ EQUITY |
|
$ |
44,317,837 |
|
$ |
43,175,843 |
Accenture plc Consolidated Cash Flows Statements (In thousands of U.S. dollars) (Unaudited) |
||||||||||||
|
|
Three Months Ended |
|
Six Months Ended |
||||||||
|
|
February 28, 2022 |
|
February 28, 2021 |
|
February 28, 2022 |
|
February 28, 2021 |
||||
CASH FLOWS FROM OPERATING ACTIVITIES: |
|
|
|
|
|
|
|
|
||||
Net income |
|
$ |
1,657,529 |
|
$ |
1,461,493 |
|
$ |
3,477,259 |
|
$ |
2,983,550 |
Depreciation, amortization and other |
|
|
528,260 |
|
|
457,775 |
|
|
1,029,125 |
|
|
925,975 |
Share-based compensation expense |
|
|
546,607 |
|
|
424,892 |
|
|
912,298 |
|
|
736,213 |
Change in assets and liabilities/other, net |
|
|
(576,903) |
|
|
190,561 |
|
|
(2,732,318) |
|
|
(508,172) |
Net cash provided by (used in) operating activities |
|
|
2,155,493 |
|
|
2,534,721 |
|
|
2,686,364 |
|
|
4,137,566 |
CASH FLOWS FROM INVESTING ACTIVITIES: |
|
|
|
|
|
|
|
|
||||
Purchases of property and equipment |
|
|
(164,660) |
|
|
(92,510) |
|
|
(346,331) |
|
|
(185,625) |
Purchases of businesses and investments, net of cash acquired |
|
|
(113,746) |
|
|
(611,332) |
|
|
(1,848,774) |
|
|
(1,115,175) |
Proceeds from the sale of businesses and investments |
|
|
3,474 |
|
|
261,140 |
|
|
3,561 |
|
|
410,142 |
Other investing, net |
|
|
2,430 |
|
|
3,347 |
|
|
6,461 |
|
|
4,896 |
Net cash provided by (used in) investing activities |
|
|
(272,502) |
|
|
(439,355) |
|
|
(2,185,083) |
|
|
(885,762) |
CASH FLOWS FROM FINANCING ACTIVITIES: |
|
|
|
|
|
|
|
|
||||
Proceeds from issuance of ordinary shares |
|
|
292,747 |
|
|
208,195 |
|
|
701,877 |
|
|
547,086 |
Purchases of shares |
|
|
(1,693,354) |
|
|
(1,184,586) |
|
|
(2,538,720) |
|
|
(1,953,481) |
Cash dividends paid |
|
|
(616,583) |
|
|
(561,042) |
|
|
(1,229,791) |
|
|
(1,119,094) |
Other financing, net |
|
|
(19,525) |
|
|
(9,300) |
|
|
(39,541) |
|
|
(20,695) |
Net cash provided by (used in) financing activities |
|
|
(2,036,715) |
|
|
(1,546,733) |
|
|
(3,106,175) |
|
|
(2,546,184) |
Effect of exchange rate changes on cash and cash equivalents |
|
|
(17,277) |
|
|
23,942 |
|
|
(97,164) |
|
|
45,628 |
NET INCREASE (DECREASE) IN CASH AND CASH EQUIVALENTS |
|
|
(171,001) |
|
|
572,575 |
|
|
(2,702,058) |
|
|
751,248 |
CASH AND CASH EQUIVALENTS, beginning of period |
|
|
5,637,117 |
|
|
8,594,003 |
|
|
8,168,174 |
|
|
8,415,330 |
CASH AND CASH EQUIVALENTS, end of period |
|
$ |
5,466,116 |
|
$ |
9,166,578 |
|
$ |
5,466,116 |
|
$ |
9,166,578 |
View source version on businesswire.com: https://www.businesswire.com/news/home/20220317005194/en/
Contacts
Stacey Jones
Accenture Media Relations
+1 (917) 452-6561
stacey.jones@accenture.com
Angie Park
Accenture Investor Relations
+1 (703) 947-2401
angie.park@accenture.com