VIRGINIA BEACH, Va. - June 1, 2021 - PRLog -- According to a newly released study from Schonfeld & Associates, Inc., R&D Ratios & Budgets, now in its 45th annual edition, the pharmaceutical industry continued to be the biggest R&D investor in fiscal 2020 with budgets of drug companies increasing by over 12% to over $140 billion. Software companies continued to contribute a total of over $73 billion to this investment pool.
The biggest single R&D investor in 2020 was Alphabet at over $25 billion, followed by Microsoft at $22 billion, and then Apple and Facebook at $18 billion. Firms involved with digital content are investing much more heavily than those in more traditional arenas.
Pharmaceutical firms continued significant R&D spending in 2020. Merck, the top spender at $13.5 billion, is followed by Johnson & Johnson, Bristol Myers Squibb, Pfizer and Novartis, each spending over $8 billion. The biotech industry, led by Gilead Sciences, grew R&D by over 33% to over $31 billion. Electromedical apparatus makers, led by Medtronic, spent a total of over $3 billion, an increase of over two percent.
R&D budgets of semiconductor makers grew to over $51 billion, an increase of 8.3%. Intel had the largest R&D budget, $13.5 billion, an 8% increase over 2019. R&D budgets of the industries that are major suppliers to the infrastructure of the Internet cloud also have increased R&D spending.
2020 R&D spending of the automotive industry, led by Toyota, Honda and Ford each spending over $7 billion, was essentially flat from the 2019 total with industry revenues down 8.2% .
About the Study
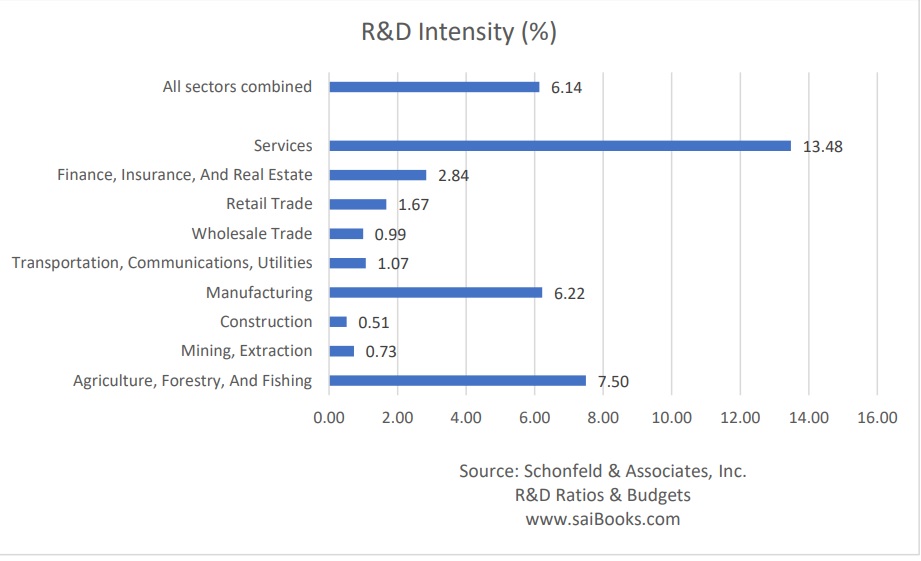
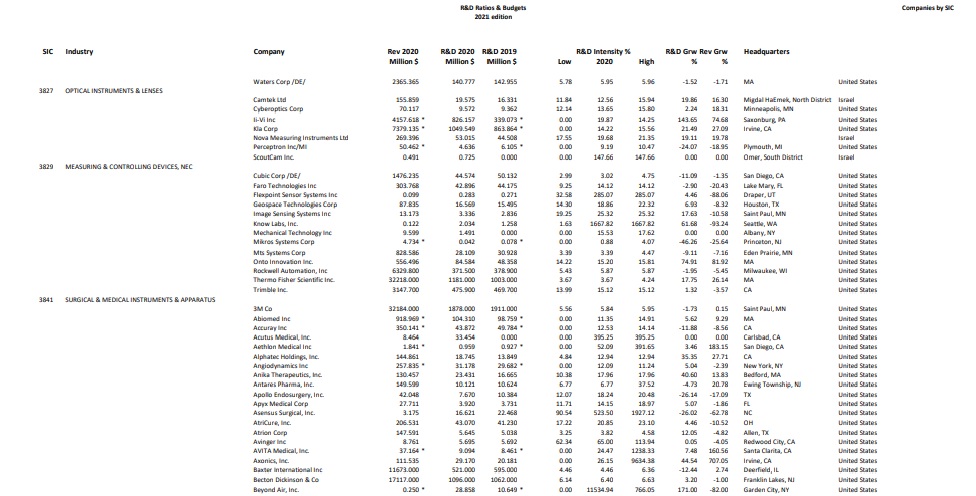
R&D Ratios & Budgets contains fiscal 2019 and 2020 R&D spending, 2020 revenue and 2020 R&D intensity ratio, as well as 2019 and 2020 annual growth rates in R&D spending and sales for over 2,500 firms. Over 290 industry summaries of the same information are provided. The study reports for each company a low and high value for the R&D-to-sales ratio (also known as R&D intensity) for the last five years to indicate stability of R&D spending.
R&D Ratios & Budgets is used for budget planning, monitoring competition, identifying joint venture partners, and spotting acquisition candidates.
The 2021 edition of the PDF report is $ 395 and the report along with Excel datafiles is $ 495. Contact Schonfeld & Associates, Inc., 1932 Terramar Lane, Virginia Beach, VA 23456. Call for more information: 800-205-0030 or visit the company's web site for immediate download at www.saiBooks.com under Area of Expertise: Research & Development Spending.
Photos: (Click photo to enlarge)
Read Full Story - 2020 R&D Spending and Intensity Benchmarks | More news from this source
Press release distribution by PRLog