
Insurance data analytics provider Verisk Analytics (NASDAQ: VRSK) met Wall Street’s revenue expectations in Q1 CY2025, with sales up 7% year on year to $753 million. The company’s outlook for the full year was close to analysts’ estimates with revenue guided to $3.06 billion at the midpoint. Its non-GAAP profit of $1.73 per share was 2.8% above analysts’ consensus estimates.
Is now the time to buy Verisk? Find out by accessing our full research report, it’s free.
Verisk (VRSK) Q1 CY2025 Highlights:
- Revenue: $753 million vs analyst estimates of $750.8 million (7% year-on-year growth, in line)
- Adjusted EPS: $1.73 vs analyst estimates of $1.68 (2.8% beat)
- Adjusted EBITDA: $417 million vs analyst estimates of $409.5 million (55.4% margin, 1.8% beat)
- The company reconfirmed its revenue guidance for the full year of $3.06 billion at the midpoint
- Management reiterated its full-year Adjusted EPS guidance of $6.95 at the midpoint
- EBITDA guidance for the full year is $1.70 million at the midpoint, below analyst estimates of $1.70 billion
- Operating Margin: 43.8%, in line with the same quarter last year
- Free Cash Flow Margin: 51.9%, up from 45% in the same quarter last year
- Market Capitalization: $41.45 billion
Company Overview
Processing over 2.8 billion insurance transaction records annually through one of the world's largest private databases, Verisk Analytics (NASDAQ: VRSK) provides data, analytics, and technology solutions that help insurance companies assess risk, detect fraud, and make better business decisions.
Sales Growth
Reviewing a company’s long-term sales performance reveals insights into its quality. Any business can put up a good quarter or two, but the best consistently grow over the long haul.
With $2.93 billion in revenue over the past 12 months, Verisk is a mid-sized business services company, which sometimes brings disadvantages compared to larger competitors benefiting from better economies of scale.
As you can see below, Verisk’s sales grew at a sluggish 1.9% compounded annual growth rate over the last five years. This shows it failed to generate demand in any major way and is a rough starting point for our analysis.
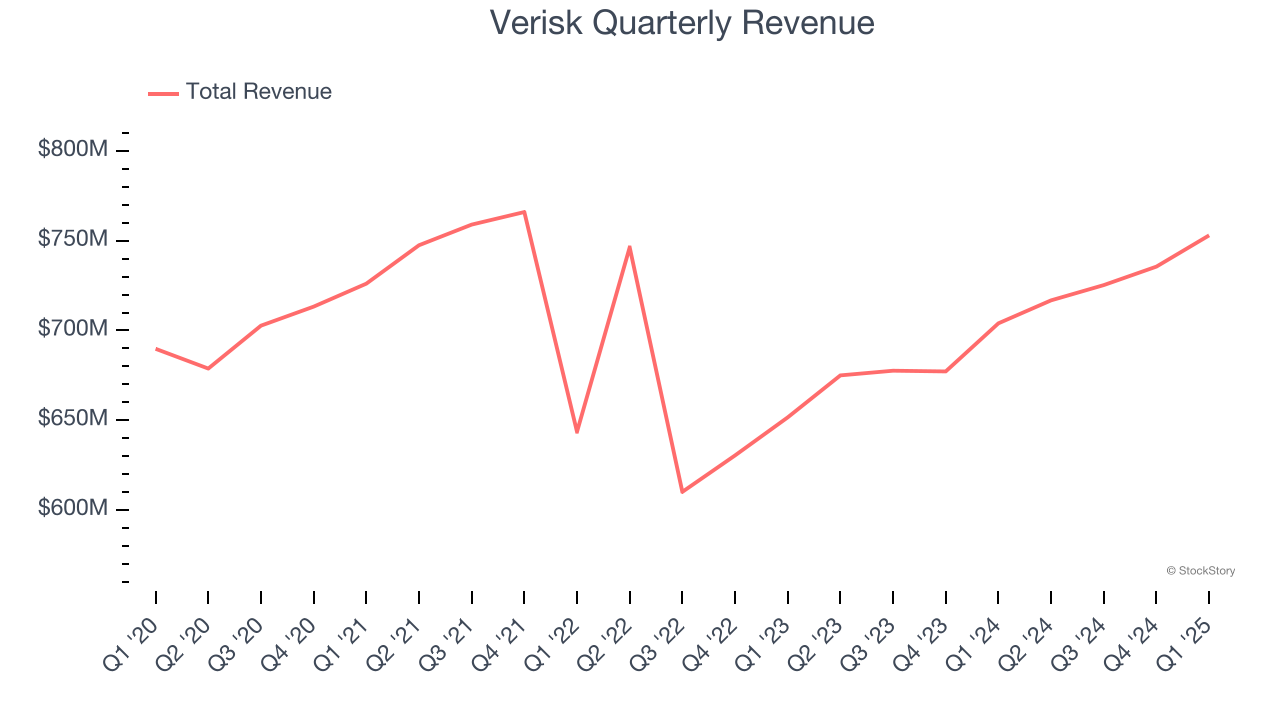
We at StockStory place the most emphasis on long-term growth, but within business services, a half-decade historical view may miss recent innovations or disruptive industry trends. Verisk’s annualized revenue growth of 5.4% over the last two years is above its five-year trend, suggesting some bright spots. 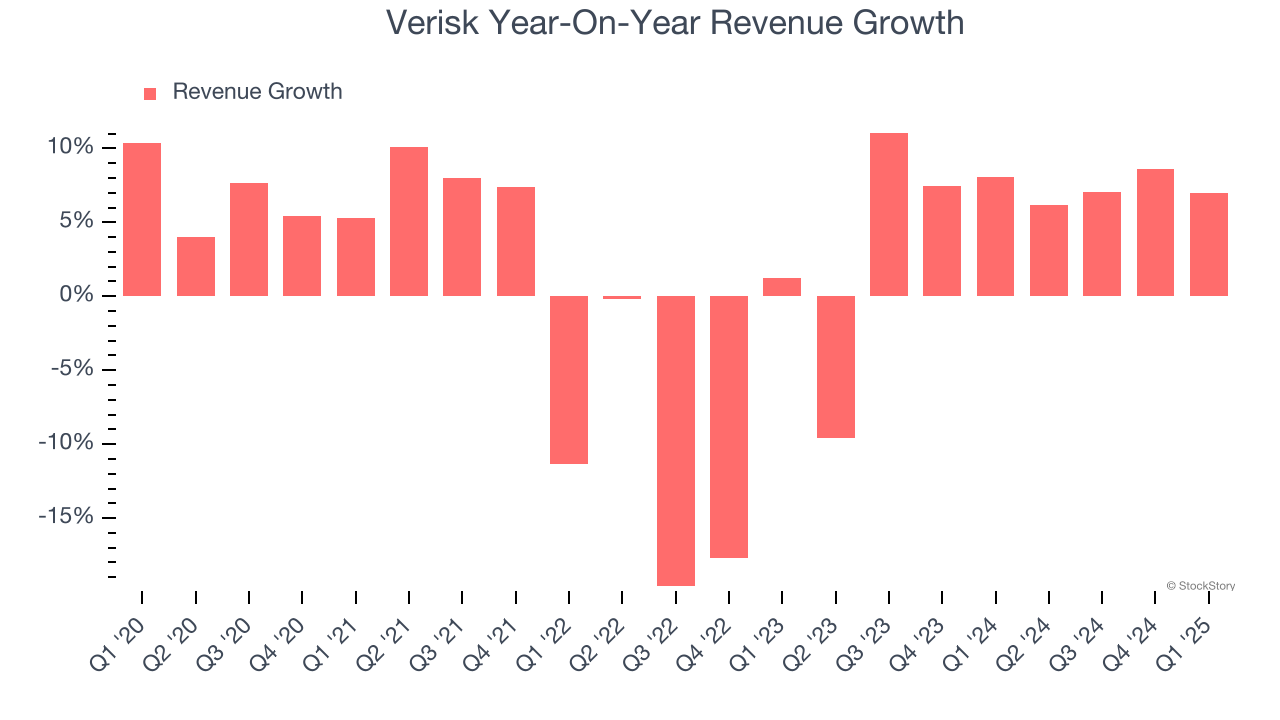
This quarter, Verisk grew its revenue by 7% year on year, and its $753 million of revenue was in line with Wall Street’s estimates.
Looking ahead, sell-side analysts expect revenue to grow 6.4% over the next 12 months, similar to its two-year rate. This projection is above the sector average and implies its newer products and services will catalyze better top-line performance.
Today’s young investors won’t have read the timeless lessons in Gorilla Game: Picking Winners In High Technology because it was written more than 20 years ago when Microsoft and Apple were first establishing their supremacy. But if we apply the same principles, then enterprise software stocks leveraging their own generative AI capabilities may well be the Gorillas of the future. So, in that spirit, we are excited to present our Special Free Report on a profitable, fast-growing enterprise software stock that is already riding the automation wave and looking to catch the generative AI next.
Operating Margin
Verisk has been a well-oiled machine over the last five years. It demonstrated elite profitability for a business services business, boasting an average operating margin of 42.5%.
Analyzing the trend in its profitability, Verisk’s operating margin rose by 6.8 percentage points over the last five years, as its sales growth gave it operating leverage.
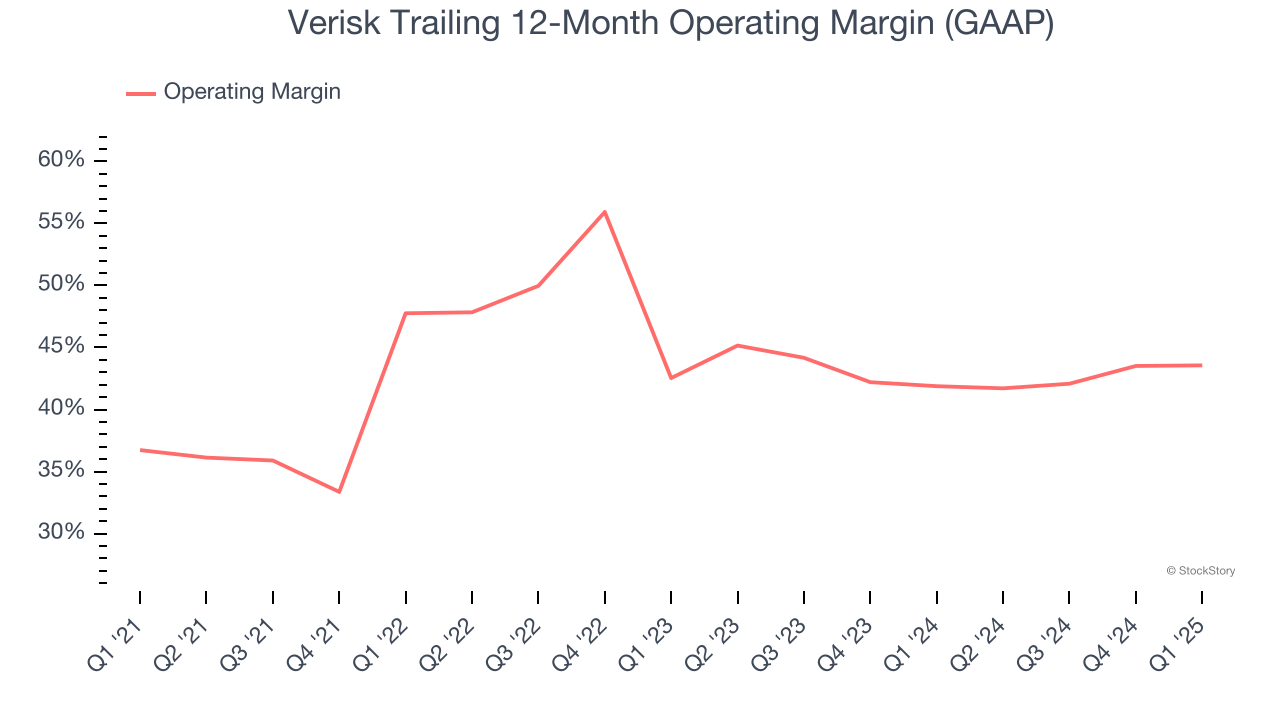
This quarter, Verisk generated an operating profit margin of 43.8%, in line with the same quarter last year. This indicates the company’s overall cost structure has been relatively stable.
Earnings Per Share
Revenue trends explain a company’s historical growth, but the long-term change in earnings per share (EPS) points to the profitability of that growth – for example, a company could inflate its sales through excessive spending on advertising and promotions.
Verisk’s EPS grew at a decent 8.3% compounded annual growth rate over the last five years, higher than its 1.9% annualized revenue growth. This tells us the company became more profitable on a per-share basis as it expanded.
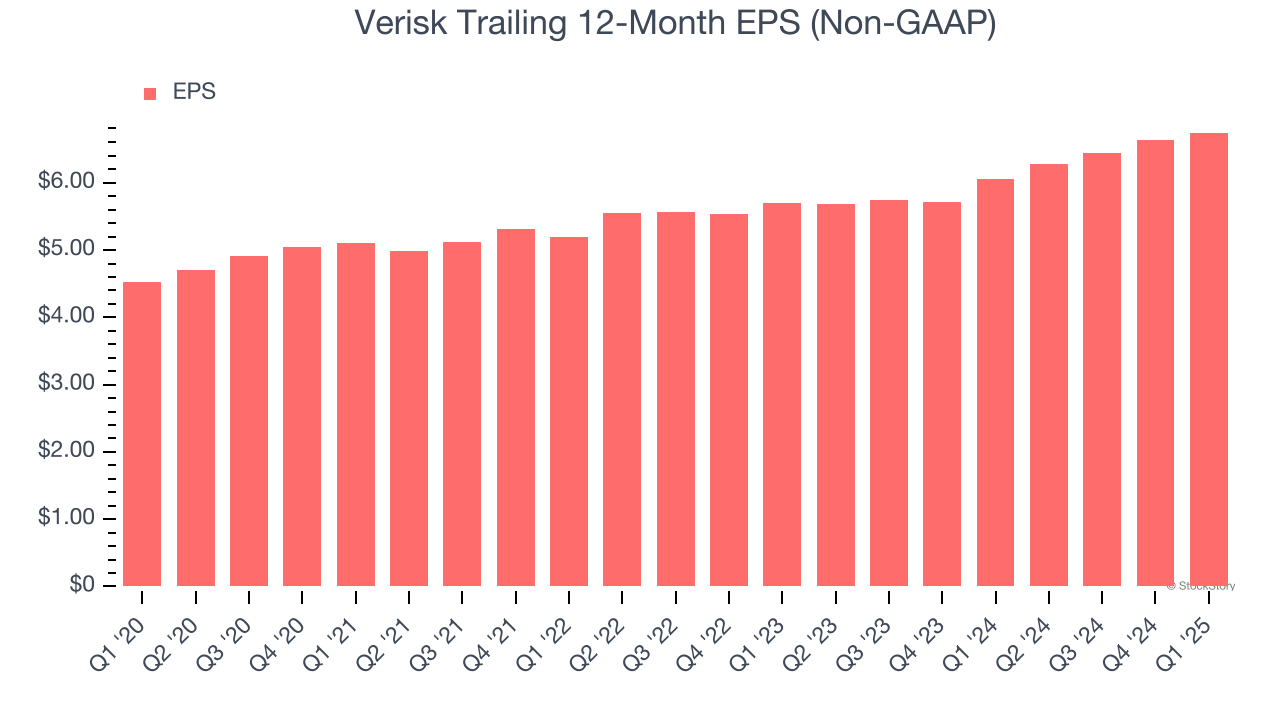
Diving into Verisk’s quality of earnings can give us a better understanding of its performance. As we mentioned earlier, Verisk’s operating margin was flat this quarter but expanded by 6.8 percentage points over the last five years. On top of that, its share count shrank by 15%. These are positive signs for shareholders because improving profitability and share buybacks turbocharge EPS growth relative to revenue growth. 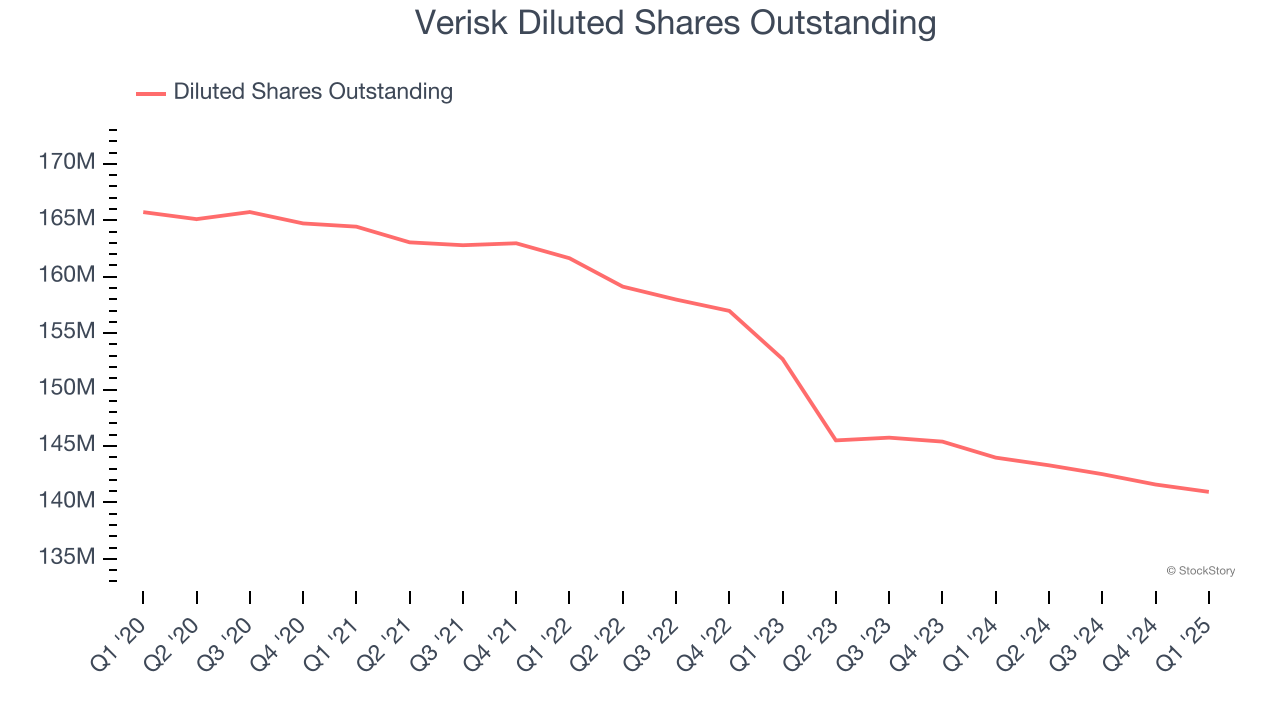
In Q1, Verisk reported EPS at $1.73, up from $1.63 in the same quarter last year. This print beat analysts’ estimates by 2.8%. Over the next 12 months, Wall Street expects Verisk’s full-year EPS of $6.75 to grow 7.1%.
Key Takeaways from Verisk’s Q1 Results
It was encouraging to see Verisk beat analysts’ EPS expectations this quarter. On the other hand, its full-year EPS guidance slightly missed and its full-year revenue guidance was in line with Wall Street’s estimates. Both full-year revenue and EPS guidance remained unchanged from what the company previously provided. Overall, this quarter didn't feature many surprises good or bad. The stock remained flat at $298.50 immediately following the results.
Should you buy the stock or not? What happened in the latest quarter matters, but not as much as longer-term business quality and valuation, when deciding whether to invest in this stock. We cover that in our actionable full research report which you can read here, it’s free.