

Since May 2021, the S&P 500 has delivered a total return of 80.2%. But one standout stock has more than doubled the market - over the past five years, Ryder has surged 168% to $227.81 per share. Its momentum hasn’t stopped as it’s also gained 34.6% in the last six months thanks to its solid quarterly results, beating the S&P by 24.5%.
Is now the time to buy Ryder, or should you be careful about including it in your portfolio? Check out our in-depth research report to see what our analysts have to say, it’s free.
Why Is Ryder Not Exciting?
Despite the momentum, we're cautious about Ryder. Here are three reasons you should be careful with R and a stock we'd rather own.
1. Lackluster Revenue Growth
We at StockStory place the most emphasis on long-term growth, but within industrials, a stretched historical view may miss cycles, industry trends, or a company capitalizing on catalysts such as a new contract win or a successful product line. Ryder’s recent performance shows its demand has slowed as its annualized revenue growth of 3% over the last two years was below its five-year trend. We’re wary when companies in the sector see decelerations in revenue growth, as it could signal changing consumer tastes aided by low switching costs. 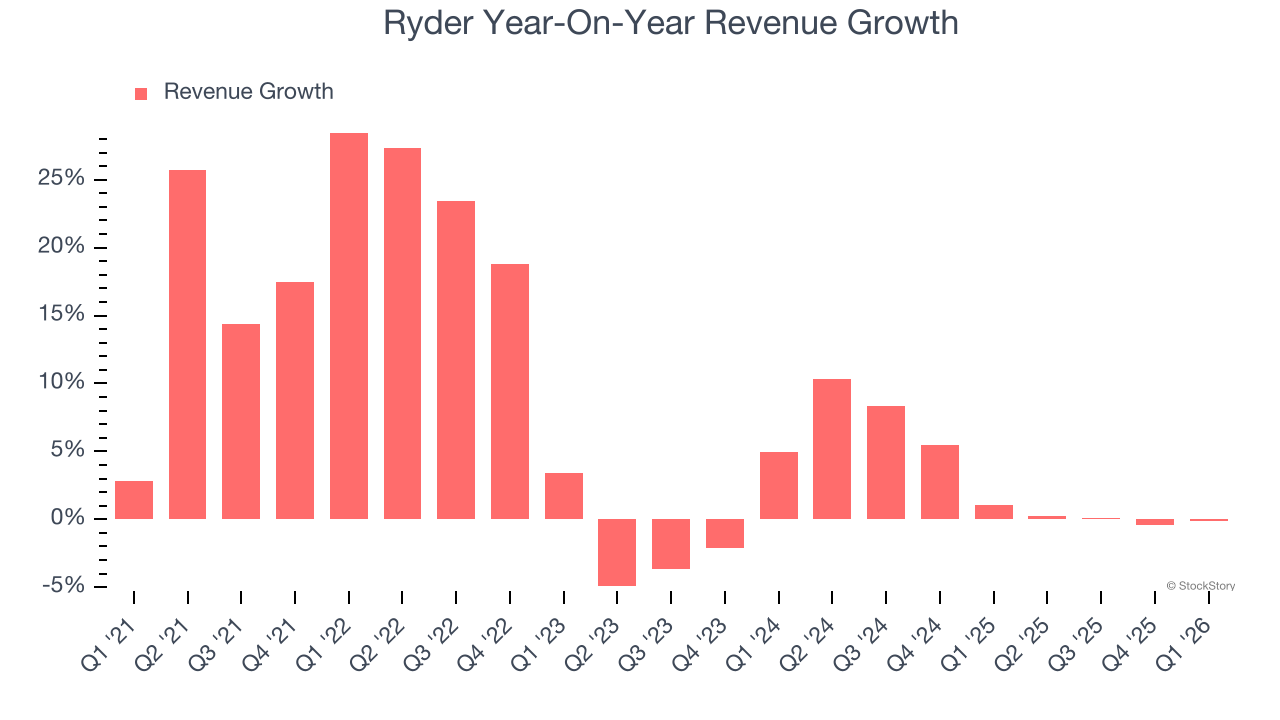
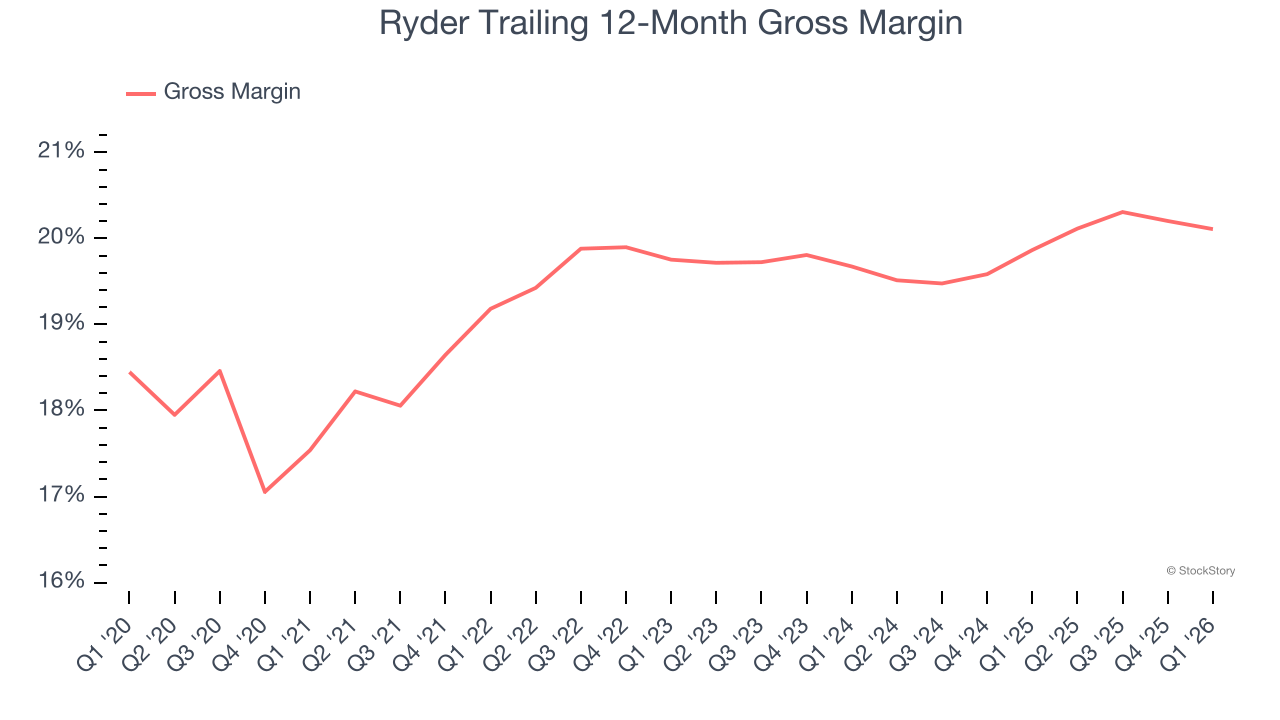
2. Low Gross Margin Reveals Weak Structural Profitability
Cost of sales for an industrials business is usually comprised of the direct labor, raw materials, and supplies needed to offer a product or service. These costs can be impacted by inflation and supply chain dynamics.
Ryder has bad unit economics for an industrials business, signaling it operates in a competitive market. As you can see below, it averaged a 19.7% gross margin over the last five years. That means Ryder paid its suppliers a lot of money ($80.26 for every $100 in revenue) to run its business.
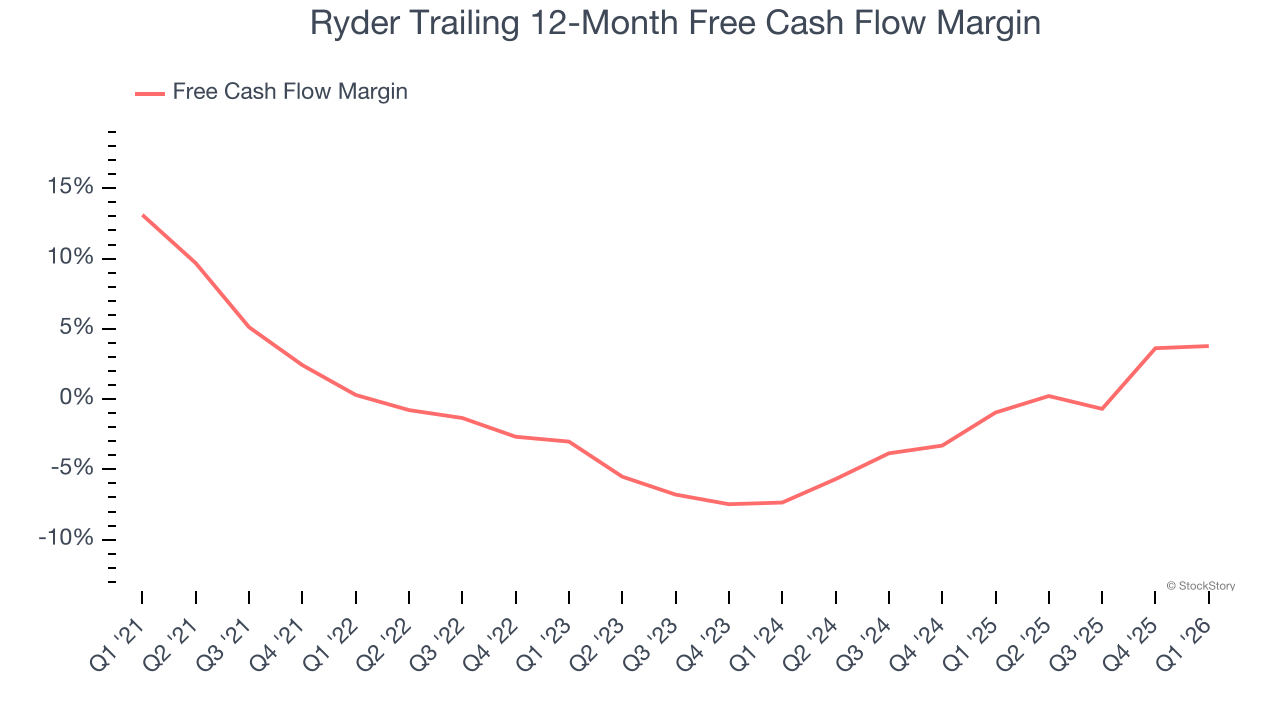
3. Cash Burn Ignites Concerns
If you’ve followed StockStory for a while, you know we emphasize free cash flow. Why, you ask? We believe that in the end, cash is king, and you can’t use accounting profits to pay the bills.
While Ryder posted positive free cash flow this quarter, the broader story hasn’t been so clean. Ryder’s demanding reinvestments have drained its resources over the last five years, putting it in a pinch and limiting its ability to return capital to investors. Its free cash flow margin averaged negative 1.4%, meaning it lit $1.44 of cash on fire for every $100 in revenue.
Final Judgment
Ryder isn’t a terrible business, but it doesn’t pass our quality test. With its shares beating the market recently, the stock trades at 15.4× forward P/E (or $227.81 per share). While this valuation is reasonable, we don’t really see a big opportunity at the moment. We're pretty confident there are superior stocks to buy right now. Let us point you toward one of Charlie Munger’s all-time favorite businesses.
High-Quality Stocks for All Market Conditions
ONE MORE THING: Top 6 Stocks for This Week. This market is separating quality stocks from expensive ones fast. AI taking down whole sectors with no warning. In a rotation this fast, you need more than a list of good companies.
Our AI system flagged Palantir before it ran 1,662%. AppLovin before it ran 753%. Nvidia before it ran 1,178%. Each week it produces 6 new names that pass the same tests. Get Our Top 6 Stocks for Free HERE.
Stocks that have made our list include now familiar names such as Nvidia (+1,326% between June 2020 and June 2025) as well as under-the-radar businesses like the once-micro-cap company Tecnoglass (+1,754% five-year return). Find your next big winner with StockStory today.


