
Business transformation services company Genpact (NYSE: G) reported revenue ahead of Wall Street’s expectations in Q1 CY2026, with sales up 6.7% year on year to $1.30 billion. On the other hand, next quarter’s revenue guidance of $1.33 billion was less impressive, coming in 0.7% below analysts’ estimates. Its non-GAAP profit of $0.98 per share was 6.3% above analysts’ consensus estimates.
Is now the time to buy Genpact? Find out by accessing our full research report, it’s free.
Genpact (G) Q1 CY2026 Highlights:
- Revenue: $1.30 billion vs analyst estimates of $1.29 billion (6.7% year-on-year growth, 0.5% beat)
- Adjusted EPS: $0.98 vs analyst estimates of $0.92 (6.3% beat)
- Adjusted EBITDA: $238.6 million vs analyst estimates of $242.9 million (18.4% margin, 1.8% miss)
- Revenue Guidance for Q2 CY2026 is $1.33 billion at the midpoint, below analyst estimates of $1.34 billion
- Adjusted EPS guidance for Q2 CY2026 is $0.97 at the midpoint, below analyst estimates of $0.97
- Operating Margin: 15.3%, in line with the same quarter last year
- Free Cash Flow was -$54.98 million, down from $17.86 million in the same quarter last year
- Constant Currency Revenue rose 5.6% year on year (8.3% in the same quarter last year)
- Market Capitalization: $5.74 billion
Company Overview
Originally spun off from General Electric in 2005 to provide business process services, Genpact (NYSE: G) is a global professional services firm that helps businesses transform their operations through digital technology, AI, and data analytics solutions.
Revenue Growth
A company’s long-term sales performance is one signal of its overall quality. Any business can put up a good quarter or two, but the best consistently grow over the long haul.
With $5.16 billion in revenue over the past 12 months, Genpact is one of the larger companies in the business services industry and benefits from a well-known brand that influences purchasing decisions.
As you can see below, Genpact’s sales grew at a decent 6.7% compounded annual growth rate over the last five years. This shows its offerings generated slightly more demand than the average business services company, a helpful starting point for our analysis.
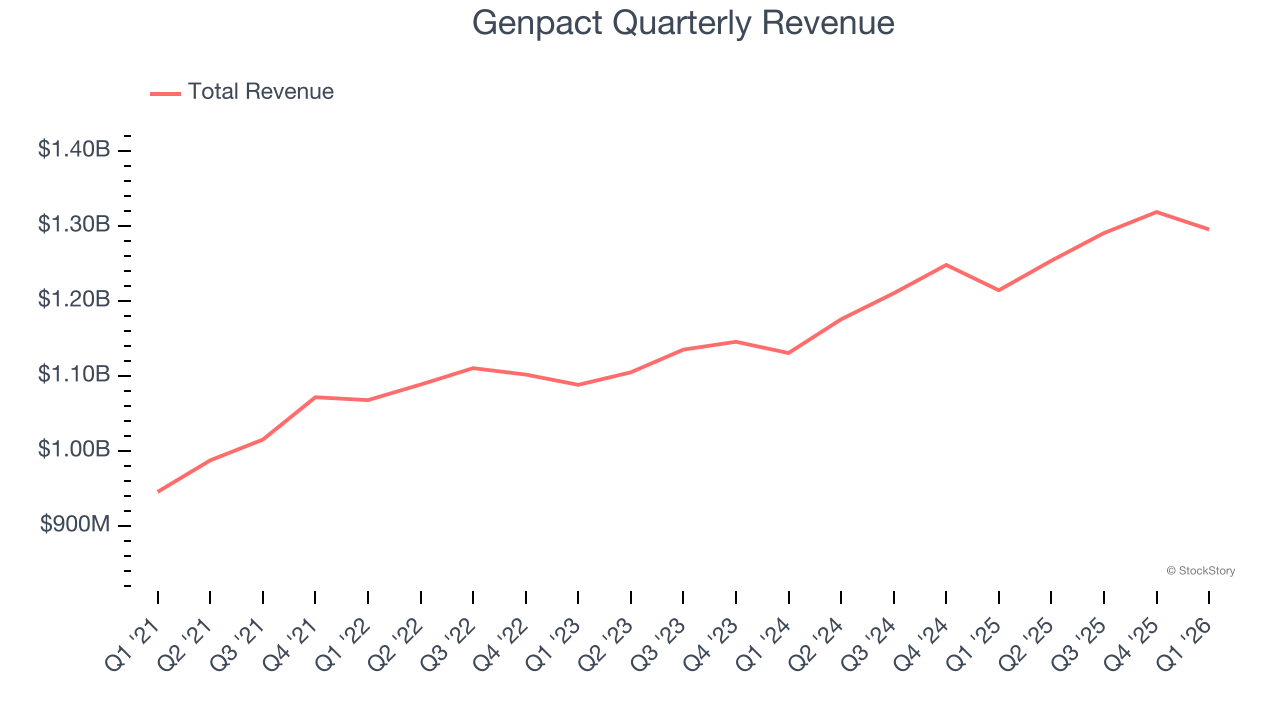
Long-term growth is the most important, but within business services, a half-decade historical view may miss new innovations or demand cycles. Genpact’s annualized revenue growth of 6.9% over the last two years aligns with its five-year trend, suggesting its demand was stable. 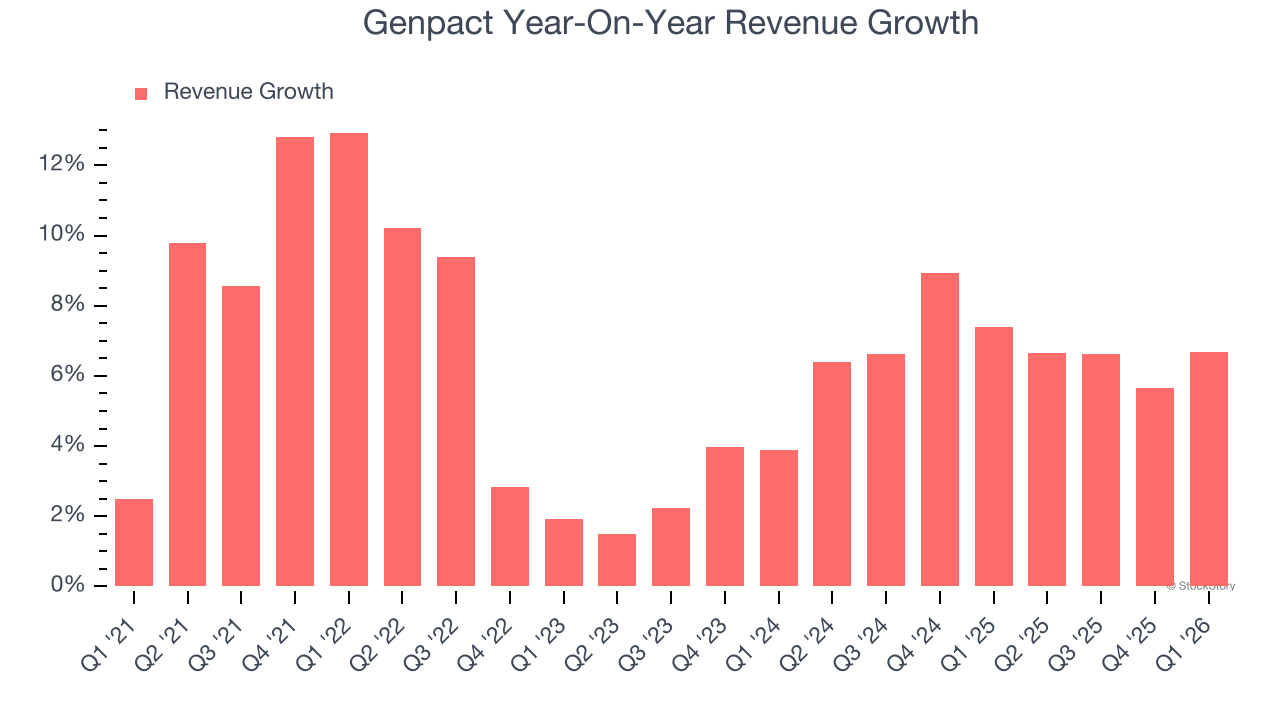
Genpact also reports sales performance excluding currency movements, which are outside the company’s control and not indicative of demand. Over the last two years, its constant currency sales averaged 6.7% year-on-year growth. Because this number aligns with its reported revenue growth, we can see that foreign exchange has not had a meaningful impact on topline. 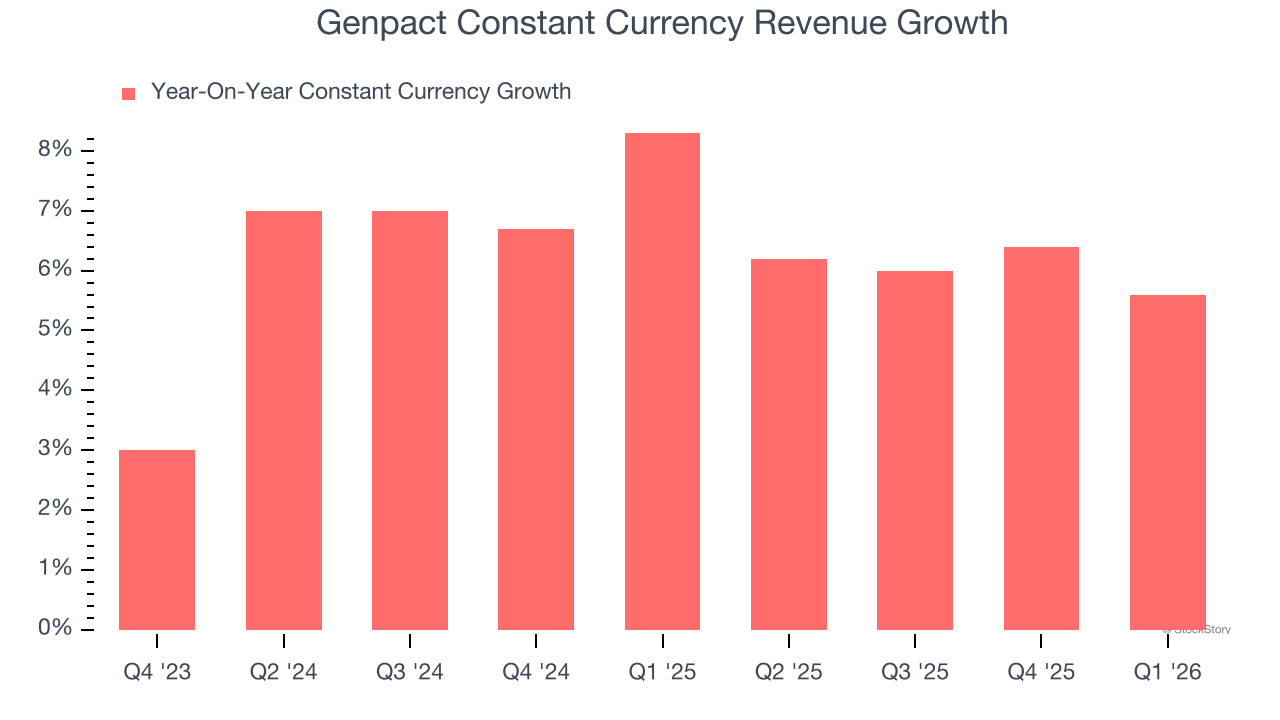
This quarter, Genpact reported year-on-year revenue growth of 6.7%, and its $1.30 billion of revenue exceeded Wall Street’s estimates by 0.5%. Company management is currently guiding for a 6% year-on-year increase in sales next quarter.
Looking further ahead, sell-side analysts expect revenue to grow 7.3% over the next 12 months, similar to its two-year rate. This projection is admirable and implies the market is forecasting success for its products and services.
ONE MORE THING: 3 Hidden Platforms Growing 3X Faster than Amazon, Google, and PayPal. Amazon, Google, and Meta all followed the same playbook: Dominate an ignored market. Build an unbeatable moat. Scale until you’re unstoppable.
These three platforms are running that exact playbook right now. The early investors in Amazon made fortunes. The early investors in these could do the same. Get All 3 Stocks Here for FREE.
Adjusted Operating Margin
Genpact has been an efficient company over the last five years. It was one of the more profitable businesses in the business services sector, boasting an average adjusted operating margin of 16.9%.
Analyzing the trend in its profitability, Genpact’s adjusted operating margin rose by 1.5 percentage points over the last five years, as its sales growth gave it operating leverage.
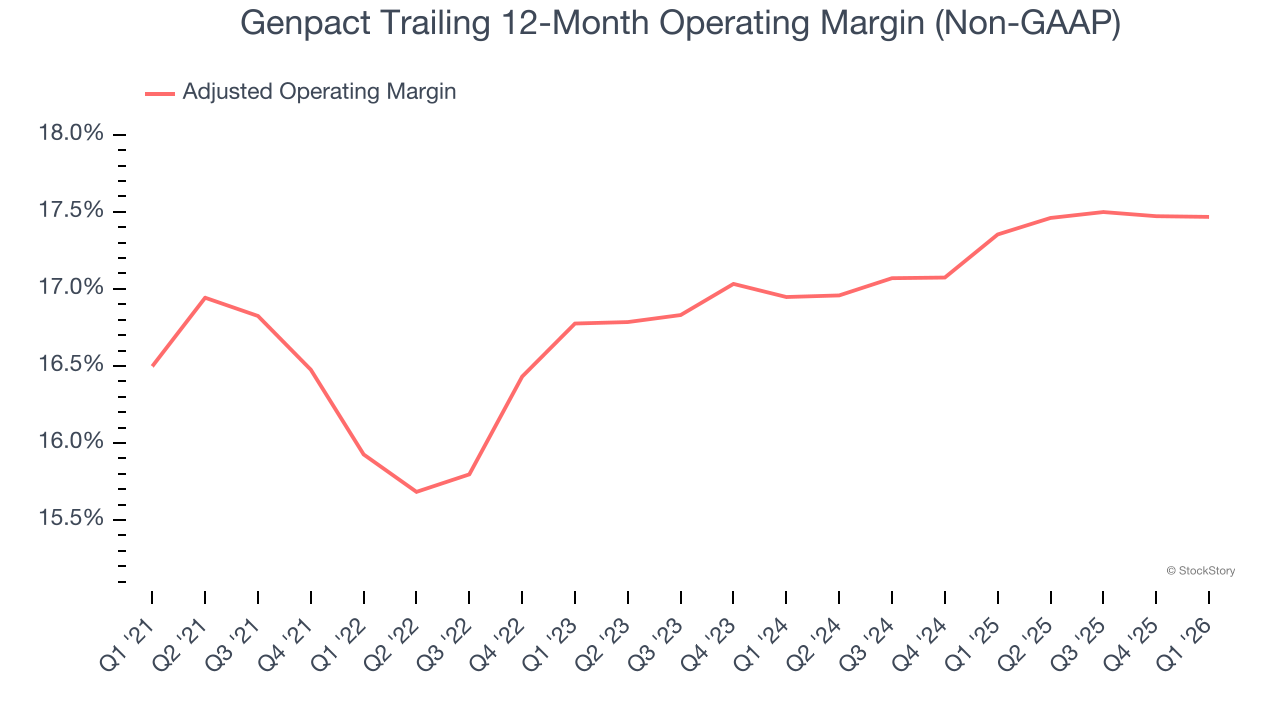
This quarter, Genpact generated an adjusted operating margin profit margin of 17.3%, in line with the same quarter last year. This indicates the company’s overall cost structure has been relatively stable.
Earnings Per Share
We track the long-term change in earnings per share (EPS) for the same reason as long-term revenue growth. Compared to revenue, however, EPS highlights whether a company’s growth is profitable.
Genpact’s EPS grew at 11.8% compounded annual growth rate over the last five years, higher than its 6.7% annualized revenue growth. This tells us the company became more profitable on a per-share basis as it expanded.
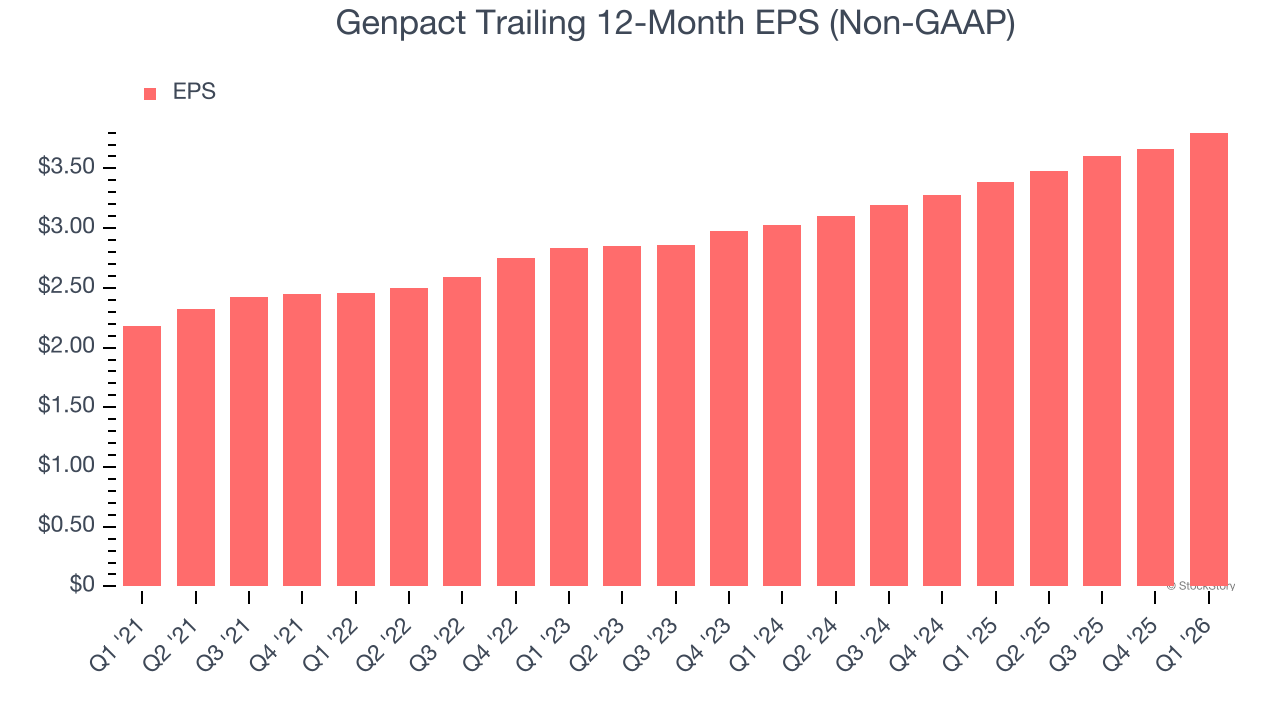
We can take a deeper look into Genpact’s earnings quality to better understand the drivers of its performance. As we mentioned earlier, Genpact’s adjusted operating margin was flat this quarter but expanded by 1.5 percentage points over the last five years. On top of that, its share count shrank by 10.5%. These are positive signs for shareholders because improving profitability and share buybacks turbocharge EPS growth relative to revenue growth. 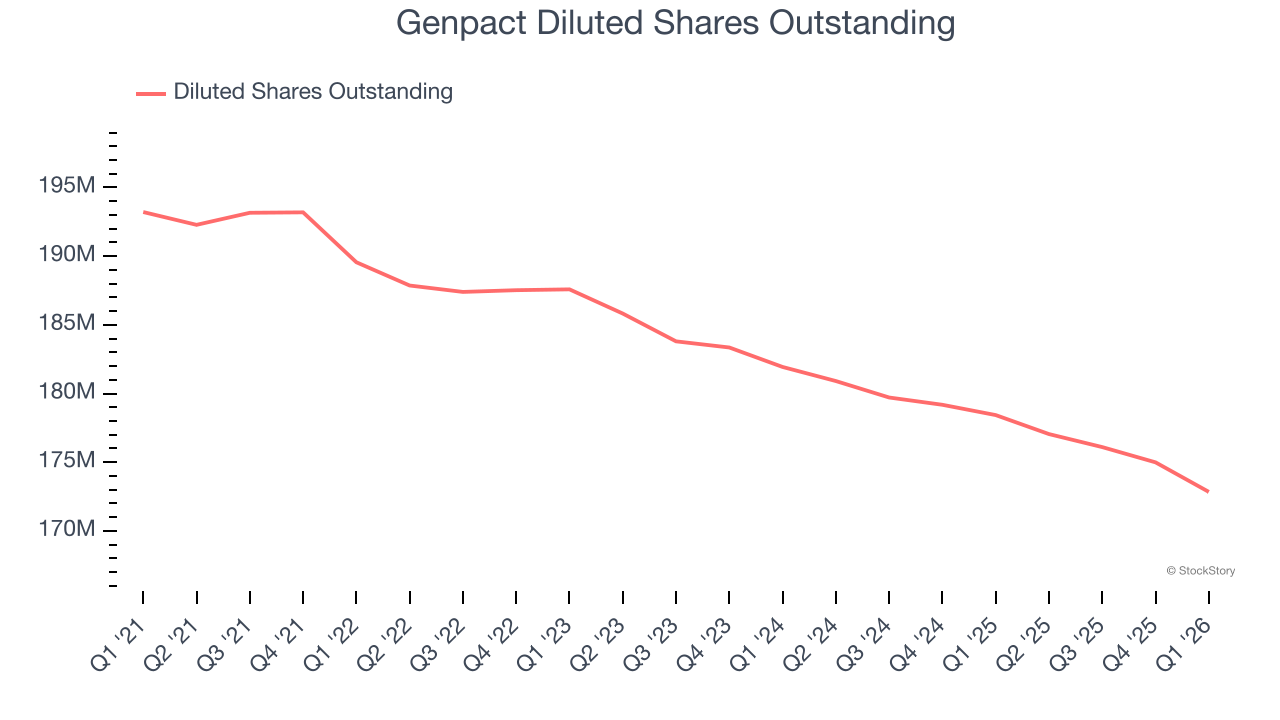
Like with revenue, we analyze EPS over a more recent period because it can provide insight into an emerging theme or development for the business.
For Genpact, its two-year annual EPS growth of 12% is similar to its five-year trend, implying stable earnings power.
In Q1, Genpact reported adjusted EPS of $0.98, up from $0.84 in the same quarter last year. This print beat analysts’ estimates by 6.3%. Over the next 12 months, Wall Street expects Genpact’s full-year EPS of $3.80 to grow 8.6%.
Key Takeaways from Genpact’s Q1 Results
It was good to see Genpact beat analysts’ EPS expectations this quarter. We were also happy its revenue narrowly outperformed Wall Street’s estimates. On the other hand, its revenue guidance for next quarter slightly missed and its EPS guidance for next quarter fell slightly short of Wall Street’s estimates. Zooming out, we think this was a mixed quarter. The market seemed to be hoping for more, and the stock traded down 1% to $34.12 immediately following the results.
Is Genpact an attractive investment opportunity right now? The latest quarter does matter, but not nearly as much as longer-term fundamentals and valuation, when deciding if the stock is a buy. We cover that in our actionable full research report which you can read here (it’s free).