Restaurant company Darden (NYSE: DRI) met Wall Street’s revenue expectations in Q2 CY2026, with sales up 13.7% year on year to $3.72 billion. The company’s outlook for the full year was close to analysts’ estimates with revenue guided to $13.68 billion at the midpoint. Its GAAP profit of $3.51 per share was 3.6% below analysts’ consensus estimates.
Is now the time to buy Darden? Find out by accessing our full research report, it’s free.
Darden (DRI) Q2 CY2026 Highlights:
- Revenue: $3.72 billion vs analyst estimates of $3.73 billion (13.7% year-on-year growth, in line)
- EPS (GAAP): $3.51 vs analyst expectations of $3.64 (3.6% miss)
- EPS (GAAP) guidance for the upcoming financial year 2027 is $11.23 at the midpoint, missing analyst estimates by 1.3%
- EBITDA guidance for the upcoming financial year 2027 is $2.28 billion at the midpoint, in line with analyst expectations
- Operating Margin: 13.9%, up from 11.7% in the same quarter last year
- Free Cash Flow Margin: 10%, up from 8.7% in the same quarter last year
- Locations: 2,202 at quarter end, up from 2,159 in the same quarter last year
- Same-Store Sales rose 4.6% year on year, in line with the same quarter last year
- Market Capitalization: $24.15 billion
"The fourth quarter was a strong finish to an excellent year, one in which we significantly outperformed the industry," said Darden President & CEO Rick Cardenas.
Company Overview
Founded in 1968 as Red Lobster, Darden (NYSE: DRI) is a leading American restaurant company that owns and operates a portfolio of popular restaurant brands.
Revenue Growth
Examining a company’s long-term performance can provide clues about its quality. Any business can experience short-term success, but top-performing ones enjoy sustained growth for years.
With $13.21 billion in revenue over the past 12 months, Darden is one of the most widely recognized restaurant chains and benefits from customer loyalty, a luxury many don’t have. Its scale also gives it negotiating leverage with suppliers, enabling it to source its ingredients at a lower cost. However, its scale is a double-edged sword because it’s harder to find incremental growth when your existing restaurant banners have penetrated most of the market. To accelerate system-wide sales, Darden likely needs to optimize its pricing or lean into new chains and international expansion.
As you can see below, Darden’s sales grew at a mediocre 6.5% compounded annual growth rate over the last seven years, but to its credit, it opened new restaurants and increased sales at existing, established dining locations.
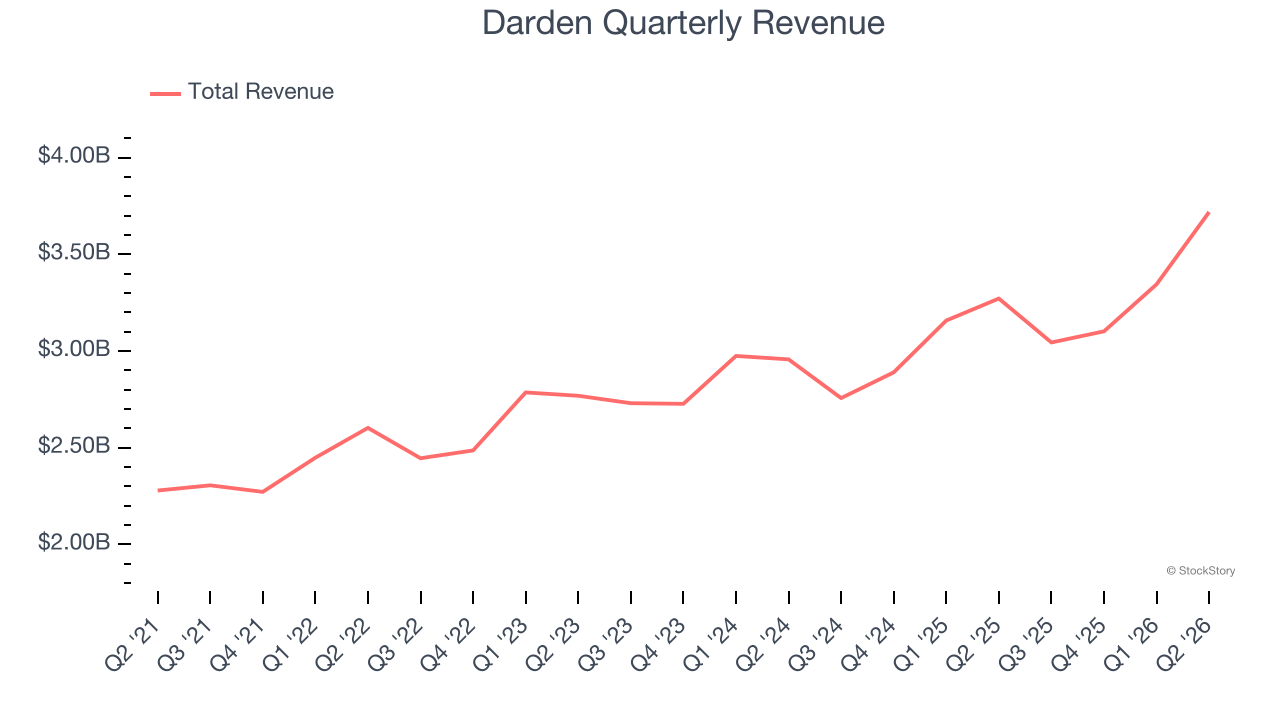
This quarter, Darden’s year-on-year revenue growth was 13.7%, and its $3.72 billion of revenue was in line with Wall Street’s estimates.
Looking ahead, sell-side analysts expect revenue to grow 3.6% over the next 12 months, a slight deceleration versus the last seven years. This projection doesn’t excite us and implies its menu offerings will see some demand headwinds.
WHILE YOU’RE HERE: The Next Palantir? One satellite company captures images of every point on Earth. Every single day. The Pentagon wants it. Hedge funds are using it to beat earnings. You’ve probably never heard of it.
This is what the early days of Palantir looked like before it became a $437 billion giant. Same playbook. Different technology. If you missed Palantir, you need to see this. Claim The Stock Ticker for Free HERE.
Restaurant Performance
Number of Restaurants
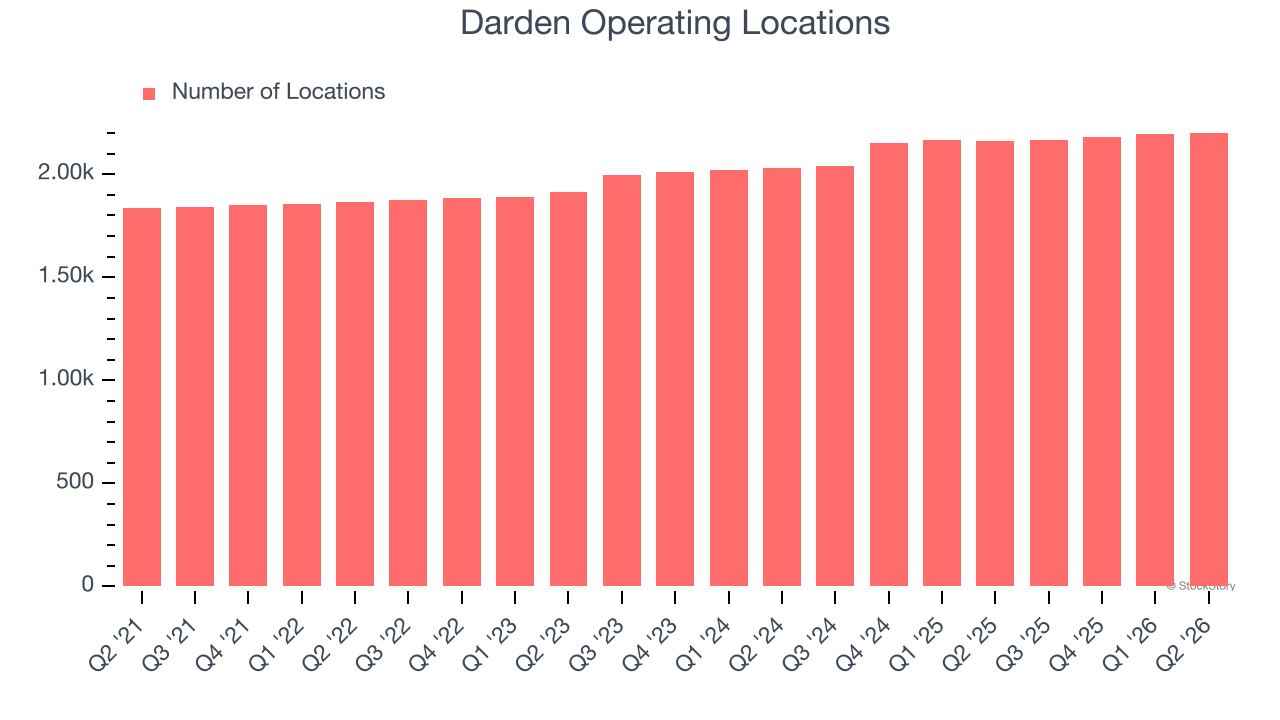
A restaurant chain’s total number of dining locations often determines how much revenue it can generate.
Darden sported 2,202 locations in the latest quarter. Over the last two years, it has opened new restaurants at a rapid clip by averaging 4.2% annual growth, among the fastest in the restaurant sector.
When a chain opens new restaurants, it usually means it’s investing for growth because there’s healthy demand for its meals and there are markets where its concepts have few or no locations.
Same-Store Sales
A company’s restaurant base only paints one part of the picture. When demand is high, it makes sense to open more. But when demand is low, it’s prudent to close some locations and use the money in other ways. Same-store sales is an industry measure of whether revenue is growing at those existing restaurants and is driven by customer visits (often called traffic) and the average spending per customer (ticket).
Darden’s demand has been healthy for a restaurant chain over the last two years. On average, the company has grown its same-store sales by a robust 3.1% per year. This performance suggests its rollout of new restaurants could be beneficial for shareholders. When a chain has demand, more locations should help it reach more customers and boost revenue growth.
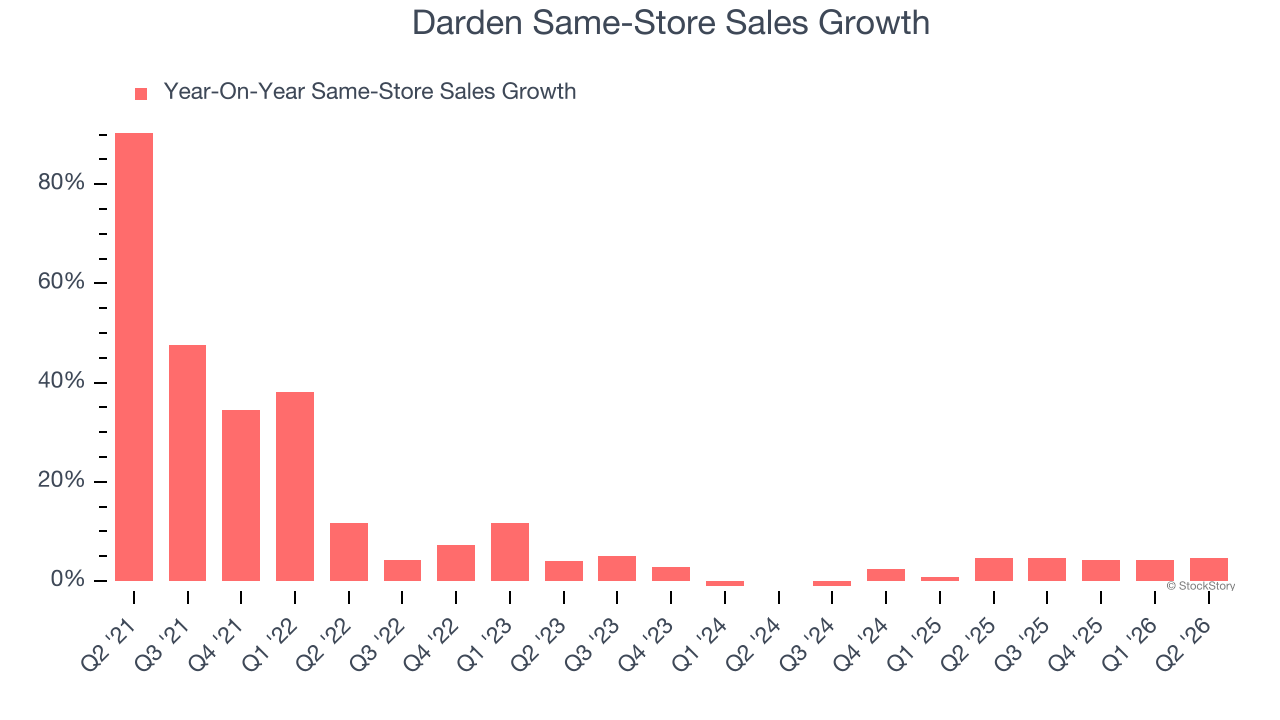
In the latest quarter, Darden’s same-store sales rose 4.6% year on year. This growth was an acceleration from its historical levels, which is always an encouraging sign.
Key Takeaways from Darden’s Q2 Results
It was good to see Darden narrowly top analysts’ same-store sales expectations this quarter. On the other hand, its full-year revenue guidance was in line and its EPS fell short of Wall Street’s estimates. Overall, this was a softer quarter. The stock remained flat at $212.75 immediately after reporting.
Is Darden an attractive investment opportunity right now? What happened in the latest quarter matters, but not as much as longer-term business quality and valuation, when deciding whether to invest in this stock. We cover that in our actionable full research report which you can read here (it’s free).