
IT distribution giant TD SYNNEX (NYSE: SNX) reported Q2 CY2026 results topping the market’s revenue expectations, with sales up 31% year on year to $19.57 billion. On top of that, next quarter’s revenue guidance ($18.6 billion at the midpoint) was surprisingly good and 10.4% above what analysts were expecting. Its non-GAAP profit of $4.85 per share was 17.6% above analysts’ consensus estimates.
Is now the time to buy TD SYNNEX? Find out by accessing our full research report, it’s free.
TD SYNNEX (SNX) Q2 CY2026 Highlights:
- Revenue: $19.57 billion vs analyst estimates of $16.79 billion (31% year-on-year growth, 16.6% beat)
- Adjusted EPS: $4.85 vs analyst estimates of $4.12 (17.6% beat)
- Revenue Guidance for Q3 CY2026 is $18.6 billion at the midpoint, above analyst estimates of $16.85 billion
- Adjusted EPS guidance for Q3 CY2026 is $4.50 at the midpoint, above analyst estimates of $4.00
- Operating Margin: 2.7%, in line with the same quarter last year
- Free Cash Flow was -$332.4 million, down from $542.9 million in the same quarter last year
- Market Capitalization: $22.28 billion
Company Overview
Serving as the crucial middleman in the technology supply chain, TD SYNNEX (NYSE: SNX) is a global technology distributor that connects thousands of IT manufacturers with resellers, helping businesses access hardware, software, and technology solutions.
Revenue Growth
Examining a company’s long-term performance can provide clues about its quality. Any business can have short-term success, but a top-tier one grows for years.
With $69.77 billion in revenue over the past 12 months, TD SYNNEX is a behemoth in the business services sector and benefits from economies of scale, giving it an edge in distribution. This also enables it to gain more leverage on its fixed costs than smaller competitors and the flexibility to offer lower prices.
As you can see below, TD SYNNEX’s 25.7% annualized revenue growth over the last five years was incredible. This is a great starting point for our analysis because it shows TD SYNNEX’s demand was higher than many business services companies.
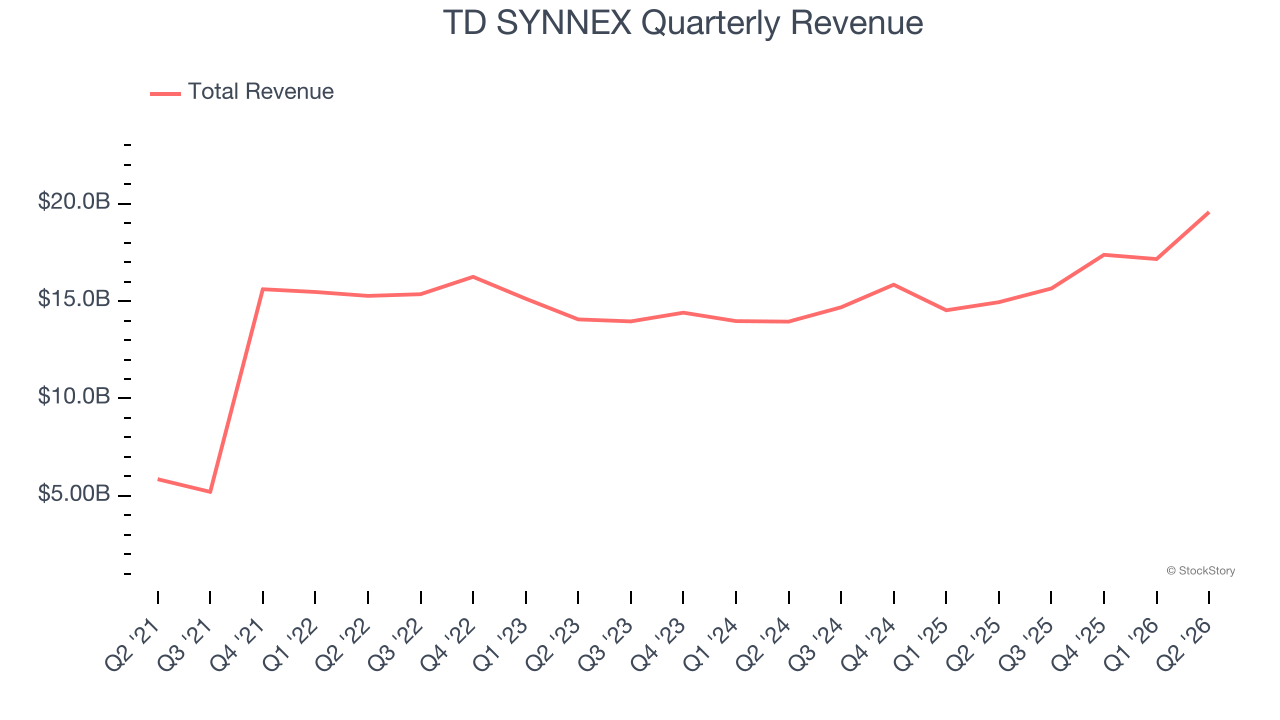
Long-term growth is the most important, but within business services, a half-decade historical view may miss new innovations or demand cycles. TD SYNNEX’s annualized revenue growth of 11.3% over the last two years is below its five-year trend, but we still think the results suggest healthy demand. 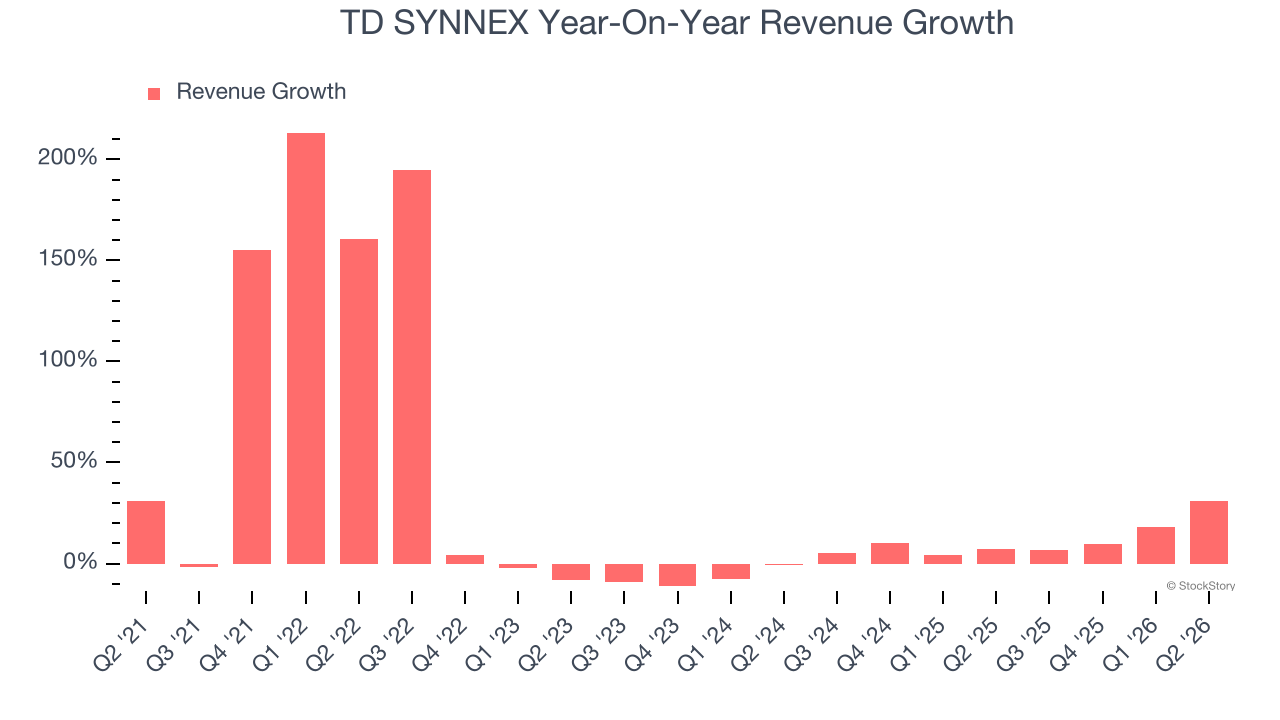
This quarter, TD SYNNEX reported wonderful year-on-year revenue growth of 31%, and its $19.57 billion of revenue exceeded Wall Street’s estimates by 16.6%. Company management is currently guiding for a 18.8% year-on-year increase in sales next quarter.
Looking further ahead, sell-side analysts expect revenue to remain flat over the next 12 months, a deceleration versus the last two years. This projection is underwhelming and indicates its products and services will see some demand headwinds. At least the company is tracking well in other measures of financial health.
WHILE YOU’RE HERE: The Next Palantir? One satellite company captures images of every point on Earth. Every single day. The Pentagon wants it. Hedge funds are using it to beat earnings. You’ve probably never heard of it.
This is what the early days of Palantir looked like before it became a $437 billion giant. Same playbook. Different technology. If you missed Palantir, you need to see this. Claim The Stock Ticker for Free HERE.
Adjusted Operating Margin
Adjusted operating margin is an important measure of profitability as it shows the portion of revenue left after accounting for all core expenses — everything from the cost of goods sold to advertising and wages. It’s also useful for comparing profitability across companies because it excludes non-recurring expenses, interest on debt, and taxes.
TD SYNNEX’s adjusted operating margin has generally stayed the same over the last 12 months, averaging 2.8% over the last five years. This profitability was lousy for a business services business and caused by its suboptimal cost structure.
Analyzing the trend in its profitability, TD SYNNEX’s adjusted operating margin might have fluctuated slightly but has generally stayed the same over the last five years. This raises questions about the company’s expense base because its revenue growth should have given it leverage on its fixed costs, resulting in better economies of scale and profitability.
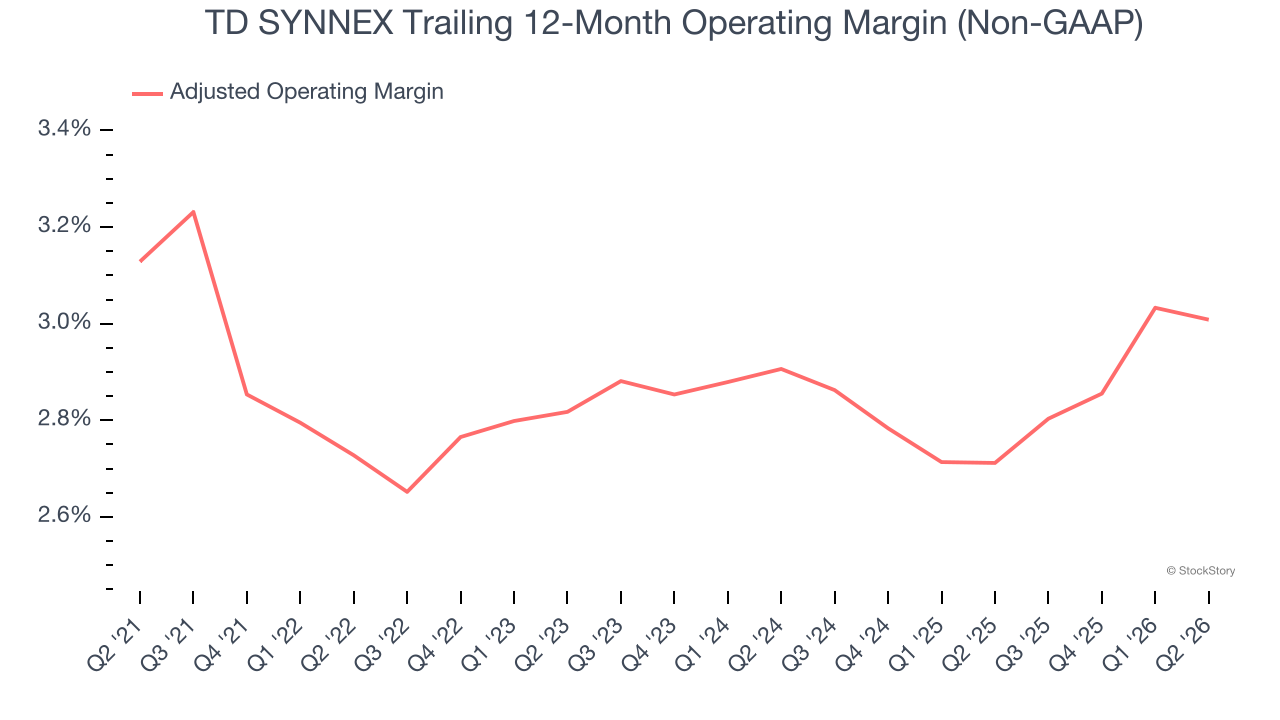
In Q2, TD SYNNEX generated an adjusted operating margin profit margin of 2.7%, in line with the same quarter last year. This indicates the company’s overall cost structure has been relatively stable.
Earnings Per Share
We track the long-term change in earnings per share (EPS) for the same reason as long-term revenue growth. Compared to revenue, however, EPS highlights whether a company’s growth is profitable.
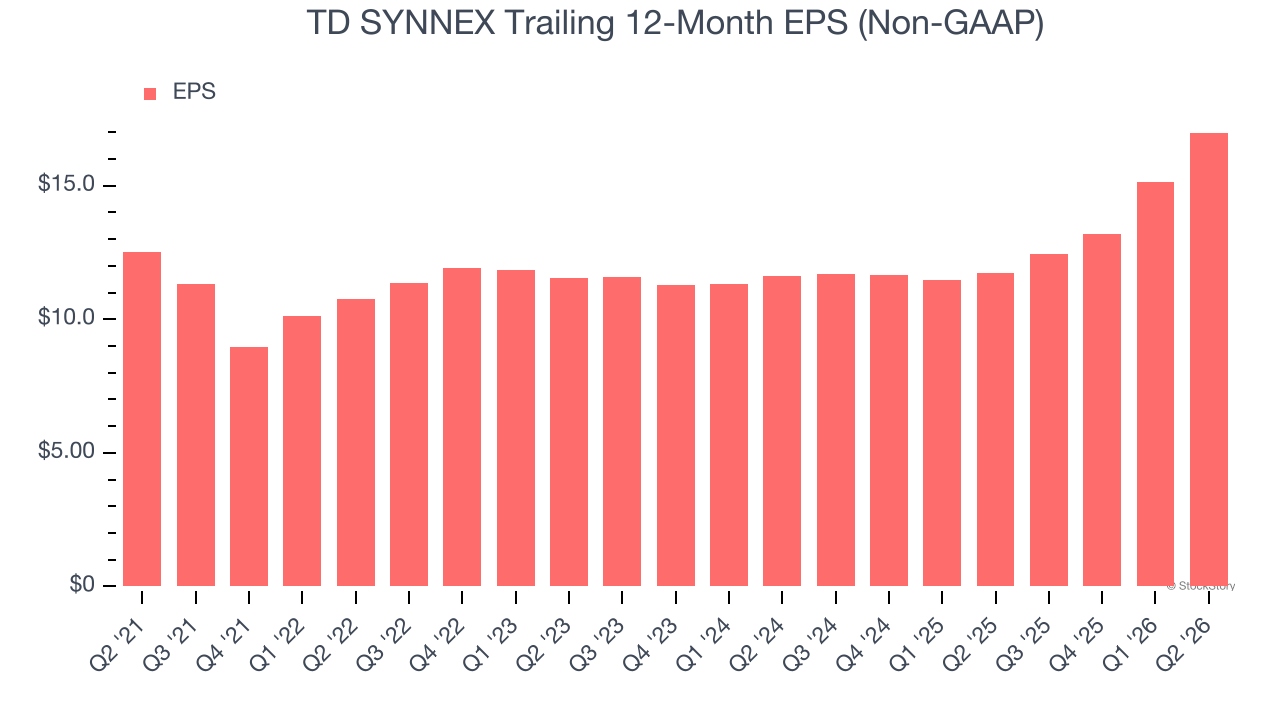
TD SYNNEX’s EPS grew at an unimpressive 6.3% compounded annual growth rate over the last five years, lower than its 25.7% annualized revenue growth. However, its adjusted operating margin didn’t change during this time, telling us that non-fundamental factors such as interest and taxes affected its ultimate earnings.
Like with revenue, we analyze EPS over a more recent period because it can provide insight into an emerging theme or development for the business.
For TD SYNNEX, its two-year annual EPS growth of 20.9% was higher than its five-year trend. This acceleration made it one of the faster-growing business services companies in recent history.
In Q2, TD SYNNEX reported adjusted EPS of $4.85, up from $2.99 in the same quarter last year. This print easily cleared analysts’ estimates, and shareholders should be content with the results. Over the next 12 months, Wall Street expects TD SYNNEX’s full-year EPS to grow 2.4% from $16.99 to $17.40.
Key Takeaways from TD SYNNEX’s Q2 Results
It was good to see TD SYNNEX beat analysts’ EPS expectations this quarter. We were also excited its EPS guidance for next quarter outperformed Wall Street’s estimates by a wide margin. Zooming out, we think this was a solid print. The stock traded up 6.6% to $301.85 immediately following the results.
TD SYNNEX put up rock-solid earnings, but one quarter doesn’t necessarily make the stock a buy. Let’s see if this is a good investment. If you’re making that decision, you should consider the bigger picture of valuation, business qualities, as well as the latest earnings. We cover that in our actionable full research report which you can read here (it’s free).