
Over the past six months, Radian Group has been a great trade, beating the S&P 500 by 11%. Its stock price has climbed to $37.80, representing a healthy 19.4% increase. This was partly due to its solid quarterly results, and the run-up might have investors contemplating their next move.
Is there a buying opportunity in Radian Group, or does it present a risk to your portfolio? Get the full stock story straight from our expert analysts, it’s free.
Why Is Radian Group Not Exciting?
We’re happy investors have made money, but we’re cautious about Radian Group. Here are three reasons you should be careful with RDN, plus one stock we’d rather own.
1. Long-Term Revenue Growth Flatter Than a Pancake
Big picture, insurers generate revenue from three key sources. The first is the core business of underwriting policies. The second source is income from investing the “float” (premiums collected upfront not yet paid out as claims) in assets such as fixed-income assets and equities. The third is fees from various sources such as policy administration, annuities, or other value-added services.
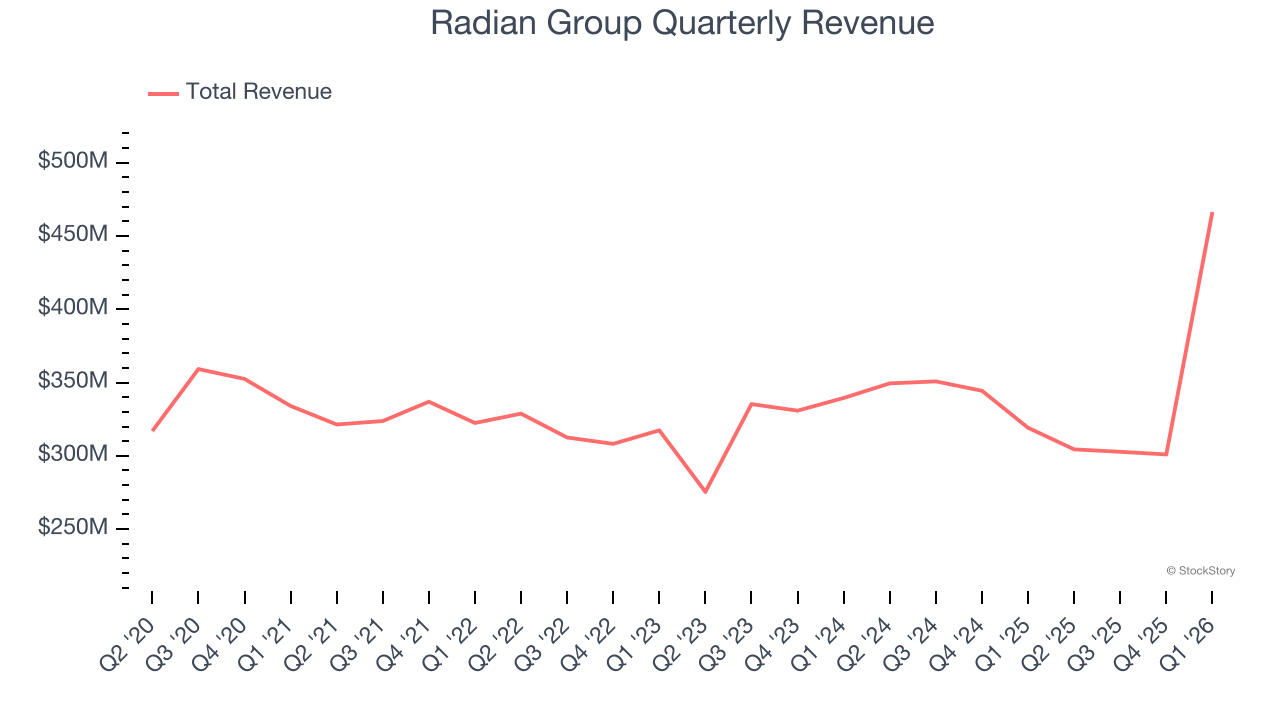
Unfortunately, Radian Group struggled to consistently increase demand as its $1.37 billion of revenue for the trailing 12 months was close to its revenue five years ago. This wasn’t a great result and signals it’s a lower quality business.
2. Net Premiums Earned Hit a Plateau
Insurers sell policies then use reinsurance (insurance for insurance companies) to protect themselves from large losses. Net premiums earned are therefore what's collected from selling policies less what’s paid to reinsurers as a risk mitigation tool.
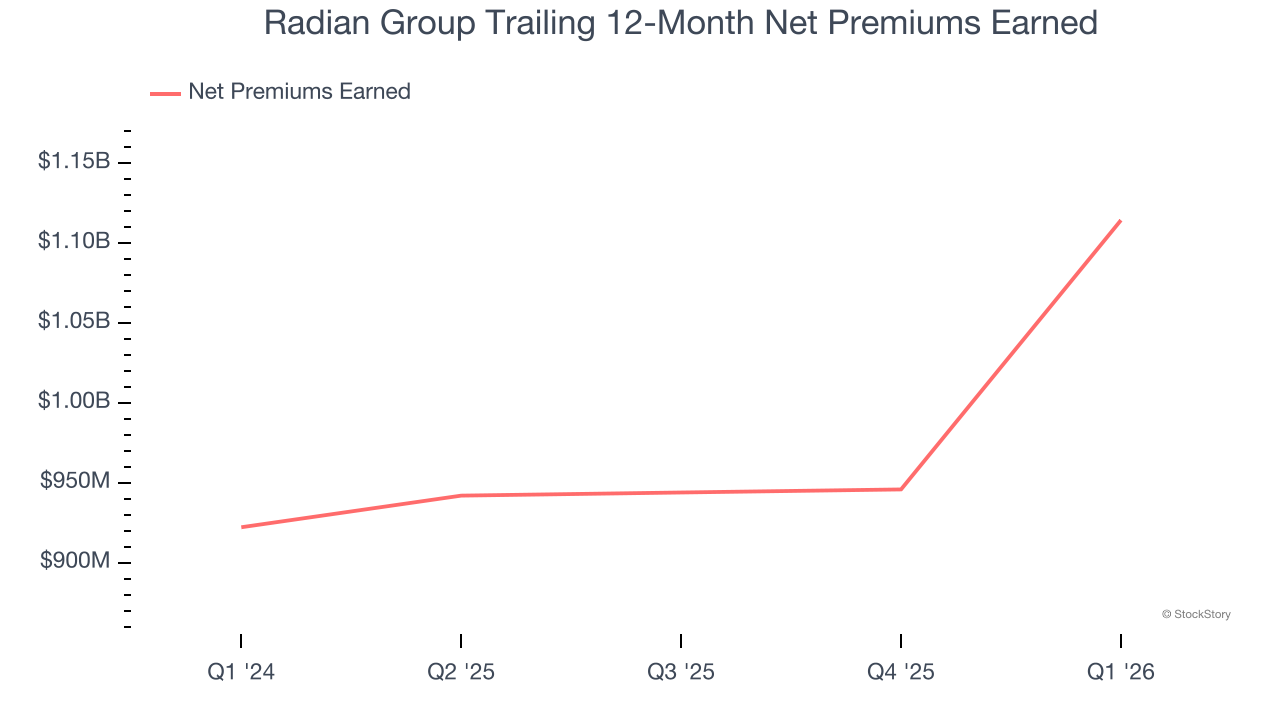
Radian Group’s net premiums earned was flat over the last five years, much worse than the broader insurance industry and in line with its total revenue.
3. Recent EPS Growth Below Our Standards
While long-term earnings trends give us the big picture, we also track EPS over a shorter period because it can provide insight into an emerging theme or development for the business.
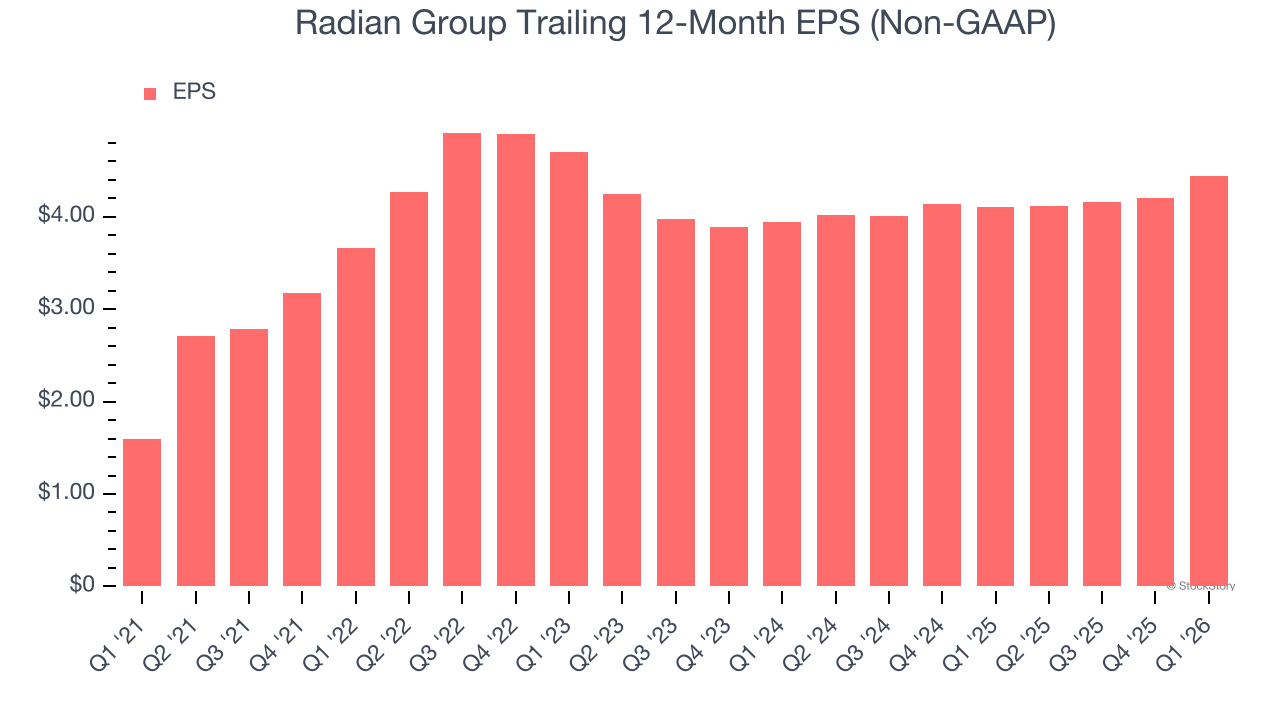
Radian Group’s EPS grew at a weak 6.2% compounded annual growth rate over the last two years. On the bright side, this performance was higher than its 3.6% annualized revenue growth and tells us the company became more profitable on a per-share basis as it expanded.
Final Judgment
Radian Group isn’t a terrible business, but it isn’t one of our picks. With its shares beating the market recently, the stock trades at 1× forward P/B (or $37.80 per share). While this valuation is fair, the upside isn’t great compared to the potential downside. We’re pretty confident there are superior stocks to buy right now. We’d recommend looking at one of our top digital advertising picks.
Stocks We Like More Than Radian Group
ONE MORE THING: Top 6 Stocks for This Week. This market is separating quality stocks from expensive ones fast. AI is taking down whole sectors with no warning. In a rotation this fast, you need more than a list of good companies.
Our AI system flagged Palantir before it ran 1,662%. AppLovin before it ran 753%. Nvidia before it ran 1,178%. Each week it produces 6 new names that pass the same tests. Get Our Top 6 Stocks for Free HERE.
Stocks that have made our list include now familiar names such as Nvidia (+1,326% between June 2020 and June 2025) as well as under-the-radar businesses like the once-small-cap company Comfort Systems (+782% five-year return). Find your next big winner with StockStory today.