Transocean has had an impressive run over the past six months as its shares have beaten the S&P 500 by 13.7%. The stock now trades at $5.39, marking a 23.1% gain. This was partly thanks to its solid quarterly results, and the run-up might have investors contemplating their next move.
Is now the time to buy Transocean, or should you be careful about including it in your portfolio? Check out our in-depth research report to see what our analysts have to say, it’s free.
Why Do We Think Transocean Will Underperform?
We’re happy investors have made money, but we’re cautious about Transocean. Here are three reasons why there are better opportunities than RIG, plus one stock we’d rather own.
1. Long-Term Revenue Growth Disappoints
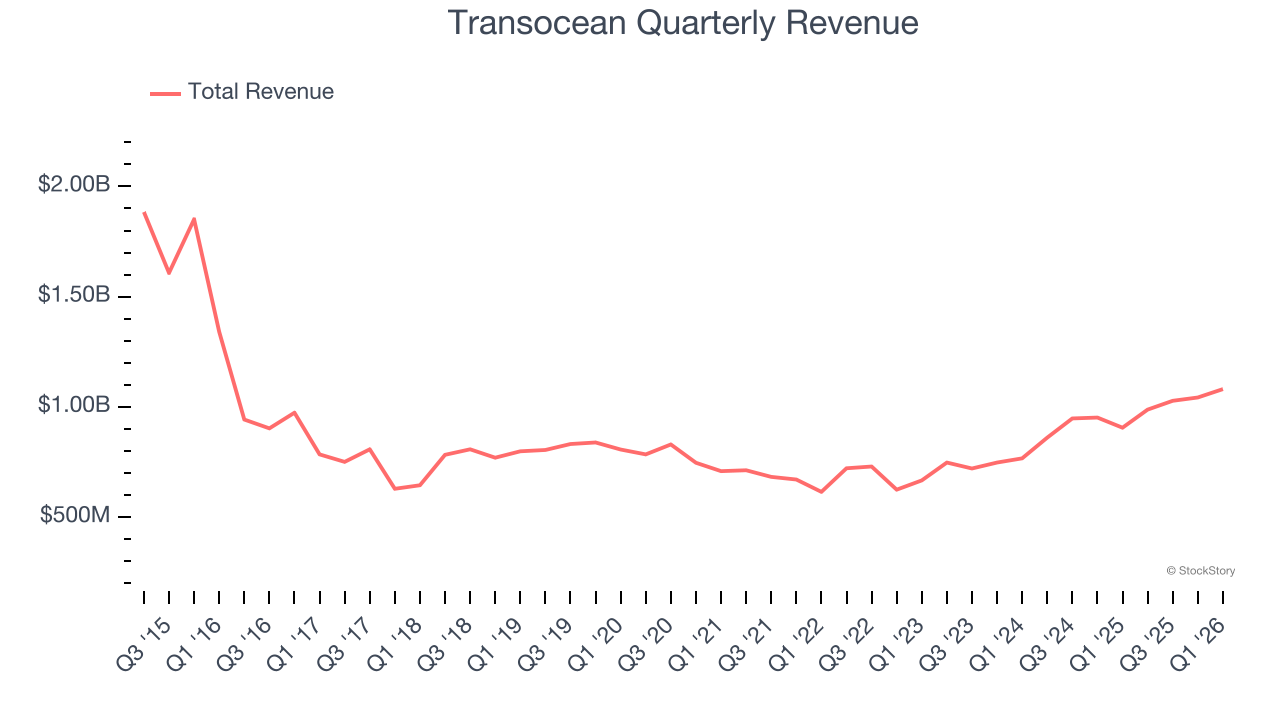
A company’s long-term performance can give signals about its business quality. Even a bad business, especially in a cyclical industry, can shine for a year or so, but a top-tier one should exhibit resilience through cycles. Regrettably, Transocean’s sales grew at a sluggish 6.2% compounded annual growth rate over the last five years. This fell short of our benchmark for the energy upstream and integrated energy sector.
2. Low Gross Margin Reveals Weak Structural Profitability
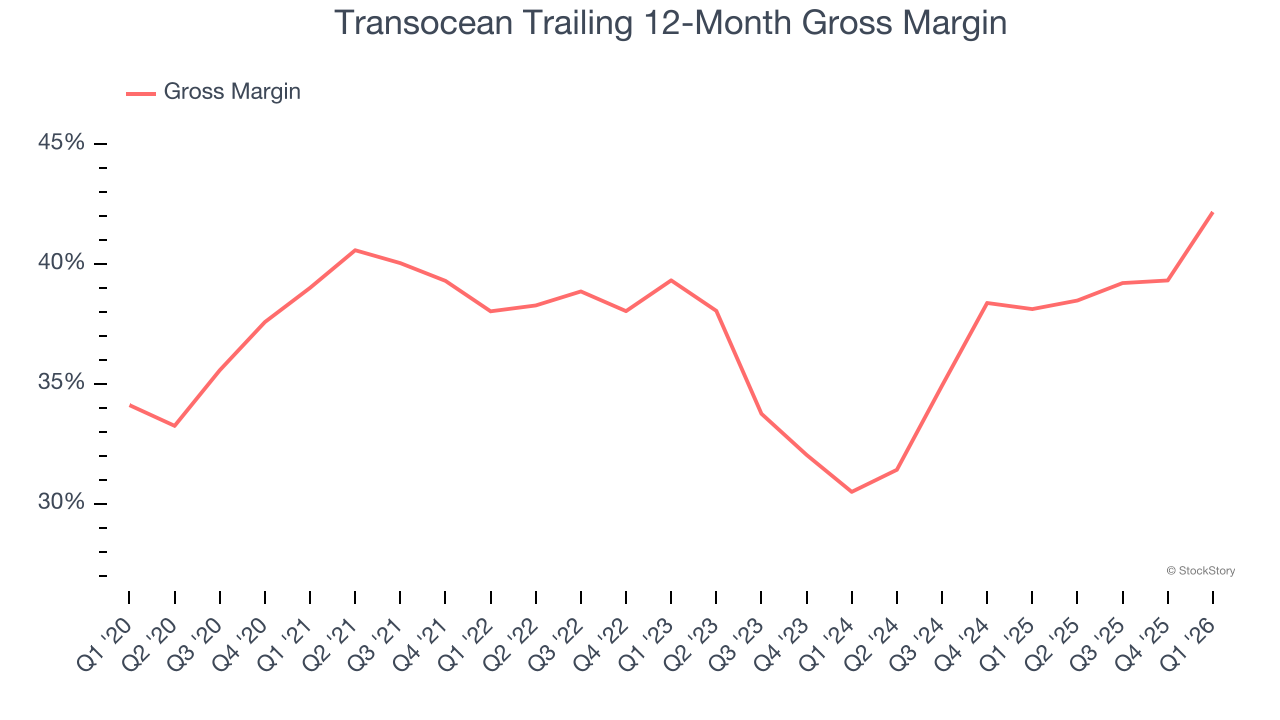
In any given year, energy gross margins are heavily influenced by prices, hedging, and cost inflation, but over a full cycle these gross margins reveal which producers are structurally advantaged through superior “rock” quality, infrastructure access, and cost position.
Transocean, which averaged 37.9% gross margin over the last five years, exhibits poor unit economics in the sector. It means the company will struggle more at lower commodity prices than peers with better gross margins.
3. Mediocre Free Cash Flow Margin Limits Reinvestment Potential
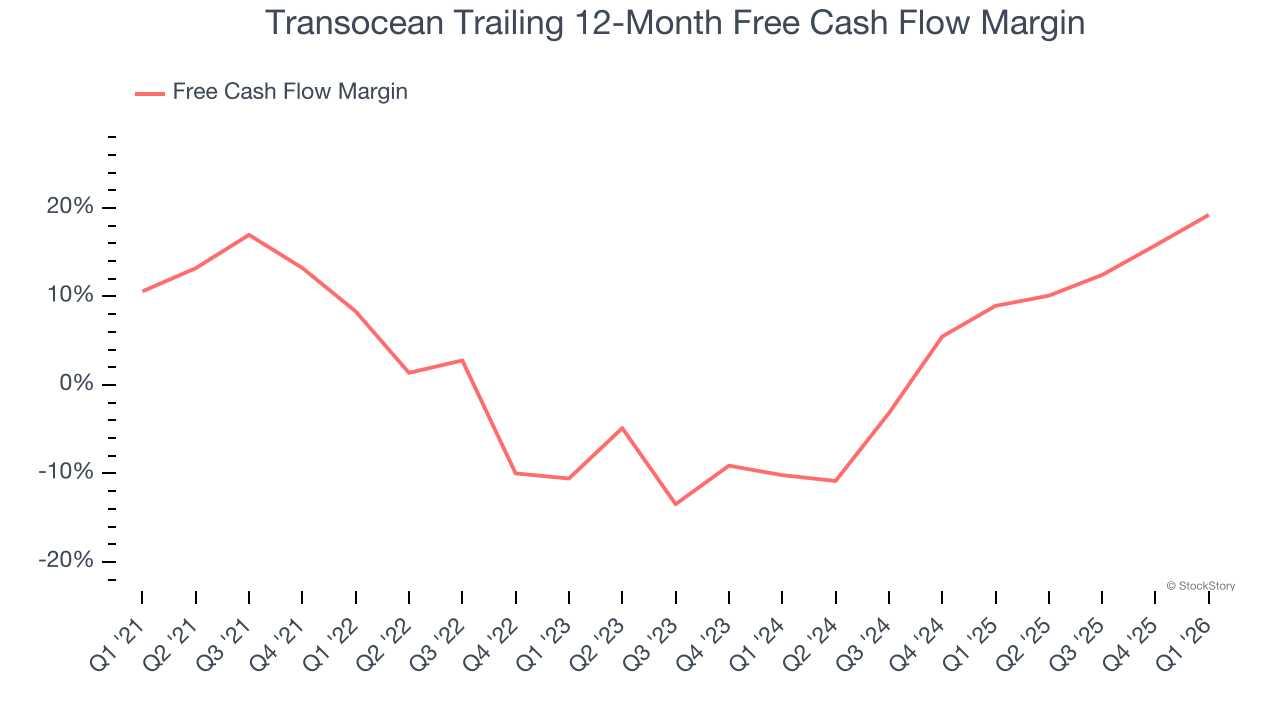
Free cash flow isn’t a prominently featured metric in company financials and earnings releases, but we think it’s telling because it accounts for all operating and capital expenses, making it tough to manipulate. Cash is king.
Transocean has shown weak cash profitability relative to peers over the last five years, giving the company fewer opportunities to return capital to shareholders. Its free cash flow margin averaged 4.6%, below what we’d expect for an upstream and integrated energy business.
Final Judgment
We cheer for all companies serving everyday consumers, but in the case of Transocean, we’ll be cheering from the sidelines. With its shares outperforming the market lately, the stock trades at 26.7× forward P/E (or $5.39 per share). This valuation tells us a lot of optimism is priced in - you can find more timely opportunities elsewhere. We’d suggest looking at one of our top digital advertising picks.
Stocks We Would Buy Instead of Transocean
ONE MORE THING: Top 6 Stocks for This Week. This market is separating quality stocks from expensive ones fast. AI is taking down whole sectors with no warning. In a rotation this fast, you need more than a list of good companies.
Our AI system flagged Palantir before it ran 1,662% between October 2022 and February 2026. AppLovin before it ran 753% between February 2024 and February 2026. Nvidia before it ran 1,178% between January 2023 and February 2026. Each week it produces 6 new names that pass the same tests. Get Our Top 6 Stocks for Free HERE.
Stocks that have made our list include now familiar names such as Nvidia (+1,460% between June 2020 and June 2025) as well as under-the-radar businesses like the once-small-cap company Exlservice (+271% between June 2020 and June 2025). Find your next big winner with StockStory today.