Jack in the Box has gotten torched over the last six months - since January 2026, its stock price has dropped 31.6% to $14.85 per share. This might have investors contemplating their next move.
Is there a buying opportunity in Jack in the Box, or does it present a risk to your portfolio? See what our analysts have to say in our full research report, it’s free.
Why Do We Think Jack in the Box Will Underperform?
Even with the cheaper entry price, we’re sitting this one out for now. Here are three reasons why JACK doesn’t excite us, plus one stock we’d rather own.
1. Restaurants Are Closing, a Headwind for Revenue
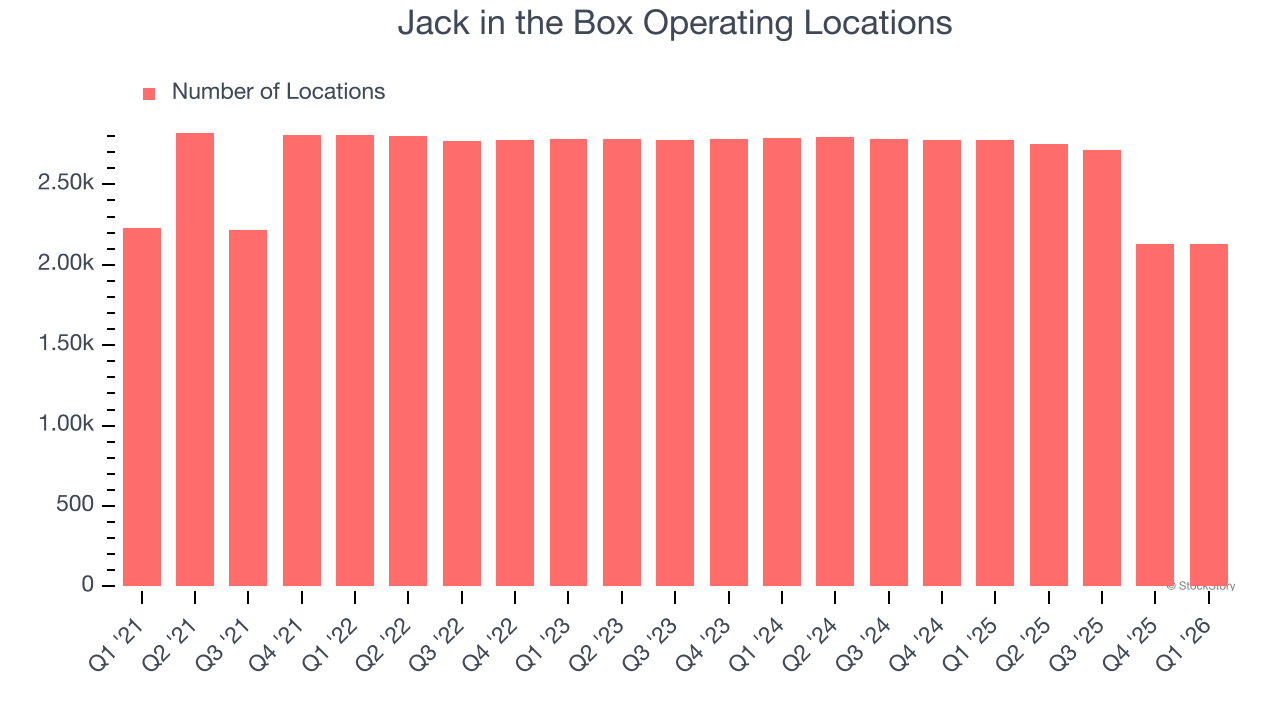
A restaurant chain’s total number of dining locations often determines how much revenue it can generate.
Jack in the Box operated 2,128 locations in the latest quarter. Over the last two years, the company has generally closed its restaurants, averaging 6.4% annual declines.
When a chain shutters restaurants, it usually means demand for its meals is waning, and it is responding by closing underperforming locations to improve profitability.
2. Shrinking Same-Store Sales Indicate Waning Demand
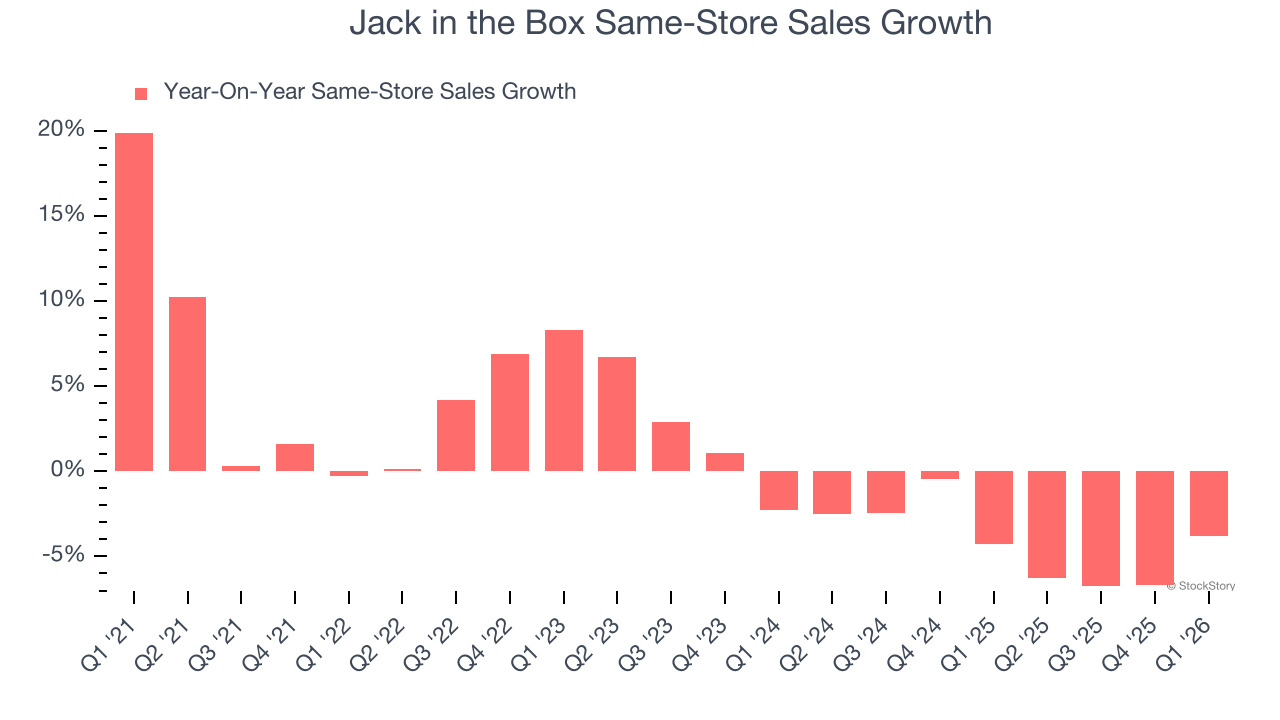
Same-store sales show the change in sales at restaurants open for at least a year. This is a key performance indicator because it measures organic growth.
Jack in the Box’s demand has been shrinking over the last two years as its same-store sales have averaged 4.2% annual declines.
3. High Debt Levels Increase Risk
As long-term investors, the risk we care about most is the permanent loss of capital, which can happen when a company goes bankrupt or raises money from a disadvantaged position. This is separate from short-term stock price volatility, something we are much less bothered by.
Jack in the Box’s $2.61 billion of debt exceeds the $43.04 million of cash on its balance sheet. Furthermore, its 12× net-debt-to-EBITDA ratio (based on its EBITDA of $222 million over the last 12 months) shows the company is overleveraged.
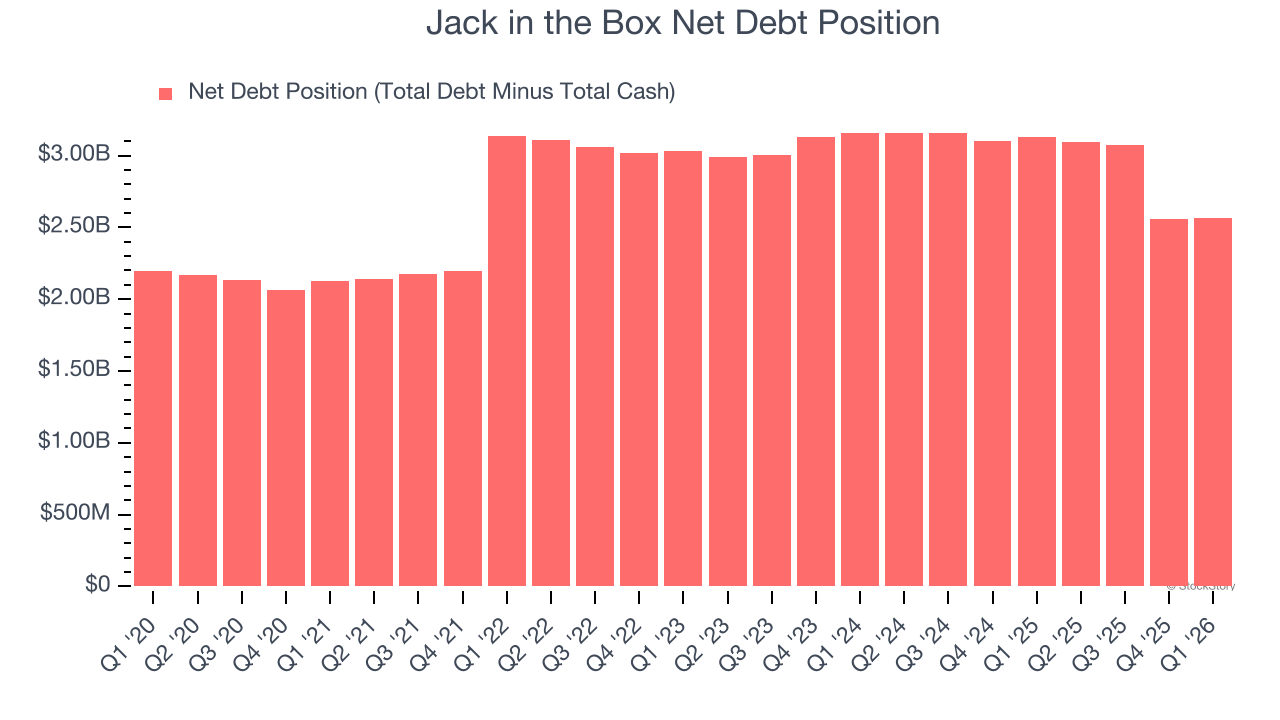
At this level of debt, incremental borrowing becomes increasingly expensive and credit agencies could downgrade the company’s rating if profitability falls. Jack in the Box could also be backed into a corner if the market turns unexpectedly – a situation we seek to avoid as investors in high-quality companies.
We hope Jack in the Box can improve its balance sheet and remain cautious until it increases its profitability or pays down its debt.
Final Judgment
Jack in the Box doesn’t pass our quality test. Following the recent decline, the stock trades at 4.1× forward P/E (or $14.85 per share). While this valuation is optically cheap, the potential downside is huge given its shaky fundamentals. There are superior stocks to buy right now. We’d suggest looking at the most entrenched endpoint security platform on the market.
High-Quality Stocks for All Market Conditions
ALSO WORTH WATCHING: Top 5 Momentum Stocks. The best time to own a great stock is when the market is finally noticing it. These aren’t just high-quality businesses. Something is happening with them right now. Elite fundamentals meet near-term momentum — both boxes checked at the same time.
Find out which stocks our AI platform is flagging this week. See this week’s Strong Momentum stocks — FREE. Get Our Strong Momentum Stocks for Free HERE.
Stocks that have made our list include now familiar names such as Nvidia (+1,460% between June 2020 and June 2025) as well as under-the-radar businesses like the once-small-cap company Comfort Systems (+1,154% between June 2020 and June 2025). Find your next big winner with StockStory today.