Casual restaurant chain Brinker International (NYSE: EAT) met Wall Street’s revenue expectations in Q2 CY2026, with sales up 5.1% year on year to $1.54 billion. The company’s full-year revenue guidance of $6.21 billion at the midpoint came in 1.1% above analysts’ estimates. Its non-GAAP profit of $3.07 per share was 0.5% below analysts’ consensus estimates.
Is now the time to buy Brinker International? Find out by accessing our full research report, it’s free.
Brinker International (EAT) Q2 CY2026 Highlights:
- Revenue: $1.54 billion vs analyst estimates of $1.53 billion (5.1% year-on-year growth, in line)
- Adjusted EPS: $3.07 vs analyst expectations of $3.09 (0.5% miss)
- Adjusted EBITDA: $227.6 million vs analyst estimates of $232.5 million (14.8% margin, 2.1% miss)
- Adjusted EPS guidance for the upcoming financial year 2027 is $13 at the midpoint, beating analyst estimates by 4%
- Operating Margin: 10.9%, up from 9.8% in the same quarter last year
- Free Cash Flow Margin: 10.4%, up from 7.3% in the same quarter last year
- Locations: 1,635 at quarter end, up from 1,628 in the same quarter last year
- Same-Store Sales rose 5.1% year on year (19.8% in the same quarter last year)
- Market Capitalization: $9.49 billion
"Q4 2026 completes five consecutive years of Chili's same-store sales growth, delivering an unprecedented 71% cumulative increase over that time," said Kevin Hochman, President and CEO of Brinker International.
Company Overview
Founded by Norman Brinker in Dallas, Brinker International (NYSE: EAT) is a casual restaurant chain that operates the Chili’s, Maggiano’s Little Italy, and It’s Just Wings banners.
Revenue Growth
A company’s long-term sales performance is one signal of its overall quality. Any business can put up a good quarter or two, but the best consistently grow over the long haul.
With $5.81 billion in revenue over the past 12 months, Brinker International is one of the larger restaurant chains in the industry and benefits from a well-known brand that influences consumer purchasing decisions.
As you can see below, Brinker International grew its sales at a decent 8.8% compounded annual growth rate over the last seven years despite not opening many new restaurants, implying that growth was driven by higher sales at existing, established dining locations.
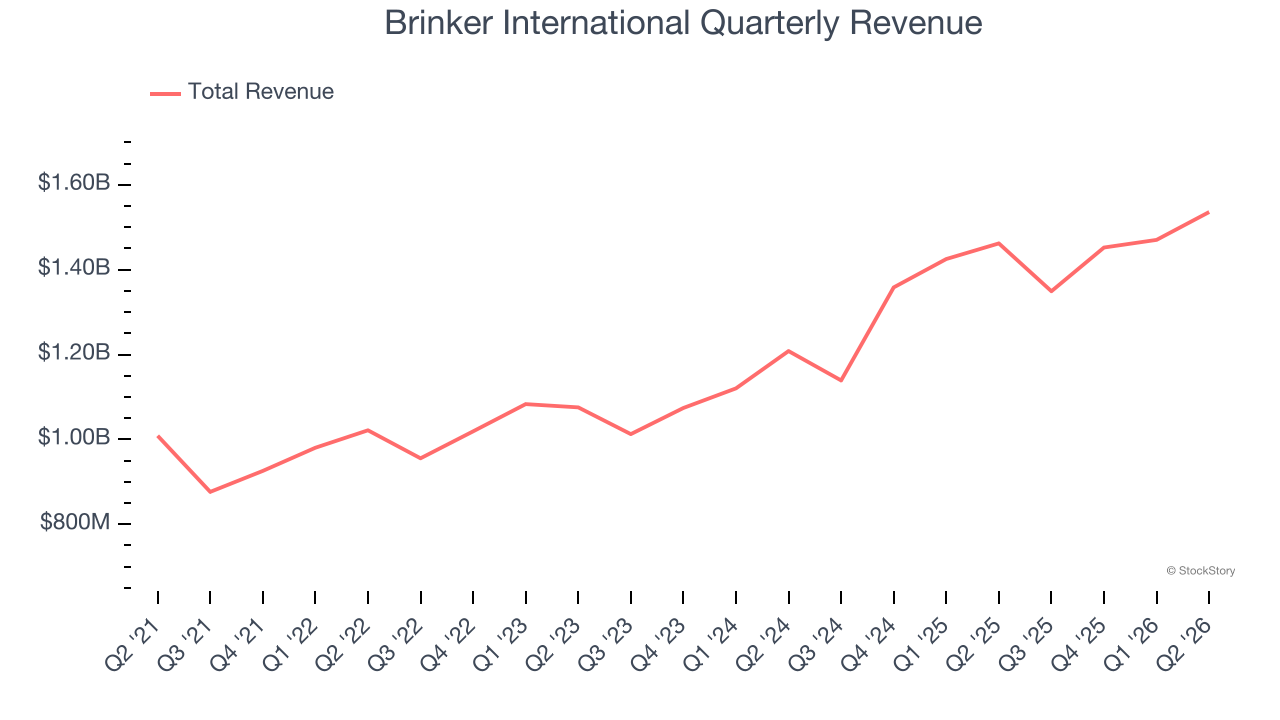
This quarter, Brinker International grew its revenue by 5.1% year on year, and its $1.54 billion of revenue was in line with Wall Street’s estimates.
Looking ahead, sell-side analysts expect revenue to grow 6.1% over the next 12 months, a slight deceleration versus the last seven years. This projection doesn’t excite us and indicates its menu offerings will see some demand headwinds. At least the company is tracking well in other measures of financial health.
ONE MORE THING: 3 Hidden Platforms Growing 3X Faster than Amazon, Google, and PayPal. Amazon, Google, and Meta all followed the same playbook: Dominate an ignored market. Build an unbeatable moat. Scale until you’re unstoppable.
These three platforms are running that exact playbook right now. The early investors in Amazon made fortunes. The early investors in these could do the same. Get All 3 Stocks Here for FREE.
Restaurant Performance
Number of Restaurants
The number of dining locations a restaurant chain operates is a critical driver of how quickly company-level sales can grow.
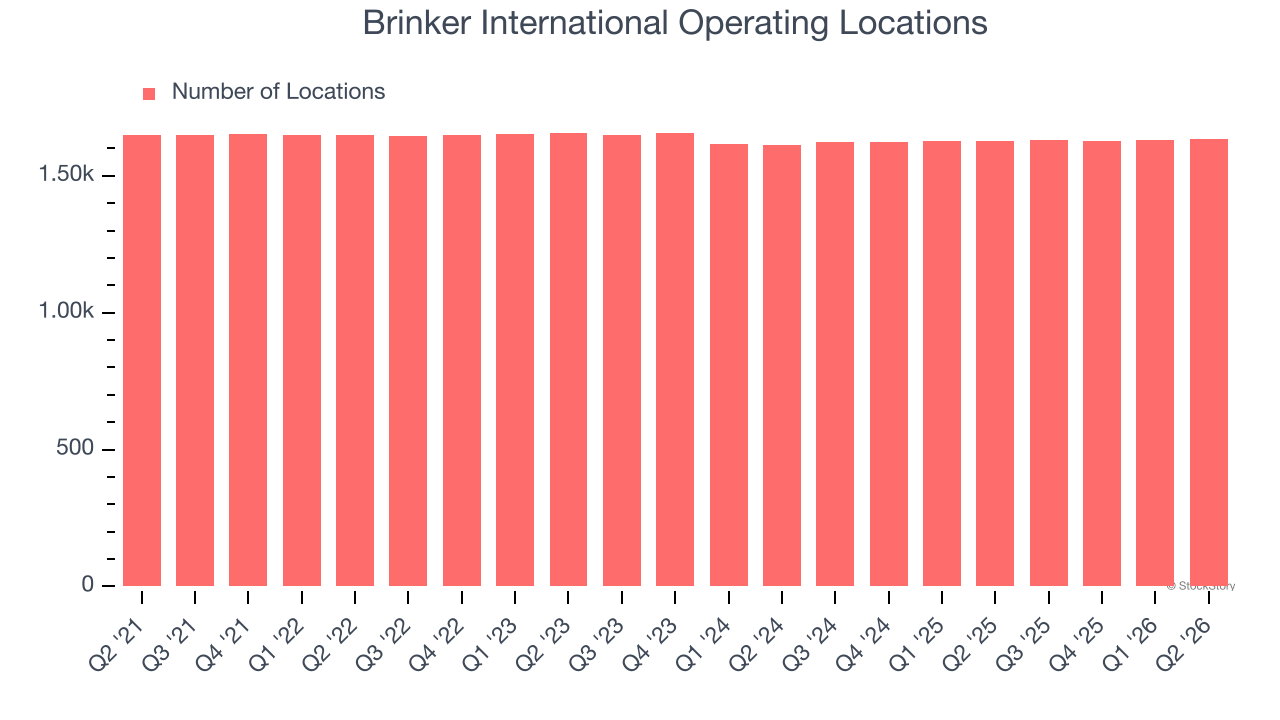
Brinker International operated 1,635 locations in the latest quarter, and over the last two years, has kept its restaurant count flat while other restaurant businesses have opted for growth.
When a chain doesn’t open many new restaurants, it usually means there’s stable demand for its meals and it’s focused on improving operational efficiency to increase profitability.
Same-Store Sales
The change in a company’s restaurant base only tells one side of the story. The other is the performance of its existing locations, which informs management teams whether they should expand or downsize their physical footprints. Same-store sales provides a deeper understanding of this issue because it measures organic growth at restaurants open for at least a year.
Brinker International has been one of the most successful restaurant chains over the last two years thanks to skyrocketing demand within its existing dining locations. On average, the company has posted exceptional year-on-year same-store sales growth of 14.6%. Given its flat restaurant base over the same period, this performance stems from a mixture of higher prices and increased foot traffic at existing locations.
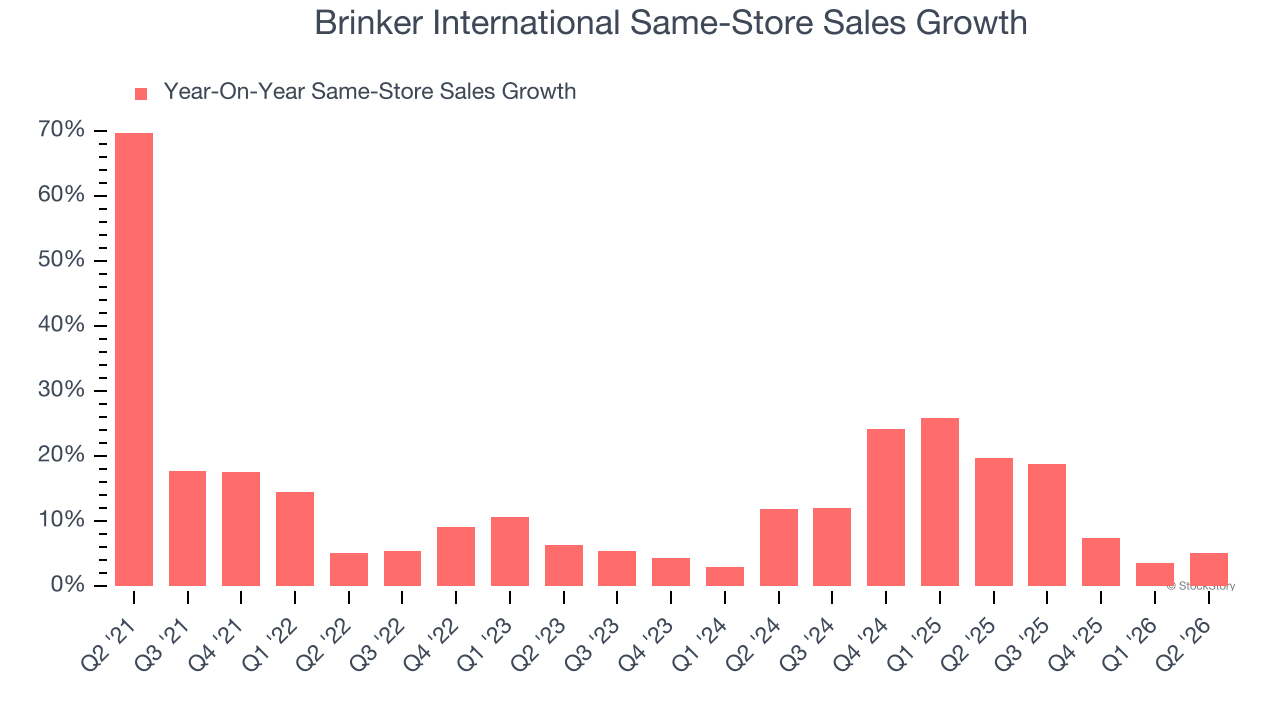
In the latest quarter, Brinker International’s same-store sales rose 5.1% year on year. This was a meaningful deceleration from its historical levels. We’ll be watching closely to see if Brinker International can reaccelerate growth.
Key Takeaways from Brinker International’s Q2 Results
It was great to see Brinker International’s full-year EPS guidance top analysts’ expectations. We were also glad its full-year revenue guidance slightly exceeded Wall Street’s estimates. On the other hand, its EBITDA missed. Overall, this print had some key positives. The stock traded up 2.3% to $226.50 immediately after reporting.
Is Brinker International an attractive investment opportunity at the current price? The latest quarter does matter, but not nearly as much as longer-term fundamentals and valuation, when deciding if the stock is a buy. We cover that in our actionable full research report which you can read here (it’s free).