

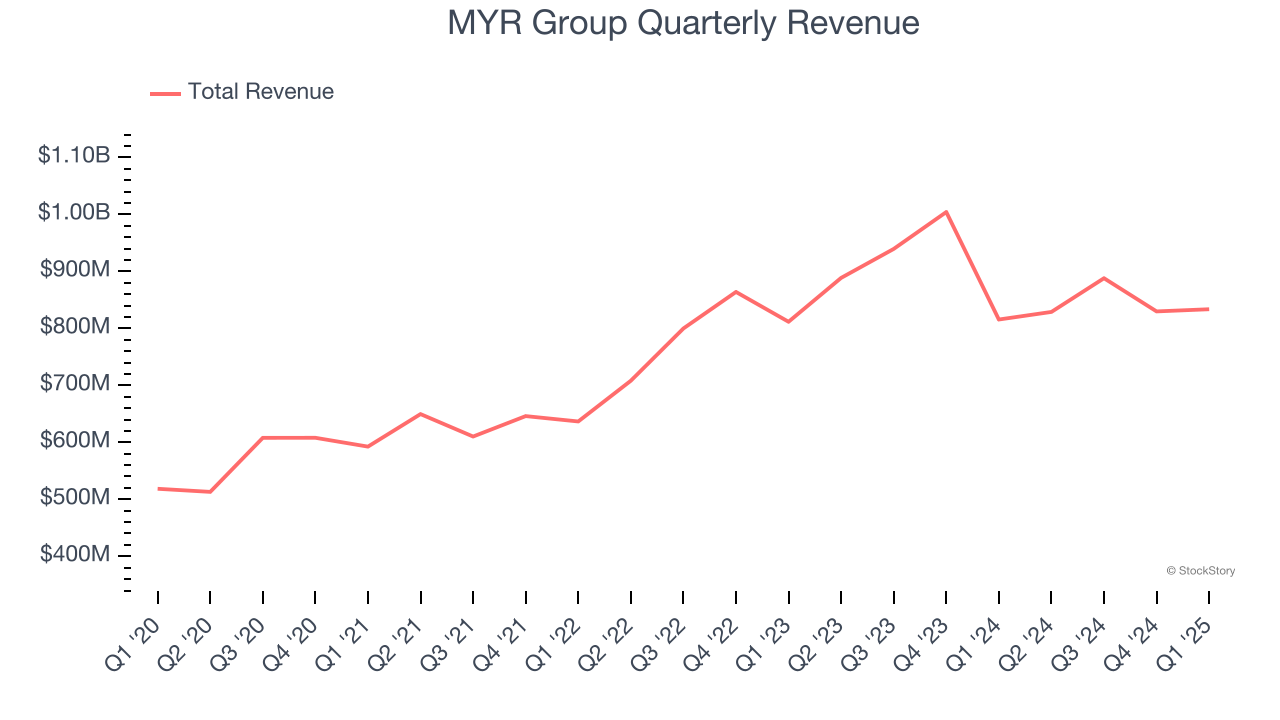
Electrical construction and infrastructure services provider MYR Group (NASDAQ: MYRG) beat Wall Street’s revenue expectations in Q1 CY2025, with sales up 2.2% year on year to $833.6 million. Its GAAP profit of $1.45 per share was 23.5% above analysts’ consensus estimates.
Is now the time to buy MYR Group? Find out by accessing our full research report, it’s free.
MYR Group (MYRG) Q1 CY2025 Highlights:
- Revenue: $833.6 million vs analyst estimates of $794.3 million (2.2% year-on-year growth, 5% beat)
- EPS (GAAP): $1.45 vs analyst estimates of $1.17 (23.5% beat)
- Adjusted EBITDA: $50.18 million vs analyst estimates of $46.94 million (6% margin, 6.9% beat)
- Operating Margin: 4.1%, up from 3% in the same quarter last year
- Free Cash Flow was $70.22 million, up from -$18.09 million in the same quarter last year
- Backlog: $2.64 billion at quarter end, up 8.9% year on year
- Market Capitalization: $2.03 billion
Company Overview
Constructing electrical and phone lines in the American Midwest dating back to the 1890s, MYR Group (NASDAQ: MYRG) is a specialty contractor in the electrical construction industry.
Sales Growth
A company’s long-term performance is an indicator of its overall quality. Even a bad business can shine for one or two quarters, but a top-tier one grows for years. Thankfully, MYR Group’s 9.8% annualized revenue growth over the last five years was solid. Its growth beat the average industrials company and shows its offerings resonate with customers.
We at StockStory place the most emphasis on long-term growth, but within industrials, a half-decade historical view may miss cycles, industry trends, or a company capitalizing on catalysts such as a new contract win or a successful product line. MYR Group’s recent performance shows its demand has slowed as its annualized revenue growth of 3% over the last two years was below its five-year trend. 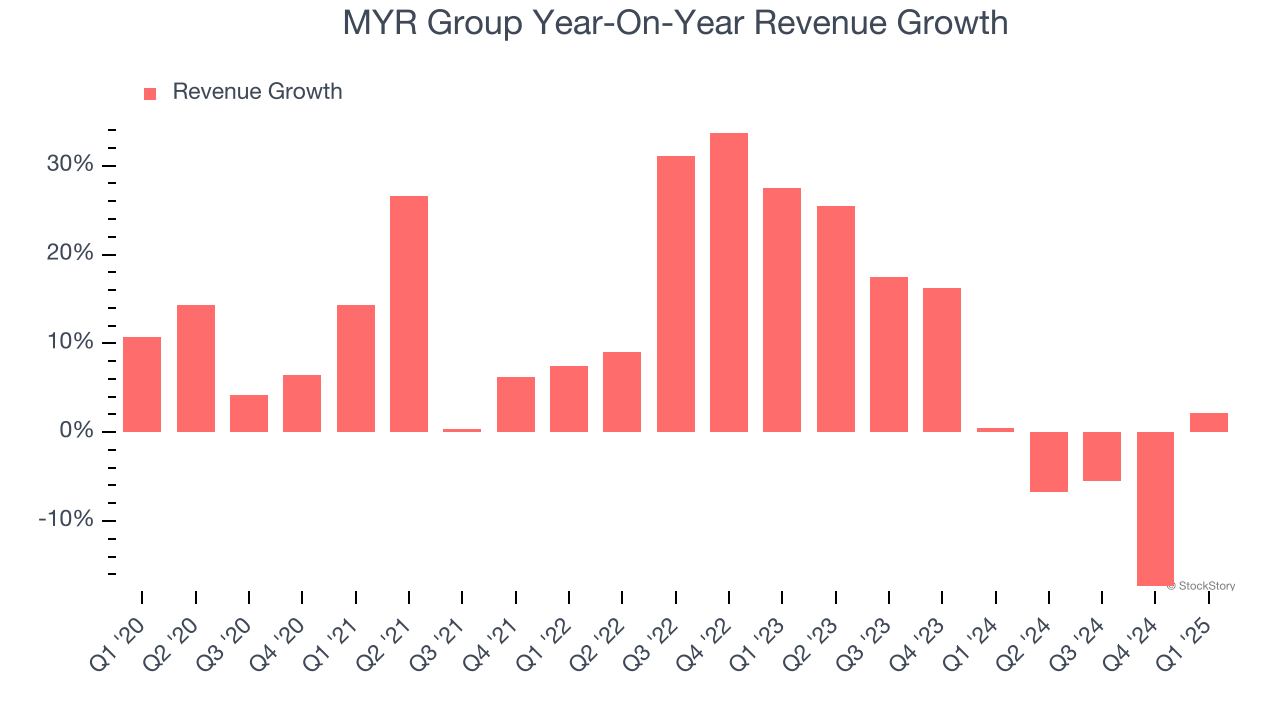
We can dig further into the company’s revenue dynamics by analyzing its backlog, or the value of its outstanding orders that have not yet been executed or delivered. MYR Group’s backlog reached $2.64 billion in the latest quarter and averaged 1.6% year-on-year growth over the last two years. Because this number is in line with its revenue growth, we can see the company effectively balanced its new order intake and fulfillment processes. 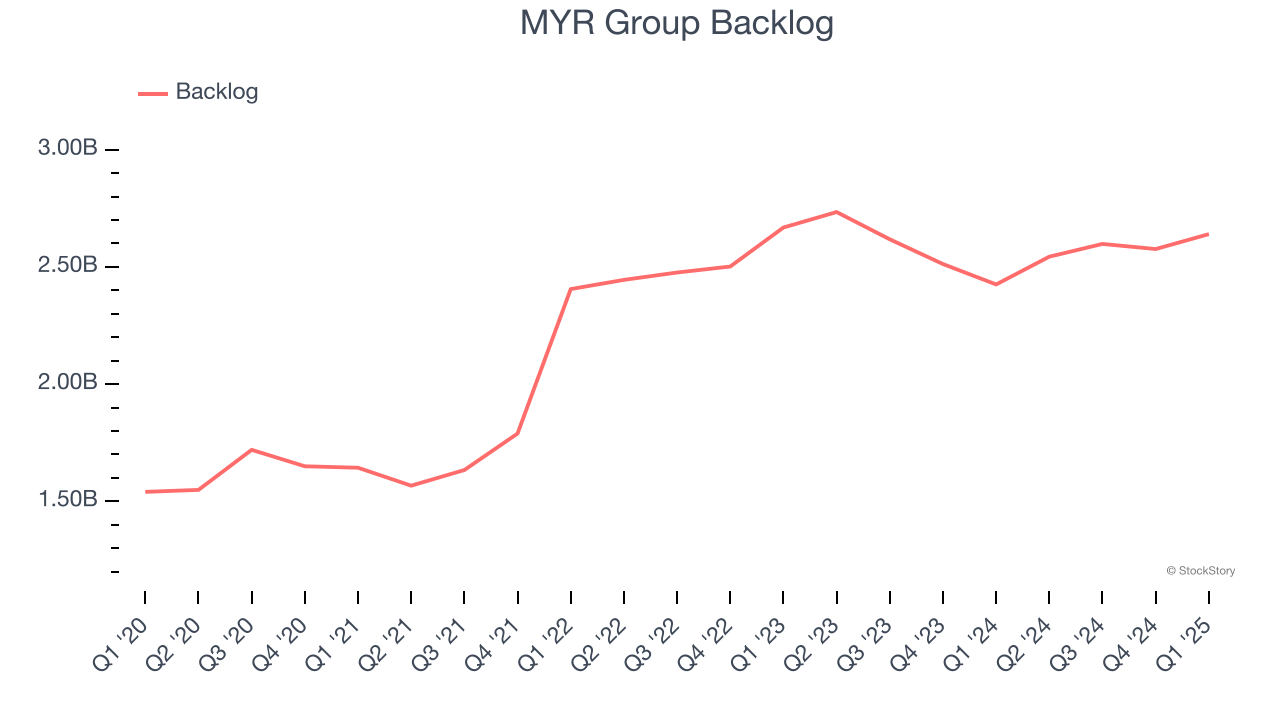
This quarter, MYR Group reported modest year-on-year revenue growth of 2.2% but beat Wall Street’s estimates by 5%.
Looking ahead, sell-side analysts expect revenue to grow 5.8% over the next 12 months. While this projection suggests its newer products and services will spur better top-line performance, it is still below average for the sector.
Software is eating the world and there is virtually no industry left that has been untouched by it. That drives increasing demand for tools helping software developers do their jobs, whether it be monitoring critical cloud infrastructure, integrating audio and video functionality, or ensuring smooth content streaming. Click here to access a free report on our 3 favorite stocks to play this generational megatrend.
Operating Margin
Operating margin is a key measure of profitability. Think of it as net income - the bottom line - excluding the impact of taxes and interest on debt, which are less connected to business fundamentals.
MYR Group was profitable over the last five years but held back by its large cost base. Its average operating margin of 3.5% was weak for an industrials business. This result isn’t too surprising given its low gross margin as a starting point.
Looking at the trend in its profitability, MYR Group’s operating margin decreased by 2.3 percentage points over the last five years. This raises questions about the company’s expense base because its revenue growth should have given it leverage on its fixed costs, resulting in better economies of scale and profitability. MYR Group’s performance was poor no matter how you look at it - it shows that costs were rising and it couldn’t pass them onto its customers.
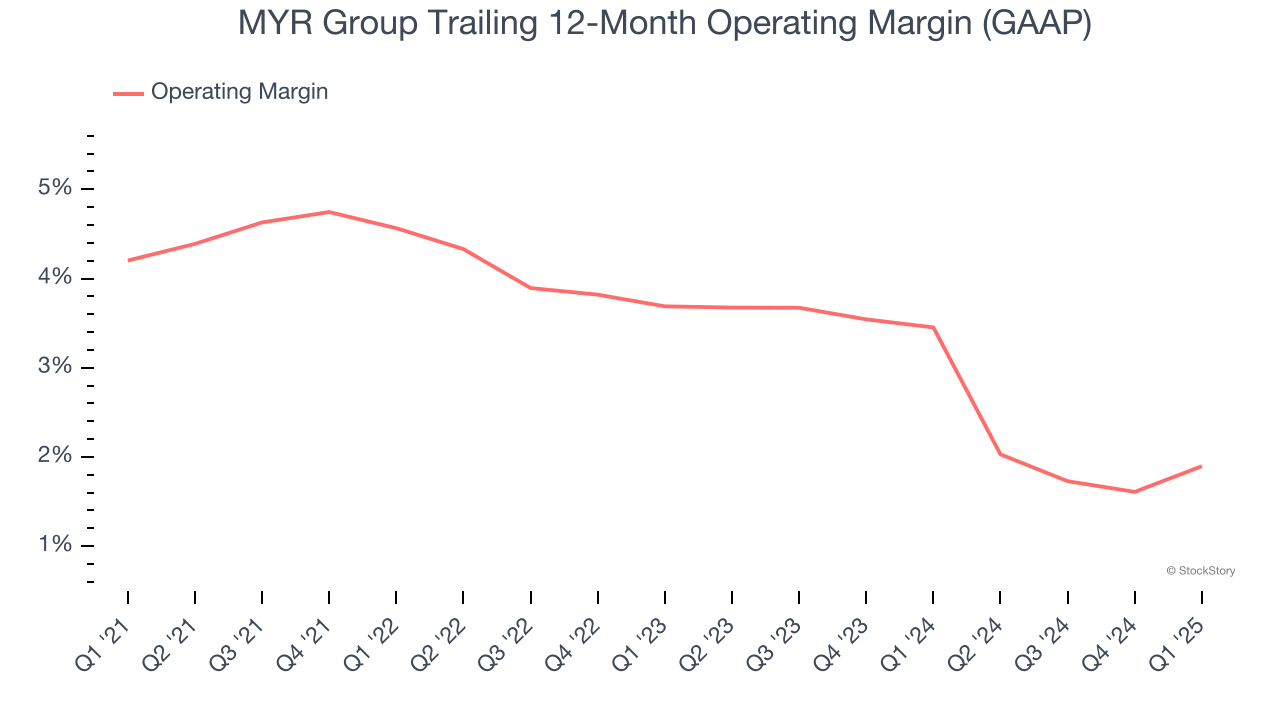
In Q1, MYR Group generated an operating profit margin of 4.1%, up 1.1 percentage points year on year. The increase was encouraging, and because its operating margin rose more than its gross margin, we can infer it was more efficient with expenses such as marketing, R&D, and administrative overhead.
Earnings Per Share
Revenue trends explain a company’s historical growth, but the long-term change in earnings per share (EPS) points to the profitability of that growth – for example, a company could inflate its sales through excessive spending on advertising and promotions.
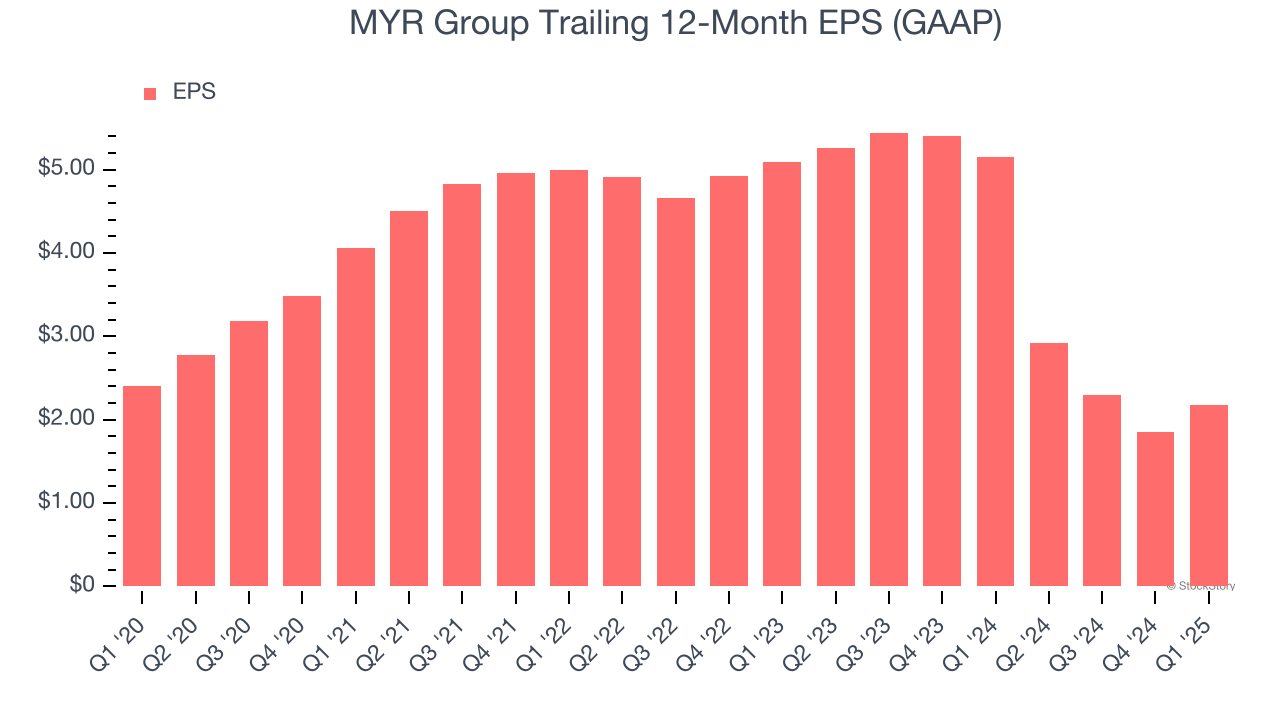
Sadly for MYR Group, its EPS declined by 2% annually over the last five years while its revenue grew by 9.8%. This tells us the company became less profitable on a per-share basis as it expanded due to non-fundamental factors such as interest expenses and taxes.
We can take a deeper look into MYR Group’s earnings to better understand the drivers of its performance. As we mentioned earlier, MYR Group’s operating margin improved this quarter but declined by 2.3 percentage points over the last five years. This was the most relevant factor (aside from the revenue impact) behind its lower earnings; taxes and interest expenses can also affect EPS but don’t tell us as much about a company’s fundamentals.
Like with revenue, we analyze EPS over a more recent period because it can provide insight into an emerging theme or development for the business.
For MYR Group, its two-year annual EPS declines of 34.6% show it’s continued to underperform. These results were bad no matter how you slice the data.
In Q1, MYR Group reported EPS at $1.45, up from $1.12 in the same quarter last year. This print easily cleared analysts’ estimates, and shareholders should be content with the results. Over the next 12 months, Wall Street expects MYR Group’s full-year EPS of $2.18 to grow 186%.
Key Takeaways from MYR Group’s Q1 Results
We were impressed by how significantly MYR Group blew past analysts’ revenue expectations this quarter. We were also glad its EPS outperformed Wall Street’s estimates. Zooming out, we think this was a solid quarter. The stock traded up 3.5% to $126 immediately following the results.
MYR Group may have had a good quarter, but does that mean you should invest right now? What happened in the latest quarter matters, but not as much as longer-term business quality and valuation, when deciding whether to invest in this stock. We cover that in our actionable full research report which you can read here, it’s free.


